Bibb County, Alabama (AL)
County owner-occupied free and clear houses and condos in 2010: 2,685
County owner-occupied houses and condos in 2000: 5,951
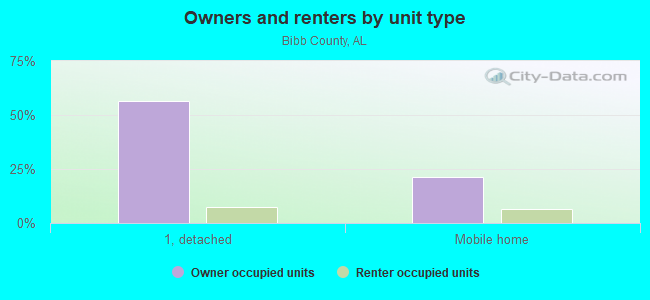
Renter-occupied apartments: 1,942 (it was 1,470 in 2000)
| % of renters here: | 20% |
| State: | 30% |
Land area: 623 sq. mi.
Water area: 3.1 sq. mi.
Population density: 36 people per square mile (low).
Industries providing employment: Educational, health and social services (20.4%), Manufacturing (16.5%), Retail trade (13.8%), Construction (10.6%).
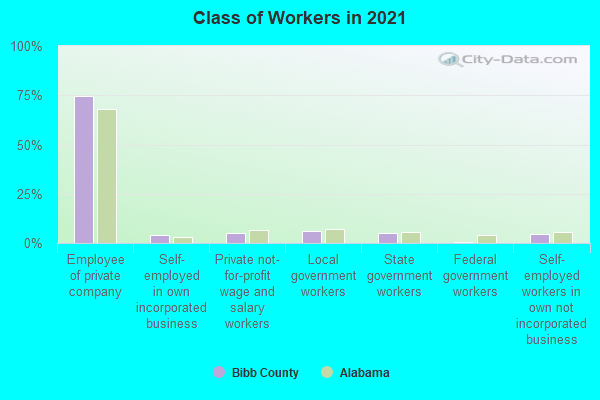
Type of workers:
- Private wage or salary: 83%
- Government: 11%
- Self-employed, not incorporated: 6%
- Unpaid family work: 0%
- OSM Map
- General Map
- Google Map
- MSN Map

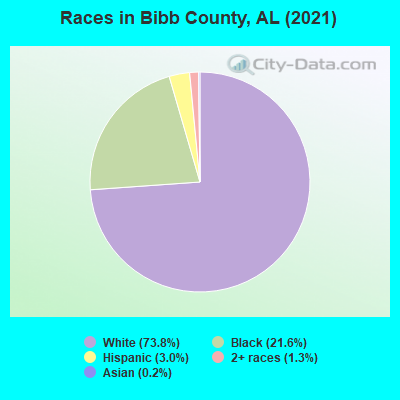
- 16,53474.0%White Non-Hispanic Alone
- 4,52120.2%Black Non-Hispanic Alone
- 6893.1%Hispanic or Latino
- 4992.2%Two or more races
- 760.3%Asian alone
- 230.1%Some other race alone
- 120.05%American Indian and Alaska Native alone
| Median resident age: | 40.6 years |
| Alabama median age: | 39.6 years |
| Males: 11,970 | |
| Females: 10,485 |

 | Alabama finally growing? (146 replies) |
| Metropolitan area definition (44 replies) |
| Alabama County Population Estimates (July 1, 2018) (31 replies) |
| UPDATED: New and Upcoming Projects. (3724 replies) |
| Somewhere around B'ham (15 replies) |
| Huntsville COVID-19 Testing Center (2 replies) |
| Bibb County: | 2.0 people |
| Alabama: | 2 people |
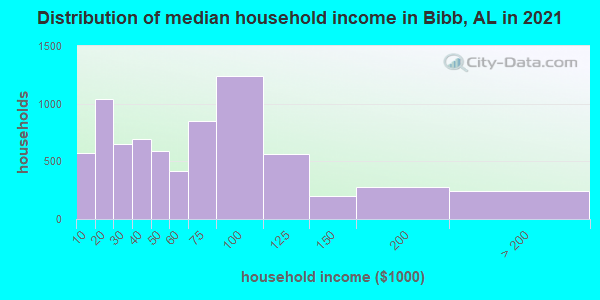
Estimated median household income in 2022: $50,724 ($31,420 in 1999)
| This county: | $50,724 |
| Alabama: | $59,674 |
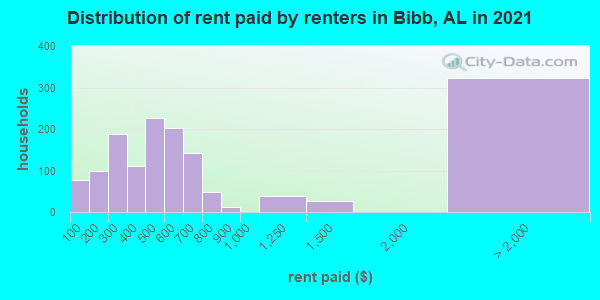
Median contract rent in 2022 for apartments: $469 (lower quartile is $302, upper quartile is $594)
| This county: | $469 |
| State: | $693 |
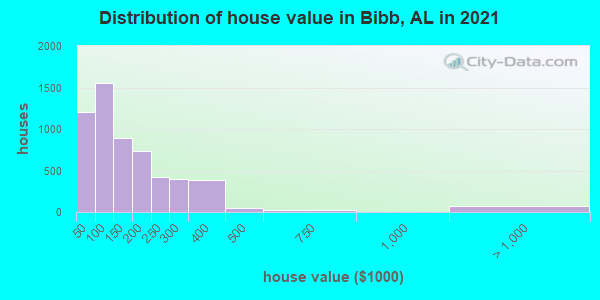
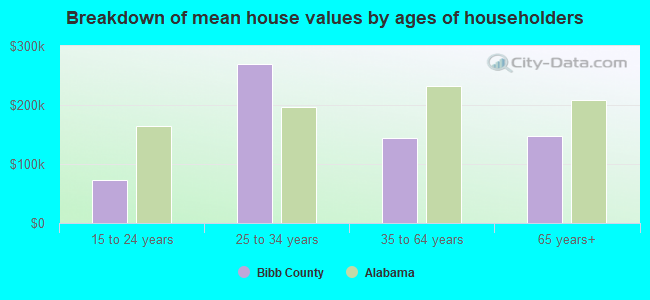
Estimated median house or condo value in 2022: $134,493 (it was $57,400 in 2000)
| Bibb: | $134,493 |
| Alabama: | $200,900 |
Mean price in 2022:
Median monthly housing costs for homes and condos with a mortgage: $1,130Detached houses: $216,803
Here: $216,803 State: $273,076 Townhouses or other attached units: $1,087,011
Here: $1,087,011 State: $222,857 Mobile homes: $72,708
Here: $72,708 State: $77,780
Median monthly housing costs for units without a mortgage: $352
Institutionalized population: 2,194
Crime in 2021 (reported by the sheriff's office or county police, not the county total):
- Murders: 0
- Rapes: 1
- Robberies: 0
- Assaults: 25
- Burglaries: 30
- Thefts: 50
- Auto thefts: 24
Crime in 2020 (reported by the sheriff's office or county police, not the county total):
- Murders: 0
- Rapes: 0
- Robberies: 0
- Assaults: 0
- Burglaries: 0
- Thefts: 0
- Auto thefts: 0
Health of residents in Bibb County based on CDC Behavioral Risk Factor Surveillance System Survey Questionnaires from 2013 to 2021:
General health status score of residents in this county from 1 (poor) to 5 (excellent) is 3.3. This is worse than average.67.5% of residents exercised in the past month. This is less than average.
41.9% of residents smoked 100+ cigarettes in their lives. This is about average.
41.3% of adult residents drank alcohol in the past 30 days. This is less than average.
64.9% of residents visited a dentist within the past year. This is less than average.
Average weight of males is 203 pounds. This is more than average.
Average weight of females is 169 pounds. This is more than average.
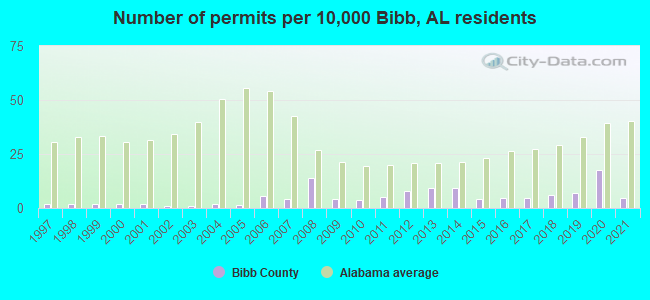
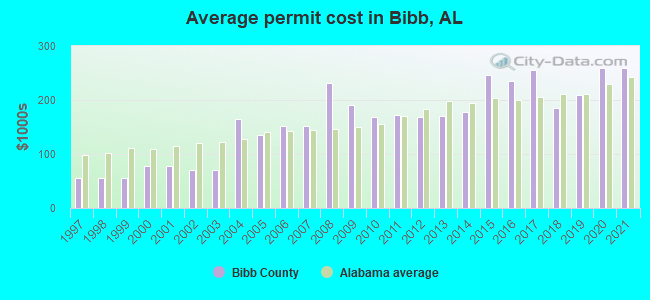
Single-family new house construction building permits:
- 2022: 9 buildings, average cost: $358,300
- 2021: 10 buildings, average cost: $258,500
- 2020: 37 buildings, average cost: $260,300
- 2019: 14 buildings, average cost: $209,000
- 2018: 13 buildings, average cost: $186,400
- 2017: 10 buildings, average cost: $255,100
- 2016: 10 buildings, average cost: $235,600
- 2015: 9 buildings, average cost: $246,900
- 2014: 19 buildings, average cost: $176,700
- 2013: 19 buildings, average cost: $170,100
- 2012: 16 buildings, average cost: $168,200
- 2011: 11 buildings, average cost: $171,800
- 2010: 8 buildings, average cost: $167,900
- 2009: 9 buildings, average cost: $189,800
- 2008: 29 buildings, average cost: $232,200
- 2007: 9 buildings, average cost: $152,400
- 2006: 12 buildings, average cost: $152,400
- 2005: 3 buildings, average cost: $134,900
- 2004: 4 buildings, average cost: $163,600
- 2003: 2 buildings, average cost: $70,000
- 2002: 2 buildings, average cost: $70,000
- 2001: 4 buildings, average cost: $77,500
- 2000: 4 buildings, average cost: $77,500
- 1999: 4 buildings, average cost: $55,000
- 1998: 4 buildings, average cost: $55,000
- 1997: 4 buildings, average cost: $55,000
Median real estate property taxes paid for housing units with mortgages in 2022: $358 (0.2%)
Median real estate property taxes paid for housing units with no mortgage in 2022: $242 (0.2%)
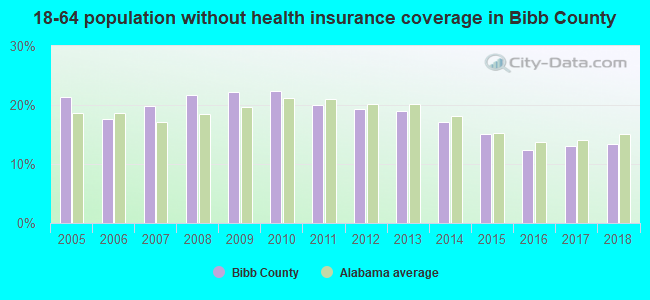
| Bibb County: | 21.3% |
| Alabama: | 16.2% |
Median age of residents in 2022: 40.6 years old
(Males: 40.0 years old, Females: 42.7 years old)
(Median age for: White residents: 43.2 years old, Black residents: 36.6 years old, American Indian residents: 58.0 years old, Asian residents: 67.4 years old, Hispanic or Latino residents: 11.1 years old, Other race residents: 40.3 years old)
Area name: Birmingham-Hoover, AL HUD Metro FMR Area
Fair market rent in 2006 for a 1-bedroom apartment in Bibb County is $521 a month.
Fair market rent for a 2-bedroom apartment is $581 a month.
Fair market rent for a 3-bedroom apartment is $737 a month.
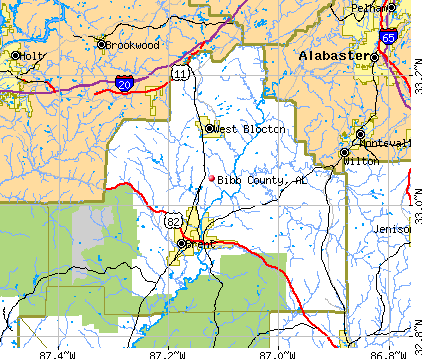
Cities in this county include: Brent, Centreville, Woodstock, West Blocton, Piper-Coleanor, North Bibb.
Neighboring counties: Los Angeles County, California  , Humphreys County, Mississippi , Issaquena County, Mississippi , Glascock County, Georgia
  , Monroe County, Georgia , Van Zandt County, Texas .
| Here: | 2.4% |
| Alabama: | 2.6% |
Current college students: 500
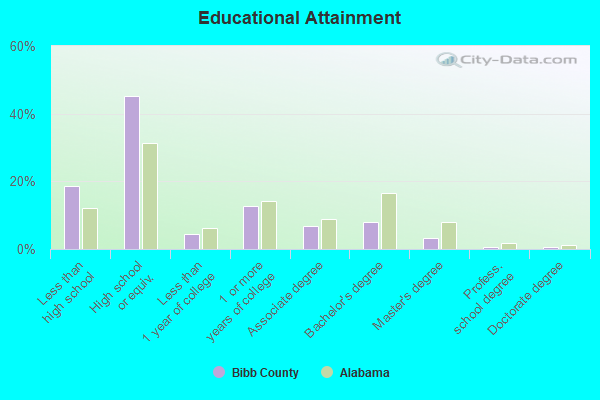
People 25 years of age or older with a high school degree or higher: 78.9%
People 25 years of age or older with a bachelor's degree or higher: 10.9%
Number of foreign born residents: 263 (49.6% naturalized citizens)
| Bibb County: | 1.2% |
| Whole state: | 3.8% |
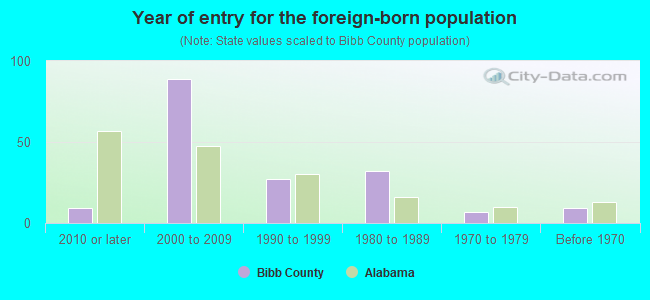
- Year of entry for the foreign-born population
- 72010 or later
- 832000 to 2009
- 621990 to 1999
- 321980 to 1989
- 71970 to 1979
- 9Before 1970
Mean travel time to work (commute): minutes
Percentage of county residents living and working in this county: 98.5%
Housing units in structures:
- One, detached: 5,542
- One, attached: 40
- Two: 128
- 3 or 4: 90
- 5 to 9: 224
- 10 to 19: 85
- 20 to 49: 45
- 50 or more: 109
- Mobile homes: 2,738
- Boats, RVs, vans, etc.: 228
Housing units in Bibb County with a mortgage: 2,083 (123 second mortgage, 0 home equity loan, 130 both second mortgage and home equity loan)
Houses without a mortgage: 52
| Here: | 3.7% with mortgage |
| State: | 97.4% with mortgage |
Religion statistics for Bibb County
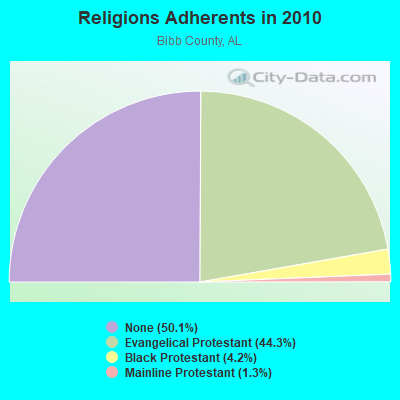
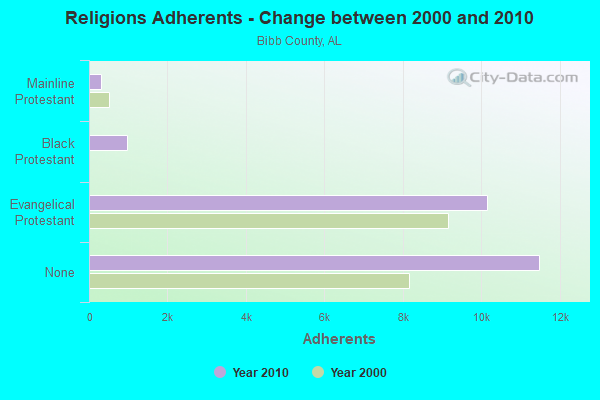
| Religion | Adherents | Congregations |
|---|---|---|
| Evangelical Protestant | 10,159 | 63 |
| Black Protestant | 966 | 8 |
| Mainline Protestant | 302 | 9 |
| Other | 3 | 1 |
| None | 11,485 | - |
Source: Clifford Grammich, Kirk Hadaway, Richard Houseal, Dale E.Jones, Alexei Krindatch, Richie Stanley and Richard H.Taylor. 2012. 2010 U.S.Religion Census: Religious Congregations & Membership Study. Association of Statisticians of American Religious Bodies. Jones, Dale E., et al. 2002. Congregations and Membership in the United States 2000. Nashville, TN: Glenmary Research Center.
Food Environment Statistics:
| Bibb County: | 3.26 / 10,000 pop. |
| State: | 1.89 / 10,000 pop. |
| Bibb County: | 7.91 / 10,000 pop. |
| Alabama: | 6.32 / 10,000 pop. |
| This county: | 3.72 / 10,000 pop. |
| State: | 5.75 / 10,000 pop. |
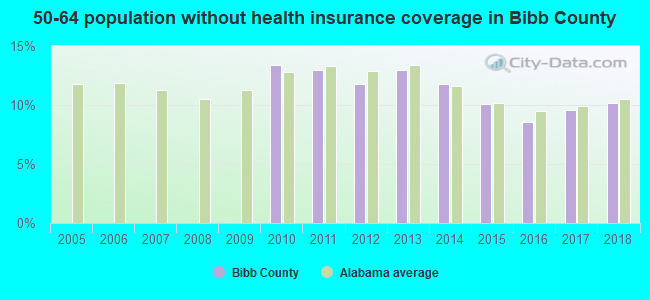
| Bibb County: | 11.6% |
| Alabama: | 11.8% |
| Bibb County: | 31.7% |
| State: | 31.7% |
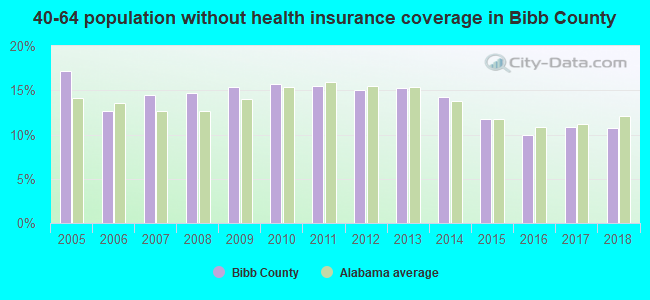
| Here: | 15.4% |
| State: | 13.5% |
Agriculture in Bibb County:
Average size of farms: 240 acresAverage value of agricultural products sold per farm: $8,907
Average value of crops sold per acre for harvested cropland: $87.23
The value of livestock, poultry, and their products as a percentage of the total market value of agricultural products sold: 75.02%
Average total farm production expenses per farm: $7,888
Harvested cropland as a percentage of land in farms: 10.62%
Irrigated harvested cropland as a percentage of land in farms: 0.65%
Average market value of all machinery and equipment per farm: $34,839
The percentage of farms operated by a family or individual: 98.40%
Average age of principal farm operators: 58 years
Average number of cattle and calves per 100 acres of all land in farms: 11.06
Corn for grain: 167 harvested acres
Vegetables: 85 harvested acres
Land in orchards: 63 acres
Earthquake activity:
Bibb County-area historical earthquake activity is significantly above Alabama state average. It is 122% greater than the overall U.S. average.On 1/18/1999 at 07:00:53, a magnitude 4.8 (4.8 MB, 4.0 LG, Depth: 0.6 mi, Class: Light, Intensity: IV - V) earthquake occurred 26.4 miles away from Bibb County center
On 4/29/2003 at 08:59:39, a magnitude 4.9 (4.4 MB, 4.6 MW, 4.9 LG) earthquake occurred 132.3 miles away from the county center
On 10/24/1997 at 08:35:17, a magnitude 4.9 (4.8 MB, 4.2 MS, 4.9 LG, Depth: 6.2 mi) earthquake occurred 132.9 miles away from the county center
On 6/24/1975 at 11:11:36, a magnitude 4.5 (4.5 MB) earthquake occurred 62.6 miles away from the county center
On 11/7/2004 at 11:20:21, a magnitude 4.3 (4.3 MW, Depth: 3.1 mi) earthquake occurred 54.3 miles away from Bibb County center
On 4/29/2003 at 08:59:39, a magnitude 4.6 (4.6 MW, Depth: 12.3 mi) earthquake occurred 132.2 miles away from the county center
Magnitude types: regional Lg-wave magnitude (LG), body-wave magnitude (MB), surface-wave magnitude (MS), moment magnitude (MW)
Most recent natural disasters:
- Alabama Covid-19 Pandemic, Incident Period: January 20, 2020, FEMA Id: 4503, Natural disaster type: Other
- Alabama Severe Storms, Tornadoes, and Straight-line Winds, Incident Period: April 27, 2011 to May 31, 2011, Emergency Declared EM-3319: April 27, 2011, FEMA Id: 3319, Natural disaster type: Storm, Tornado, Wind
- Alabama Severe Storms, Tornadoes, Straight-line Winds, and Flooding, Incident Period: April 15, 2011 to May 31, 2011, Major Disaster (Presidential) Declared DR-1971: April 28, 2011, FEMA Id: 1971, Natural disaster type: Storm, Tornado, Flood, Wind
- Alabama Hurricane Gustav, Incident Period: August 29, 2008 to September 03, 2008, Emergency Declared EM-3292: August 30, 2008, FEMA Id: 3292, Natural disaster type: Hurricane
- Alabama Hurricane Katrina, Incident Period: August 29, 2005 to September 26, 2005, Major Disaster (Presidential) Declared DR-1605: August 29, 2005, FEMA Id: 1605, Natural disaster type: Hurricane
- Alabama Hurricane Katrina Evacuation, Incident Period: August 29, 2005 to October 01, 2005, Emergency Declared EM-3237: September 10, 2005, FEMA Id: 3237, Natural disaster type: Hurricane
- Alabama Hurricane Dennis, Incident Period: July 10, 2005 to July 16, 2005, Major Disaster (Presidential) Declared DR-1593: July 10, 2005, FEMA Id: 1593, Natural disaster type: Hurricane
- Alabama Hurricane Ivan, Incident Period: September 13, 2004 to September 30, 2004, Major Disaster (Presidential) Declared DR-1549: September 15, 2004, FEMA Id: 1549, Natural disaster type: Hurricane
- Alabama Severe Storms, Tornadoes and Flooding, Incident Period: May 05, 2003 to May 30, 2003, Major Disaster (Presidential) Declared DR-1466: May 12, 2003, FEMA Id: 1466, Natural disaster type: Storm, Tornado, Flood
- Alabama Severe Storms and Tornadoes, Incident Period: November 05, 2002 to November 12, 2002, Major Disaster (Presidential) Declared DR-1442: November 14, 2002, FEMA Id: 1442, Natural disaster type: Storm, Tornado
- 4 other natural disasters have been reported since 1953.
The number of natural disasters in Bibb County (14) is near the US average (15).
Major Disasters (Presidential) Declared: 8
Emergencies Declared: 5
Causes of natural disasters: Storms: 6, Hurricanes: 5, Tornadoes: 5, Floods: 4, Winds: 2, Drought: 1, Snowfall: 1, Winter Storm: 1, Other: 1 (Note: some incidents may be assigned to more than one category).
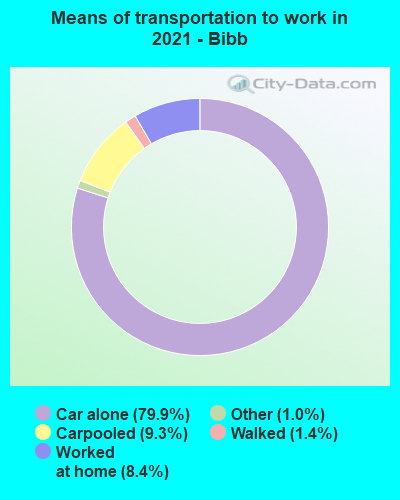
Means of transportation to work:
- Drove a car alone: 4,010 (80.7%)
- Carpooled: 415 (8.4%)
- Taxicab, motorcycle, or other means: 41 (0.8%)
- Walked: 64 (1.3%)
- Worked at home: 428 (8.6%)
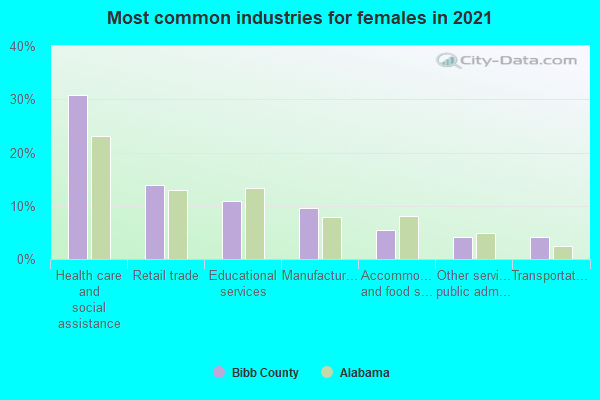
- Health care and social assistance (20%)
- Retail trade (12%)
- Educational services (11%)
- Manufacturing (11%)
- Other services, except public administration (6%)
- Transportation and warehousing (5%)
- Finance and insurance (5%)
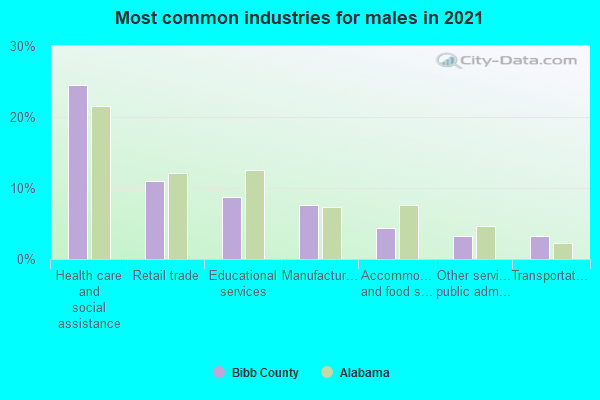
- Health care and social assistance (24%)
- Retail trade (14%)
- Educational services (13%)
- Manufacturing (12%)
- Other services, except public administration (7%)
- Transportation and warehousing (5%)
- Finance and insurance (5%)
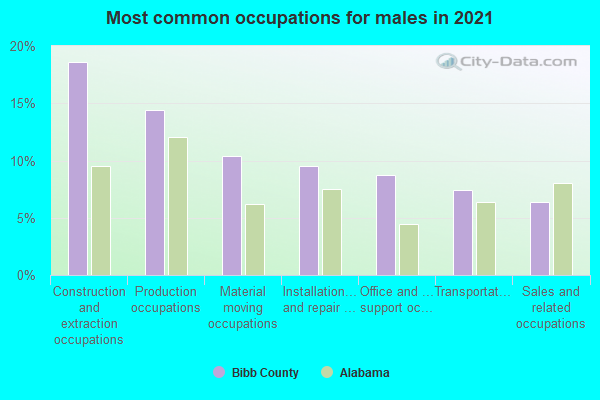
- Construction and extraction occupations (18%)
- Production occupations (15%)
- Material moving occupations (11%)
- Installation, maintenance, and repair occupations (10%)
- Office and administrative support occupations (8%)
- Transportation occupations (8%)
- Sales and related occupations (6%)
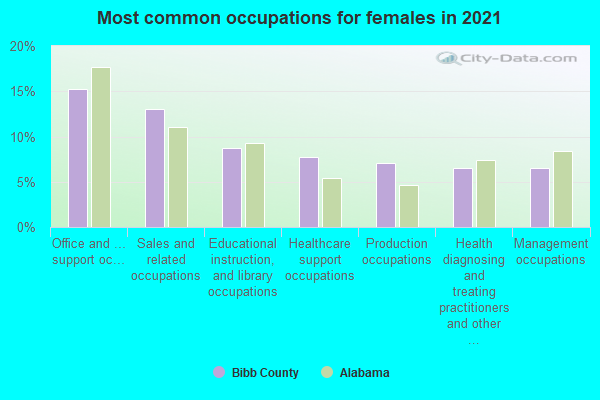
- Office and administrative support occupations (15%)
- Sales and related occupations (12%)
- Production occupations (10%)
- Educational instruction, and library occupations (9%)
- Healthcare support occupations (7%)
- Health diagnosing and treating practitioners and other technical occupations (6%)
- Management occupations (5%)
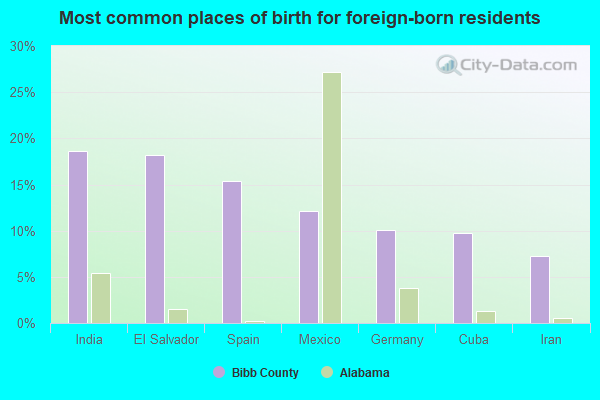
- Mexico (24%)
- India (19%)
- Spain (12%)
- Germany (11%)
- Korea (10%)
- Cuba (7%)
- Iran (6%)
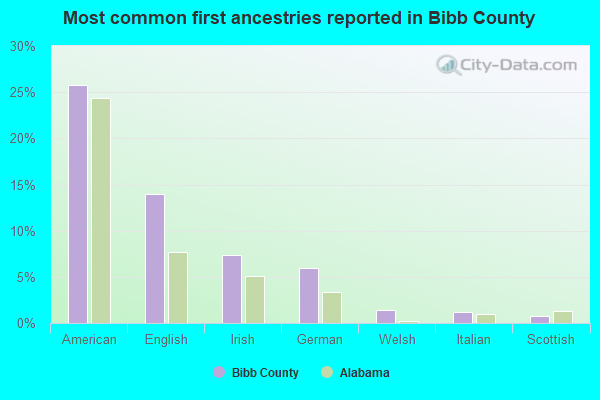
- American (24%)
- English (21%)
- Irish (9%)
- German (6%)
- Welsh (2%)
- French (except Basque) (1%)
- Italian (1%)
People in group quarters in Bibb County, Alabama in 2010:
- 1,924 people in state prisons
- 117 people in nursing facilities/skilled-nursing facilities
- 83 people in local jails and other municipal confinement facilities
- 57 people in residential treatment centers for juveniles (non-correctional)
- 30 people in group homes intended for adults
- 13 people in group homes for juveniles (non-correctional)
People in group quarters in Bibb County, Alabama in 2000:
- 900 people in state prisons
- 215 people in other noninstitutional group quarters
- 106 people in nursing homes
- 18 people in homes for abused, dependent, and neglected children
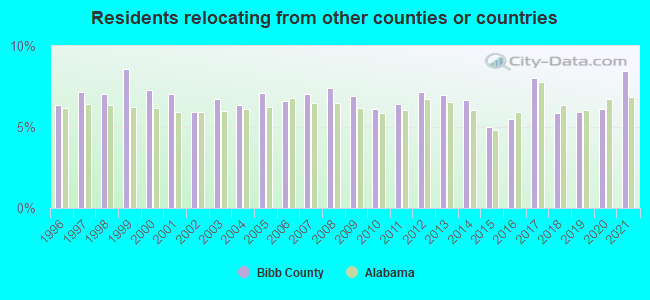
8.47% of this county's 2021 resident taxpayers lived in other counties in 2020 ($35,966 average adjusted gross income)
| Here: | 8.47% |
| Alabama average: | 6.87% |
10 or fewer of this county's residents moved from foreign countries.
7.52% relocated from other counties in Alabama ($31,572 average AGI)
0.95% relocated from other states ($4,394 average AGI)
Bibb County: 0.95% Alabama average: 3.08%
Top counties from which taxpayers relocated into this county between 2020 and 2021:
| from Tuscaloosa County, AL | |
| from Jefferson County, AL | |
| from Shelby County, AL | |
| from Chilton County, AL |
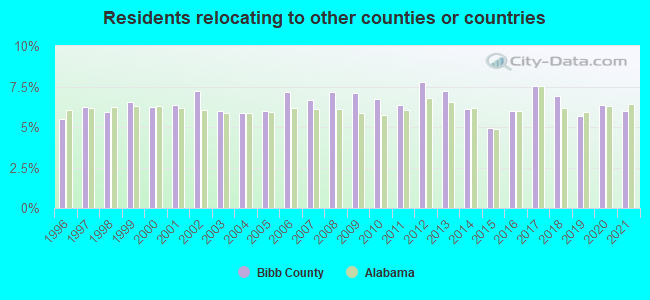
6.00% of this county's 2020 resident taxpayers moved to other counties in 2021 ($42,683 average adjusted gross income)
| Here: | 6.00% |
| Alabama average: | 6.41% |
10 or fewer of this county's residents moved to foreign countries.
5.29% relocated to other counties in Alabama ($37,092 average AGI)
0.71% relocated to other states ($5,592 average AGI)
Bibb County: 0.71% Alabama average: 2.60%
Top counties to which taxpayers relocated from this county between 2020 and 2021:
| to Tuscaloosa County, AL | |
| to Jefferson County, AL | |
| to Shelby County, AL | |
| to Chilton County, AL |
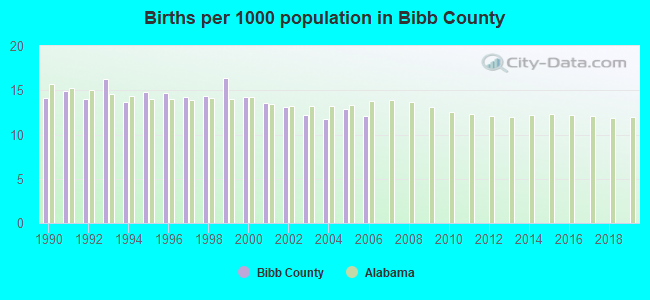
Births per 1000 population from 1990 to 1999: 14.7
Births per 1000 population from 2000 to 2006: 12.8
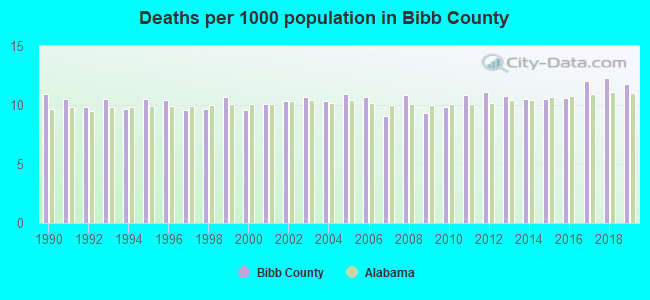
Deaths per 1000 population from 1990 to 1999: 10.2
Deaths per 1000 population from 2000 to 2009: 10.2
Deaths per 1000 population from 2010 to 2020: 11.2
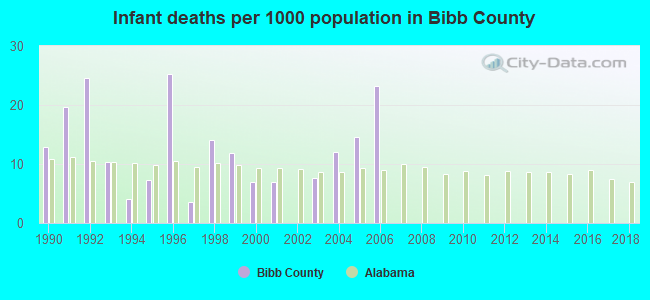
Infant deaths per 1000 live births from 1990 to 1999: 13.4
Infant deaths per 1000 live births from 2000 to 2006: 10.2
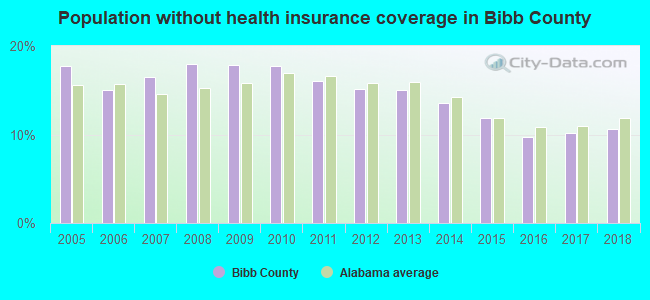
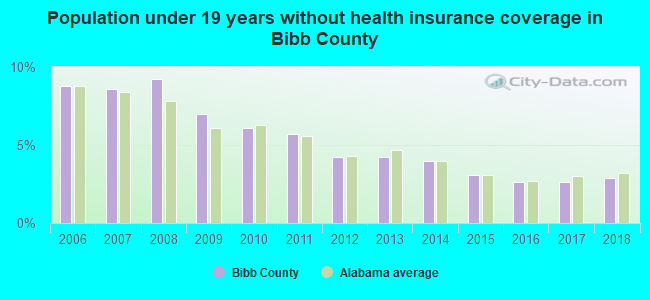
Persons under 19 years old without health insurance coverage in 2018: 2.9%
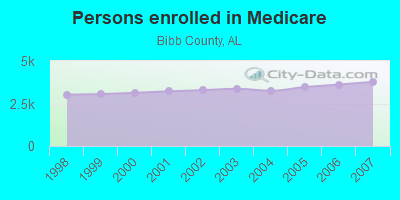
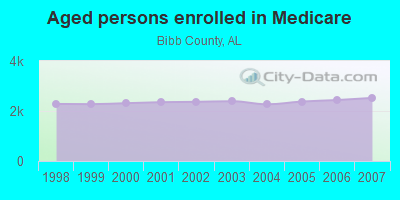
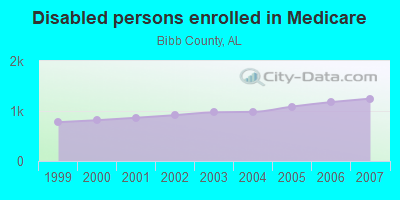
Persons enrolled in hospital insurance and/or supplemental medical insurance (Medicare) in July 1, 2007: 3,771 (2,523 aged, 1,248 disabled)
Children under 18 without health insurance coverage in 2007: 422 (8%)
Most common underlying causes of death in Bibb County, Alabama in 1999 - 2019:
- Bronchus or lung, unspecified - Malignant neoplasms (161)
- Stroke, not specified as haemorrhage or infarction (140)
- Acute myocardial infarction, unspecified (125)
- Congestive heart failure (88)
- Cardiovascular disease, unspecified (31)
- Atherosclerotic heart disease (21)
- Chronic obstructive pulmonary disease, unspecified (11)
- Alzheimer disease, unspecified (10)
- Cardiac arrest, unspecified (10)
Population without health insurance coverage in 2000: 16%
Children under 18 without health insurance coverage in 2000: 13%
Suicides per 1,000,000 population from 2000 to 2006: 162.5. This is less than state average.
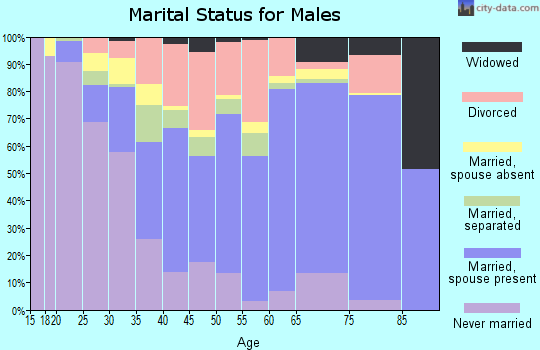
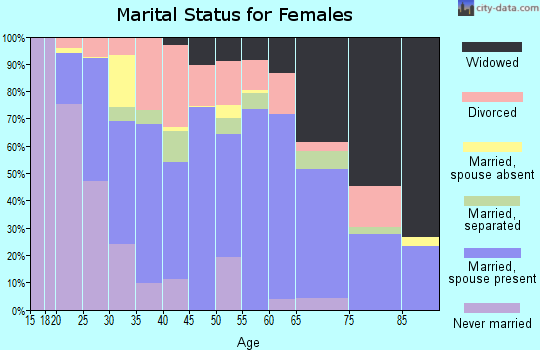
Household type by relationship:
Households: 22,455- Male householders: 4,117 (1,329 living alone), Female householders: 3,388 (926 living alone)
3,763 spouses (3,717 opposite-sex spouses), 239 unmarried partners, (239 opposite-sex unmarried partners), 6,465 children (5,929 natural, 233 adopted, 307 stepchildren), 1,576 grandchildren, 160 brothers or sisters, 329 parents, 10 foster children, 410 other relatives, 359 non-relatives
- In group quarters: 1,511
Size of family households: 2,422 2-persons, 997 3-persons, 1,024 4-persons, 372 5-persons, 144 6-persons, 94 7-or-more-persons.
Size of nonfamily households: 2,260 1-person, 183 2-persons, 2 3-persons.
2,462 married couples with children.
1,022 single-parent households (530 men, 492 women).
97.1% of residents of Bibb speak English at home.
2.1% of residents speak Spanish at home (69% speak English very well, 19% speak English well, 11% speak English not well).
0.2% of residents speak other Indo-European language at home (100% speak English very well).
0.1% of residents speak Asian or Pacific Island language at home (100% speak English well).
In fiscal year 2004:
Federal Government expenditure: $112,988,000 ($5,300 per capita)
Department of Defense expenditure: $3,068,000
Federal direct payments to individuals for retirement and disability: $56,470,000
Federal other direct payments to individuals: $29,392,000
Federal direct payments not to individuals: $276,000
Federal grants: $21,514,000
Federal procurement contracts: $1,004,000 ($39,000 Department of Defense)
Federal salaries and wages: $4,333,000 ($750,000 Department of Defense)
Federal Government direct loans: $588,000
Federal guaranteed/insured loans: $2,685,000
Federal Government insurance: $905,000
Population change from April 1, 2000 to July 1, 2005:
Births: 1,436| Here: | 67 per 1000 residents |
| State: | 70 per 1000 residents |
Deaths: 1,141
| Here: | 53 per 1000 residents |
| State: | 53 per 1000 residents |
Net international migration: +38
| Here: | +2 per 1000 residents |
| State: | +6 per 1000 residents |
Net internal migration: +1,307
| Here: | +61 per 1000 residents |
| State: | +2 per 1000 residents |
Total withdrawal of fresh water for public supply: 3.78 millions of gallons per day (all from ground)
| Here: | 6.0 |
| State: | 6.5 |
| Here: | 5.0 |
| State: | 4.7 |
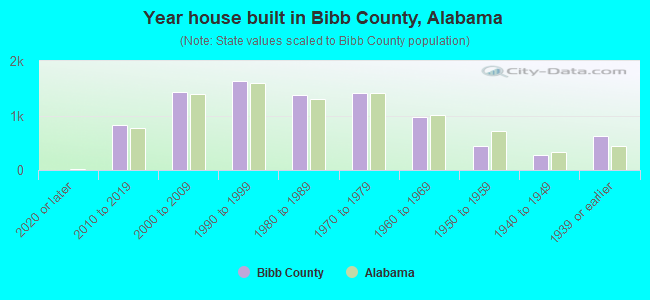
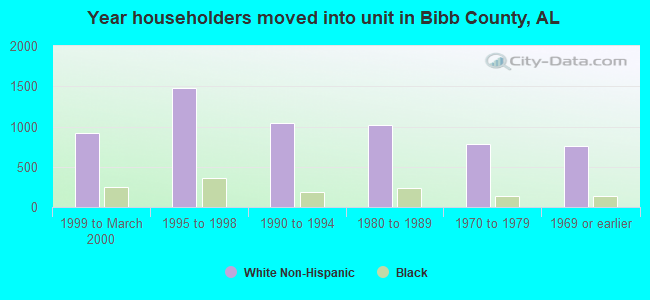
- Year house built in Bibb County, Alabama
- 122020 or later
- 7672010 to 2019
- 1,4622000 to 2009
- 1,4771990 to 1999
- 1,4491980 to 1989
- 1,4961970 to 1979
- 8111960 to 1969
- 5031950 to 1959
- 3281940 to 1949
- 7001939 or earlier
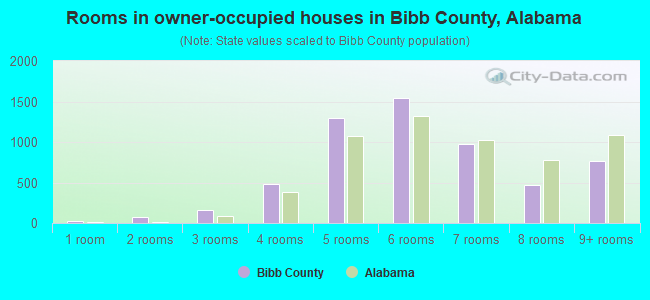
- Rooms in owner-occupied houses in Bibb County, Alabama
- 351 room
- 1272 rooms
- 1713 rooms
- 4934 rooms
- 1,3205 rooms
- 1,4806 rooms
- 9617 rooms
- 4208 rooms
- 7609+ rooms
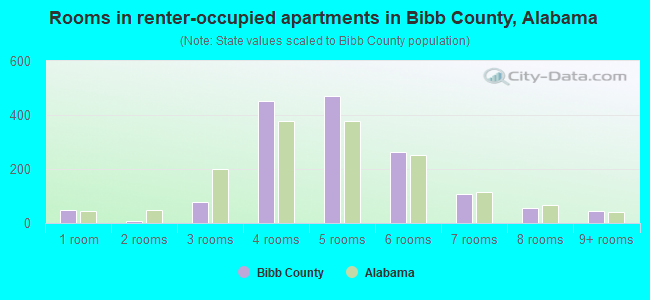
- Rooms in renter-occupied apartments in Bibb County, Alabama
- 421 room
- 72 rooms
- 863 rooms
- 5034 rooms
- 5365 rooms
- 3076 rooms
- 1417 rooms
- 618 rooms
- 1149+ rooms
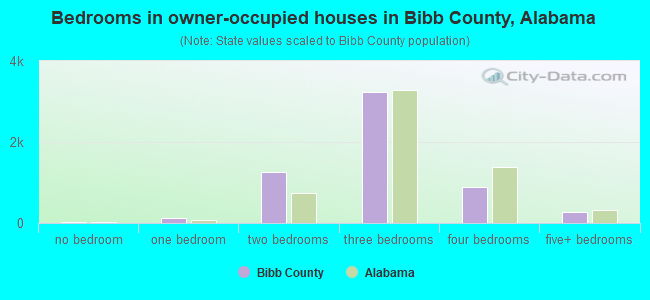
- Bedrooms in owner-occupied houses in Bibb County, Alabama
- 49no bedroom
- 1531 bedroom
- 1,1302 bedrooms
- 3,3183 bedrooms
- 8484 bedrooms
- 2245+ bedrooms
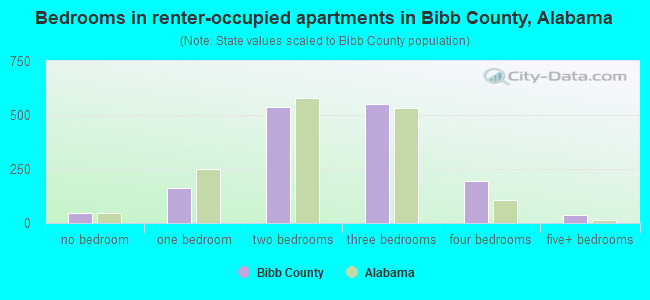
- Bedrooms in renter-occupied apartments in Bibb County, Alabama
- 42no bedroom
- 1491 bedroom
- 6732 bedrooms
- 6493 bedrooms
- 2224 bedrooms
- 655+ bedrooms
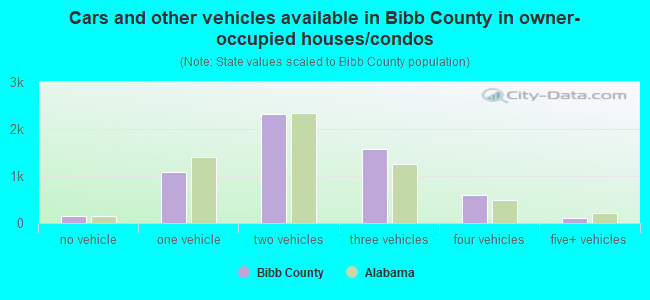
- Cars and other vehicles available in Bibb County in owner-occupied houses/condos
- 228no vehicle
- 1,0701 vehicle
- 2,1822 vehicles
- 1,4043 vehicles
- 6414 vehicles
- 2125+ vehicles
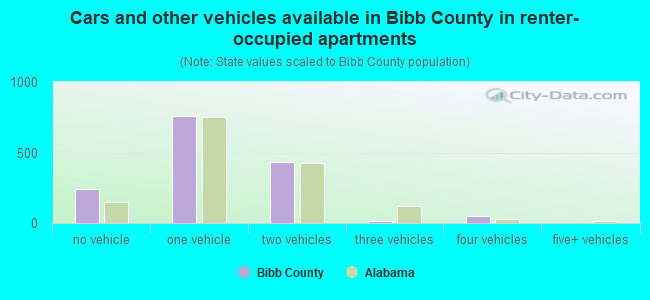
- Cars and other vehicles available in Bibb County in renter-occupied apartments
- 311no vehicle
- 8581 vehicle
- 4862 vehicles
- 443 vehicles
- 904 vehicles
- 05+ vehicles
86.9% of Bibb County residents lived in the same house 1 years ago.
Out of people who lived in different houses, 25% lived in this county.
Out of people who lived in different counties, 85% lived in Alabama.
| Bibb County: | 86.9% |
| State average: | 87.6% |
Place of birth for U.S.-born residents:
- This state: 18,964
- Other state: 2,804
- Northeast: 281
- Midwest: 849
- South: 1,470
- West: 179
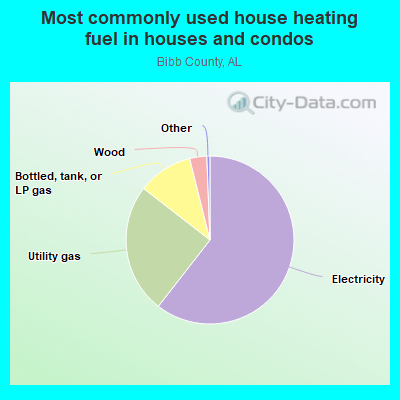
- 66.5%Electricity
- 20.2%Utility gas
- 8.9%Bottled, tank, or LP gas
- 3.5%Wood
- 0.8%No fuel used
- 0.1%Other fuel
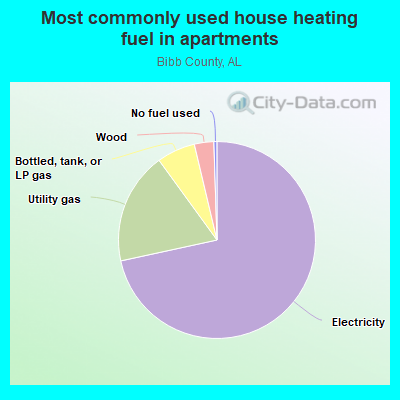
- 68.2%Electricity
- 17.6%Utility gas
- 11.3%Bottled, tank, or LP gas
- 2.7%Wood
- 0.2%No fuel used
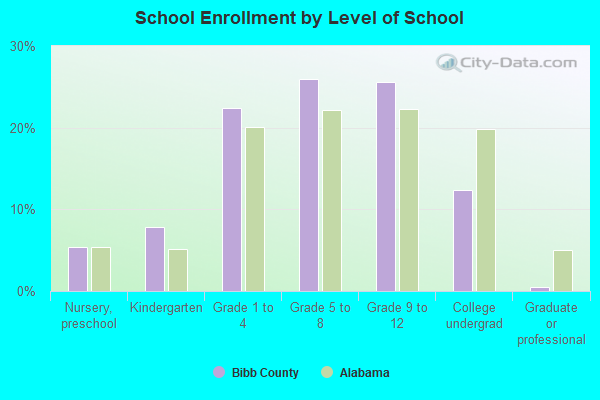
Private vs. public school enrollment:
| Here: | 10.2% |
| Alabama: | 14.7% |
| Here: | 39.1% |
| Alabama: | 16.3% |
| Here: | 19.7% |
| Alabama: | 14.6% |

Bibb County government finances - Expenditure in 2017:
- Charges - Regular Highways: $1,030,000
Other: $725,000
- Current Operations - Regular Highways: $4,719,000
Police Protection: $2,239,000
Central Staff Services: $1,786,000
Health - Other: $183,000
Elementary and Secondary Education: $13,000
- General - Interest on Debt: $198,000
- Long Term Debt - Beginning Outstanding - Unspecified Public Purpose: $4,472,000
Outstanding Unspecified Public Purpose: $3,986,000
Retired Unspecified Public Purpose: $486,000
- Miscellaneous - General Revenue - Other: $51,000
- Other Funds - Cash and Securities: $2,746,000
- State Intergovernmental - Highways: $1,345,000
- Tax - Property: $1,979,000
General Sales and Gross Receipts: $1,085,000
Other: $121,000
Other License: $16,000
Bibb County government finances - Revenue in 2017:
- Charges - Regular Highways: $1,030,000
Other: $725,000
- Current Operations - Regular Highways: $4,719,000
Police Protection: $2,239,000
Central Staff Services: $1,786,000
Health - Other: $183,000
Elementary and Secondary Education: $13,000
- General - Interest on Debt: $198,000
- Long Term Debt - Beginning Outstanding - Unspecified Public Purpose: $4,472,000
Outstanding Unspecified Public Purpose: $3,986,000
Retired Unspecified Public Purpose: $486,000
- Miscellaneous - General Revenue - Other: $51,000
- Other Funds - Cash and Securities: $2,746,000
- State Intergovernmental - Highways: $1,345,000
- Tax - Property: $1,979,000
General Sales and Gross Receipts: $1,085,000
Other: $121,000
Other License: $16,000
Bibb County government finances - Debt in 2017:
- Charges - Regular Highways: $1,030,000
Other: $725,000
- Current Operations - Regular Highways: $4,719,000
Police Protection: $2,239,000
Central Staff Services: $1,786,000
Health - Other: $183,000
Elementary and Secondary Education: $13,000
- General - Interest on Debt: $198,000
- Long Term Debt - Beginning Outstanding - Unspecified Public Purpose: $4,472,000
Outstanding Unspecified Public Purpose: $3,986,000
Retired Unspecified Public Purpose: $486,000
- Miscellaneous - General Revenue - Other: $51,000
- Other Funds - Cash and Securities: $2,746,000
- State Intergovernmental - Highways: $1,345,000
- Tax - Property: $1,979,000
General Sales and Gross Receipts: $1,085,000
Other: $121,000
Other License: $16,000
Bibb County government finances - Cash and Securities in 2017:
- Charges - Regular Highways: $1,030,000
Other: $725,000
- Current Operations - Regular Highways: $4,719,000
Police Protection: $2,239,000
Central Staff Services: $1,786,000
Health - Other: $183,000
Elementary and Secondary Education: $13,000
- General - Interest on Debt: $198,000
- Long Term Debt - Beginning Outstanding - Unspecified Public Purpose: $4,472,000
Outstanding Unspecified Public Purpose: $3,986,000
Retired Unspecified Public Purpose: $486,000
- Miscellaneous - General Revenue - Other: $51,000
- Other Funds - Cash and Securities: $2,746,000
- State Intergovernmental - Highways: $1,345,000
- Tax - Property: $1,979,000
General Sales and Gross Receipts: $1,085,000
Other: $121,000
Other License: $16,000
Supplemental Security Income (SSI) in 2006:
- Total number of recipients: 1,049
- Number of aged recipients: 72
- Number of blind and disabled recipients: 977
- Number of recipients under 18: 193
- Number of recipients between 18 and 64: 677
- Number of recipients older than 64: 179
- Number of recipients also receiving OASDI: 439
- Amount of payments (thousands of dollars): 451
| Most common first names in Bibb County, AL among deceased individuals | ||
| Name | Count | Lived (average) |
|---|---|---|
| James | 182 | 71.5 years |
| John | 141 | 74.2 years |
| William | 113 | 71.7 years |
| Mary | 113 | 78.3 years |
| Willie | 80 | 73.7 years |
| Robert | 78 | 71.1 years |
| George | 61 | 72.1 years |
| Annie | 52 | 79.2 years |
| Henry | 51 | 71.8 years |
| Jessie | 44 | 75.9 years |
| Most common last names in Bibb County, AL among deceased individuals | ||
| Last name | Count | Lived (average) |
|---|---|---|
| Smith | 84 | 72.0 years |
| Mitchell | 70 | 74.3 years |
| Jones | 65 | 74.9 years |
| Johnson | 60 | 72.8 years |
| Hubbard | 48 | 77.9 years |
| Williams | 43 | 76.3 years |
| Murphy | 40 | 77.0 years |
| Martin | 37 | 72.4 years |
| James | 33 | 72.7 years |
| Elam | 33 | 76.0 years |
| Businesses in Bibb County, AL | ||||
| Name | Count | Name | Count | |
|---|---|---|---|---|
| Advance Auto Parts | 1 | Pizza Hut | 1 | |
| CVS | 1 | Subway | 1 | |
| H&R Block | 2 | T-Mobile | 1 | |
| KFC | 1 | U-Haul | 1 | |
| Lane Furniture | 1 | UPS | 1 | |
| Little Caesars Pizza | 1 | Walmart | 1 | |
| McDonald's | 1 | |||
Bibb County on our top lists:
- #88 on the list of "Top 101 counties with the smallest number of people without health insurance coverage in 2000"