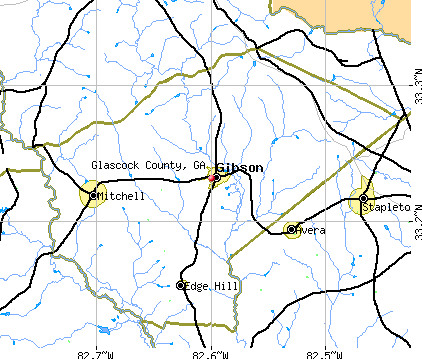
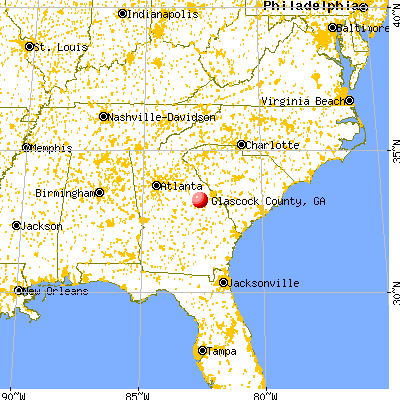
Glascock County, Georgia (GA)
County owner-occupied free and clear houses and condos in 2010: 418
County owner-occupied houses and condos in 2000: 805
Renter-occupied apartments: 317 (it was 199 in 2000)
| % of renters here: | 20% |
| State: | 34% |
Land area: 144 sq. mi.
Water area: 0.3 sq. mi.
Population density: 20 people per square mile (low).
Industries providing employment: Manufacturing (26.6%), Educational, health and social services (19.4%), Retail trade (12.0%).
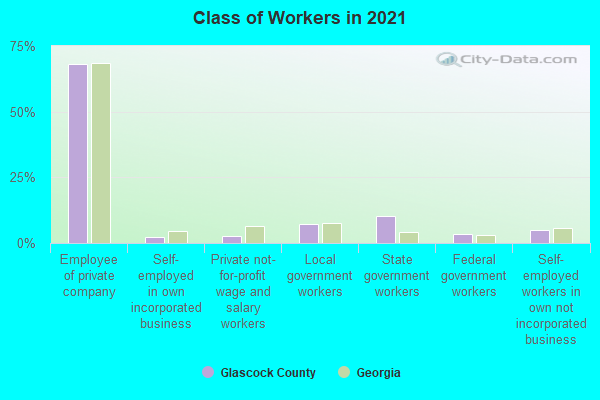
Type of workers:
- Private wage or salary: 76%
- Government: 18%
- Self-employed, not incorporated: 6%
- Unpaid family work: 0%
- OSM Map
- General Map
- Google Map
- MSN Map

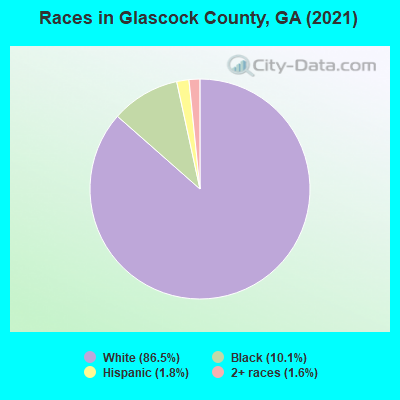
- 2,51486.7%White Non-Hispanic Alone
- 30810.6%Black Non-Hispanic Alone
- 391.3%Two or more races
- 381.3%Hispanic or Latino
- 20.07%Native Hawaiian and Other
Pacific Islander alone
| Median resident age: | 43.7 years |
| Georgia median age: | 37.6 years |
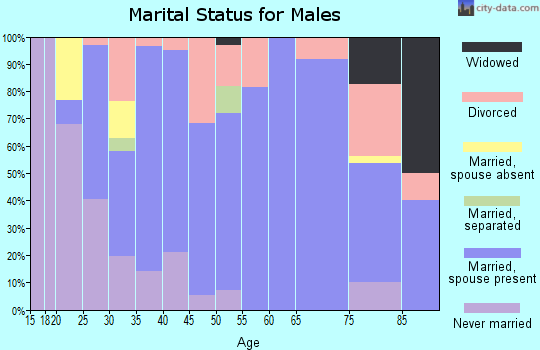
| Males: 1,345 | |
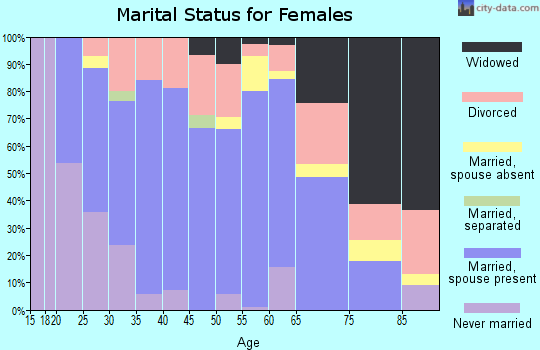
| Females: 1,609 |

 | Georgia tornado count by county (1950-2018) (1 reply) |
| Latest census estimates put Augusta-Richmond population at 197,182 (4 replies) |
| gibson ga. nice town? (17 replies) |
| Milllegeville, Mitchell, Sandersville (3 replies) |
| Glascock County: | 2.0 people |
| Georgia: | 3 people |
Estimated median household income in 2022: $61,724 ($29,743 in 1999)
| This county: | $61,724 |
| Georgia: | $72,837 |
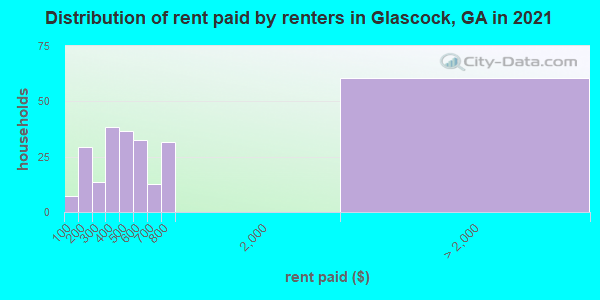
Median contract rent in 2022 for apartments: $485 (lower quartile is $245, upper quartile is $643)
| This county: | $485 |
| State: | $1065 |
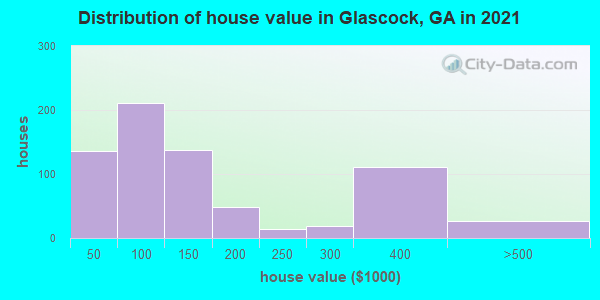
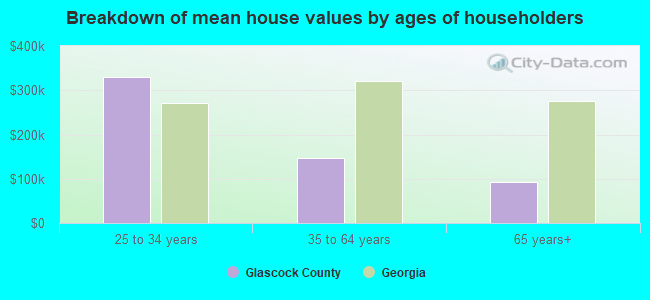
Estimated median house or condo value in 2022: $141,867 (it was $50,100 in 2000)
| Glascock: | $141,867 |
| Georgia: | $297,400 |
Mean price in 2022:
Median monthly housing costs for homes and condos with a mortgage: $1,628Detached houses: $236,583
Here: $236,583 State: $376,364 Mobile homes: $76,473
Here: $76,473 State: $102,413
Median monthly housing costs for units without a mortgage: $385
Institutionalized population: 89
Crime in 2021 (reported by the sheriff's office or county police, not the county total):
- Murders: 0
- Rapes: 1
- Robberies: 0
- Assaults: 9
- Burglaries: 7
- Thefts: 19
- Auto thefts: 4
Crime in 2020 (reported by the sheriff's office or county police, not the county total):
- Murders: 0
- Rapes: 1
- Robberies: 0
- Assaults: 1
- Burglaries: 3
- Thefts: 9
- Auto thefts: 0
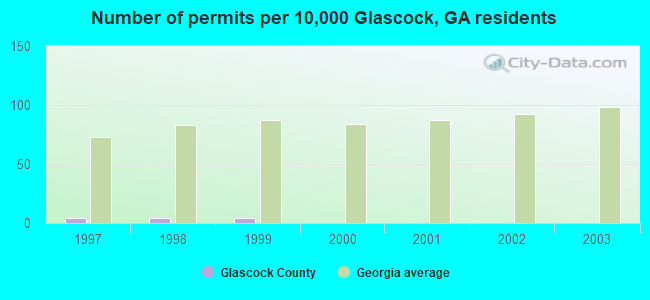
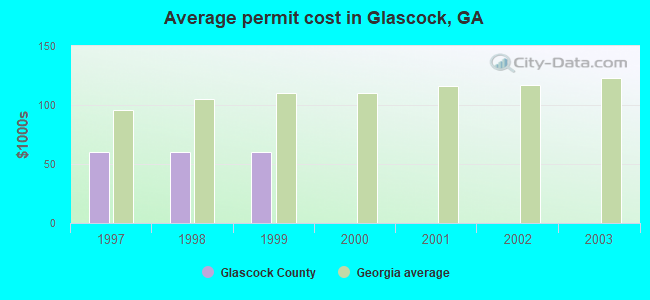
Single-family new house construction building permits:
- 2003: 0 buildings
- 2002: 0 buildings
- 2001: 0 buildings
- 2000: 0 buildings
- 1999: 1 building, cost: $60,000
- 1998: 1 building, cost: $60,000
- 1997: 1 building, cost: $60,000
Median real estate property taxes paid for housing units in 2000:
| Glascock County: | |
| Georgia: |

| Glascock County: | 14.5% |
| Georgia: | 12.7% |
Median age of residents in 2022: 43.7 years old
(Males: 41.1 years old, Females: 44.4 years old)
(Median age for: White residents: 43.7 years old, Black residents: 37.3 years old)
Fair market rent in 2006 for a 1-bedroom apartment in Glascock County is $348 a month.
Fair market rent for a 2-bedroom apartment is $458 a month.
Fair market rent for a 3-bedroom apartment is $548 a month.
Notable locations in this county outside city limits:
Notable locations in Glascock County: Grange (A), Mount Moriah Campgrounds (B), Clarks Mill (C), Hillcrest Volunteer Fire Department (D). Display/hide their locations on the map
Churches in Glascock County include: Allen Temple Church (A), Brunson Church (B), Colemans Chapel (C), Dixon Grove Church (D), Ebenezer Church (E), Eden Church (F), Farmer Grove Church (G), Friendship Church (H), Gallilee Church (I). Display/hide their locations on the map
Cemeteries: Arrington Cemetery (1), Avret Cemetery (2), Little Cemetery (3), Beasley Cemetery (4), Berryhill Cemetery (5), Lofton Cemetery (6), Avera Cemetery (7). Display/hide their locations on the map
Lakes, reservoirs, and swamps: Jones Pond (A), Greener Mill Pond (B), Adams Fish Pond (C), Clarks Mill Pond (D), Gamble Mill Pond (E), Hadden Pond (F), James Pond (G), Kellys Pond (H). Display/hide their locations on the map
Streams, rivers, and creeks: Williamson Swamp Creek (A), Whites Creek (B), Big Creek (C), Juniper Branch (D), Jordan Branch (E), Johnson Branch (F), Stinson Branch (G), Jim Brown Branch (H), Stephens Branch (I). Display/hide their locations on the map
Neighboring counties: Bibb County, Alabama  , Carroll County, Mississippi , Humphreys County, Mississippi , Cass County, Texas , Miller County, Arkansas , Shelby County, Alabama , Kaufman County, Texas , Van Zandt County, Texas .
| Here: | 2.9% |
| Georgia: | 2.9% |


Current college students: 71
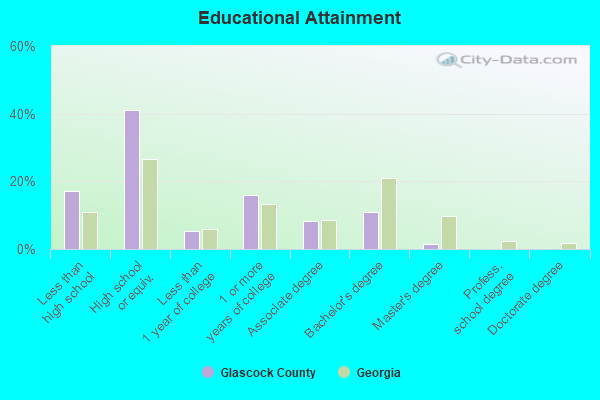
People 25 years of age or older with a high school degree or higher: 82.2%
People 25 years of age or older with a bachelor's degree or higher: 12.9%
Number of foreign born residents: 4 (105.0% naturalized citizens)
| Glascock County: | 0.1% |
| Whole state: | 10.7% |
Mean travel time to work (commute): $ minutes
Percentage of county residents living and working in this county: 99.3%
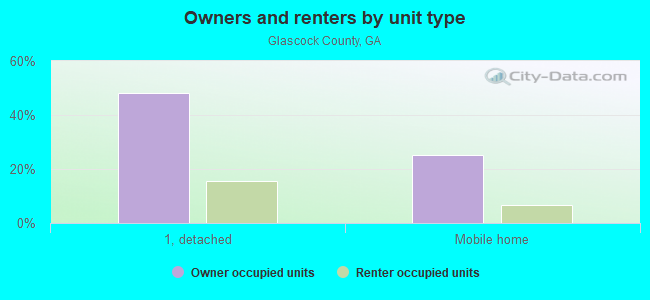
Housing units in structures:
- One, detached: 922
- Two: 52
- 10 to 19: 9
- Mobile homes: 455
Housing units in Glascock County with a mortgage: 324 (0 second mortgage, 0 home equity loan, 0 both second mortgage and home equity loan)
Houses without a mortgage: 0
| Here: | 100.0% with mortgage |
| State: | 98.2% with mortgage |
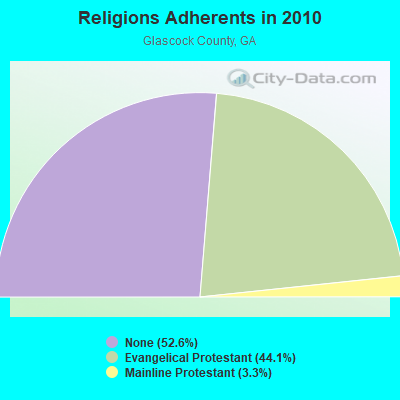
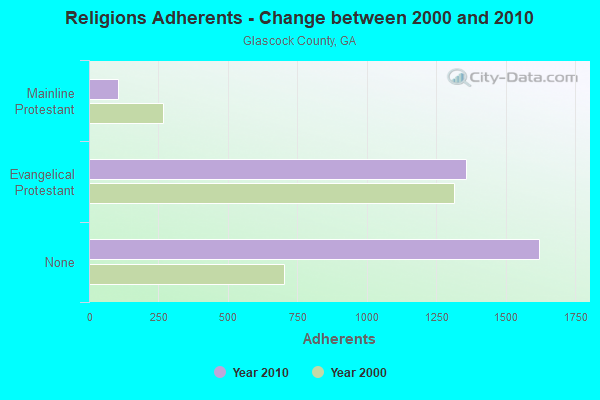
Religion statistics for Glascock County
| Religion | Adherents | Congregations |
|---|---|---|
| Evangelical Protestant | 1,358 | 10 |
| Mainline Protestant | 103 | 2 |
| Catholic | - | - |
| None | 1,621 | - |
Source: Clifford Grammich, Kirk Hadaway, Richard Houseal, Dale E.Jones, Alexei Krindatch, Richie Stanley and Richard H.Taylor. 2012. 2010 U.S.Religion Census: Religious Congregations & Membership Study. Association of Statisticians of American Religious Bodies. Jones, Dale E., et al. 2002. Congregations and Membership in the United States 2000. Nashville, TN: Glenmary Research Center.
Food Environment Statistics:
| Glascock County: | 3.62 / 10,000 pop. |
| State: | 1.91 / 10,000 pop. |
| Glascock County: | 7.24 / 10,000 pop. |
| Georgia: | 5.12 / 10,000 pop. |
| This county: | 7.24 / 10,000 pop. |
| State: | 7.41 / 10,000 pop. |
| Glascock County: | 11.4% |
| Georgia: | 10.4% |
| Glascock County: | 26.6% |
| State: | 27.8% |
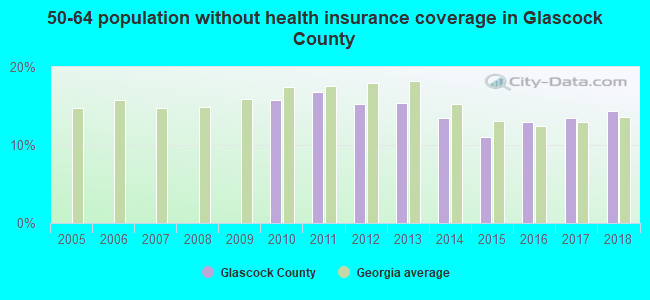
| Here: | 15.6% |
| State: | 14.6% |
Agriculture in Glascock County:
Average size of farms: 210 acresAverage value of agricultural products sold per farm: $18,706
Average value of crops sold per acre for harvested cropland: $79.40
The value of nursery, greenhouse, floriculture, and sod as a percentage of the total market value of agricultural products sold: 0.00%
The value of livestock, poultry, and their products as a percentage of the total market value of agricultural products sold: 83.63%
Average total farm production expenses per farm: $23,729
Harvested cropland as a percentage of land in farms: 18.33%
Average market value of all machinery and equipment per farm: $24,763
The percentage of farms operated by a family or individual: 97.00%
Average age of principal farm operators: 56 years
Average number of cattle and calves per 100 acres of all land in farms: 16.31
All wheat for grain: 839 harvested acres
Upland cotton: 1021 harvested acres
Land in orchards: 93 acres
Tornado activity:
Glascock County historical area-adjusted tornado activity is significantly below Georgia state average. It is 1300545.2 times below overall U.S. average.Tornadoes in this county have caused 31 injuries recorded between 1950 and 2004.
On 1/13/1972, a category 3 (max. wind speeds 158-206 mph) tornado injured 21 people and caused between $500,000 and $5,000,000 in damages.
Earthquake activity:
Glascock County-area historical earthquake activity is significantly above Georgia state average. It is 5% smaller than the overall U.S. average.On 8/2/1974 at 08:52:09, a magnitude 4.9 (4.3 MB, 4.9 LG, Class: Light, Intensity: IV - V) earthquake occurred 44.8 miles away from Glascock County center
On 11/22/1974 at 05:25:55, a magnitude 4.7 (4.7 MB) earthquake occurred 144.1 miles away from the county center
On 4/29/2003 at 08:59:39, a magnitude 4.9 (4.4 MB, 4.6 MW, 4.9 LG) earthquake occurred 194.7 miles away from the county center
On 8/9/2020 at 12:07:37, a magnitude 5.1 (5.1 MW, Depth: 4.7 mi, Class: Moderate, Intensity: VI - VII) earthquake occurred 240.2 miles away from the county center
On 2/15/2014 at 03:23:38, a magnitude 4.1 (4.1 MW, Depth: 3.2 mi) earthquake occurred 50.0 miles away from Glascock County center
On 11/30/1973 at 07:48:41, a magnitude 4.7 (4.7 MB, 4.6 ML) earthquake occurred 193.9 miles away from the county center
Magnitude types: regional Lg-wave magnitude (LG), body-wave magnitude (MB), local magnitude (ML), moment magnitude (MW)
Most recent natural disasters:
- Georgia Covid-19 Pandemic, Incident Period: January 20, 2020, FEMA Id: 4501, Natural disaster type: Other
- Georgia Hurricane Michael, Incident Period: October 9, 2018 - October 23, 2018, Major Disaster (Presidential) Declared DR-4400-GA: October 14, 2018, FEMA Id: 4400, Natural disaster type: Hurricane
- Georgia Severe Winter Storm, Incident Period: February 10, 2014 to February 14, 2014, Emergency Declared EM-3368: February 11, 2014, FEMA Id: 3368, Natural disaster type: Winter Storm
- Georgia Severe Winter Storm, Incident Period: February 10, 2014 to February 15, 2014, Major Disaster (Presidential) Declared DR-4165: March 06, 2014, FEMA Id: 4165, Natural disaster type: Winter Storm
- Georgia Hurricane Katrina Evacuation, Incident Period: August 27, 2005 to October 01, 2005, Emergency Declared EM-3218: September 05, 2005, FEMA Id: 3218, Natural disaster type: Hurricane
- Georgia Drought, Incident Period: July 20, 1977, Emergency Declared EM-3044: July 20, 1977, FEMA Id: 3044, Natural disaster type: Drought
The number of natural disasters in Glascock County (6) is a lot smaller than the US average (15).
Major Disasters (Presidential) Declared: 2
Emergencies Declared: 3
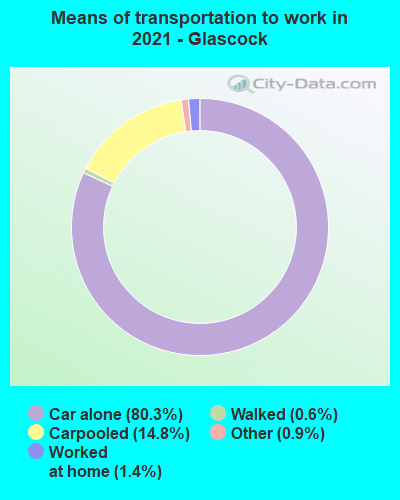
Means of transportation to work:
- Drove a car alone: 368 (78.5%)
- Carpooled: 68 (14.5%)
- Taxicab, motorcycle, or other means: 4 (0.9%)
- Walked: 2 (0.4%)
- Worked at home: 8 (1.7%)
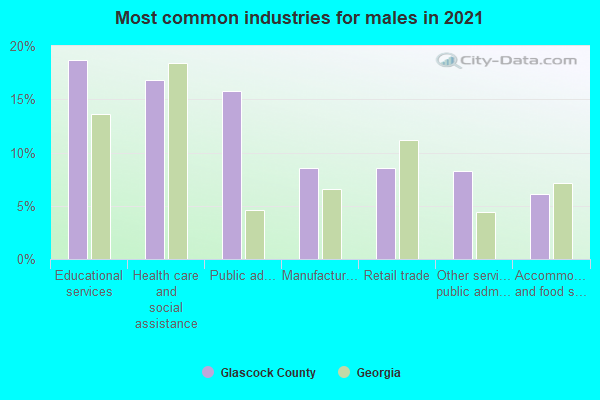
- Health care and social assistance (22%)
- Educational services (15%)
- Public administration (10%)
- Retail trade (9%)
- Accommodation and food services (8%)
- Manufacturing (7%)
- Other services, except public administration (5%)

- Health care and social assistance (23%)
- Educational services (17%)
- Public administration (11%)
- Retail trade (10%)
- Accommodation and food services (9%)
- Manufacturing (8%)
- Other services, except public administration (6%)
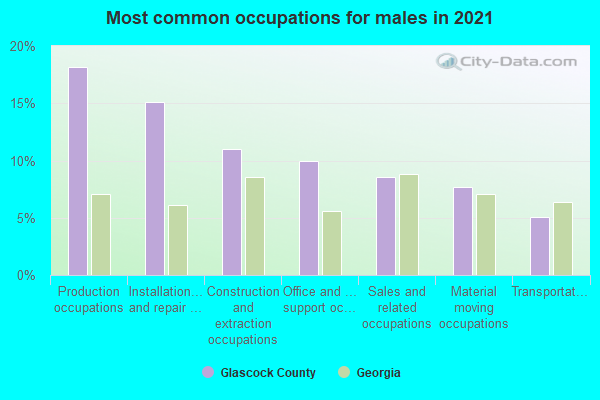
- Production occupations (21%)
- Installation, maintenance, and repair occupations (17%)
- Sales and related occupations (11%)
- Office and administrative support occupations (9%)
- Material moving occupations (8%)
- Architecture and engineering occupations (7%)
- Construction and extraction occupations (7%)
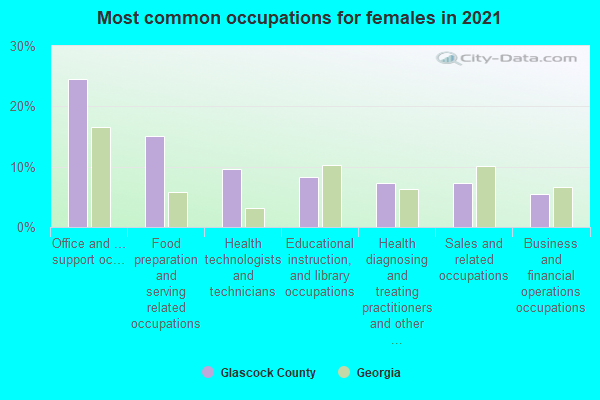
- Office and administrative support occupations (20%)
- Food preparation and serving related occupations (18%)
- Health technologists and technicians (12%)
- Sales and related occupations (10%)
- Educational instruction, and library occupations (7%)
- Business and financial operations occupations (6%)
- Health diagnosing and treating practitioners and other technical occupations (5%)
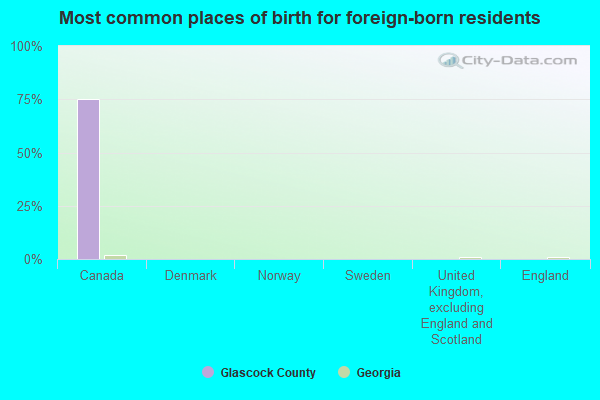
- Panama (50%)
- Ireland (0%)
- Norway (0%)
- Sweden (0%)
- United Kingdom, excluding England and Scotland (0%)
- England (0%)
- Scotland (0%)
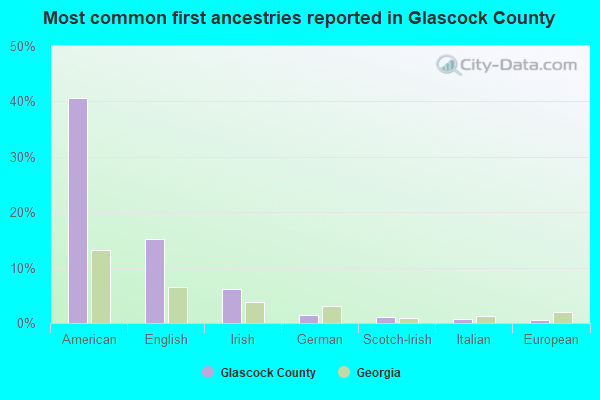
- American (41%)
- English (17%)
- Irish (8%)
- European (2%)
- German (1%)
- French (except Basque) (1%)
- Italian (1%)
104 people in other group homes
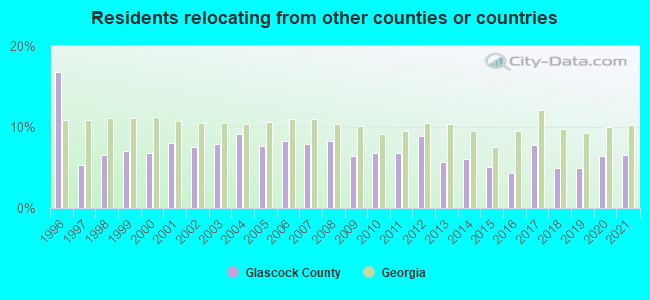
6.50% of this county's 2021 resident taxpayers lived in other counties in 2020 ($39,276 average adjusted gross income)
| Here: | 6.50% |
| Georgia average: | 10.21% |
10 or fewer of this county's residents moved from foreign countries.
6.50% relocated from other counties in Georgia ($39,276 average AGI)
10 or fewer of this county's residents relocated from other states.
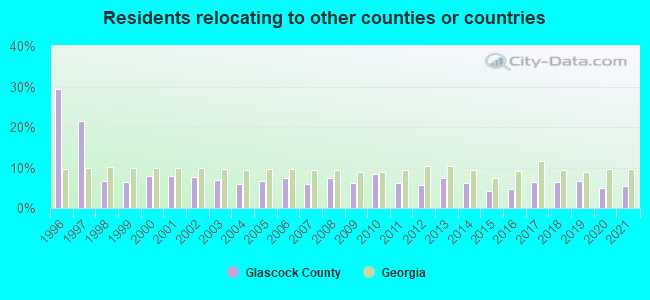
5.44% of this county's 2020 resident taxpayers moved to other counties in 2021 ($35,542 average adjusted gross income)
| Here: | 5.44% |
| Georgia average: | 9.60% |
10 or fewer of this county's residents moved to foreign countries.
5.44% relocated to other counties in Georgia ($35,542 average AGI)
10 or fewer of this county's residents relocated to other states.
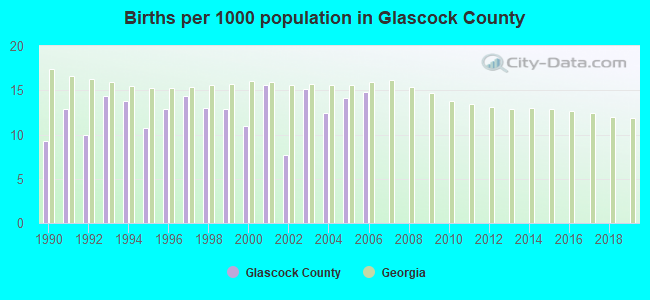
Births per 1000 population from 1990 to 1999: 12.4
Births per 1000 population from 2000 to 2006: 13.0
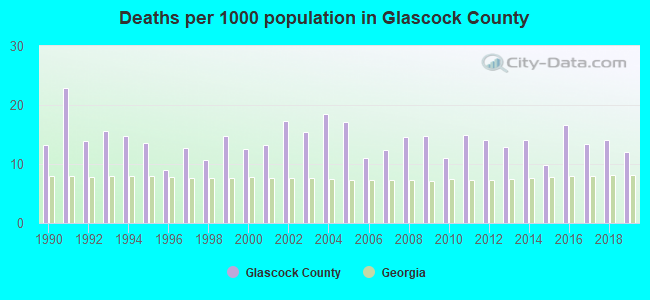
Deaths per 1000 population from 1990 to 1999: 14.1
Deaths per 1000 population from 2000 to 2009: 14.7
Deaths per 1000 population from 2010 to 2020: 13.4
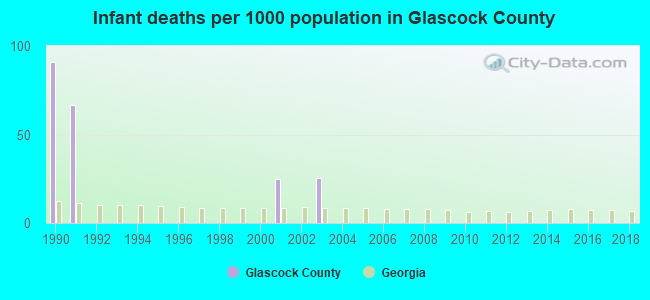
Infant deaths per 1000 live births from 1990 to 1999: 15.8
Infant deaths per 1000 live births from 2000 to 2006: 7.2
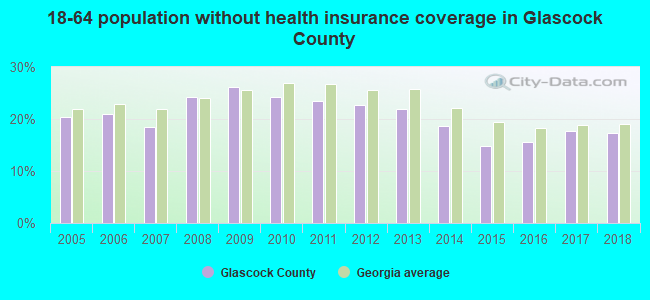
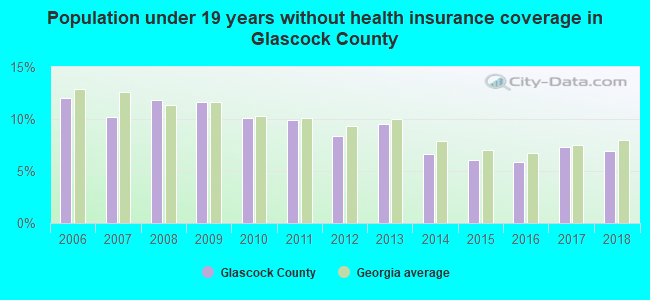
Persons under 19 years old without health insurance coverage in 2018: 6.9%

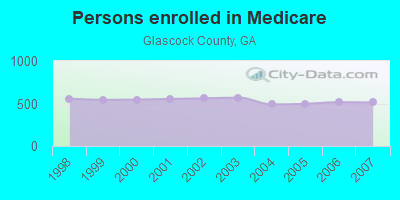
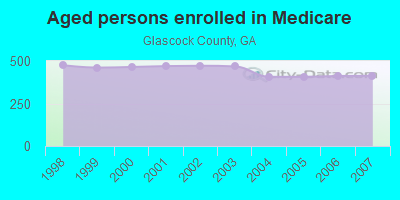
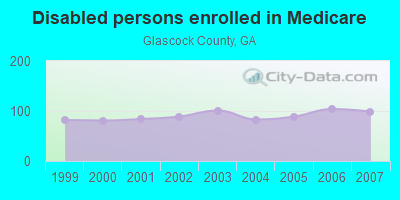
Persons enrolled in hospital insurance and/or supplemental medical insurance (Medicare) in July 1, 2007: 512 (413 aged, 99 disabled)
Children under 18 without health insurance coverage in 2007: 69 (10%)
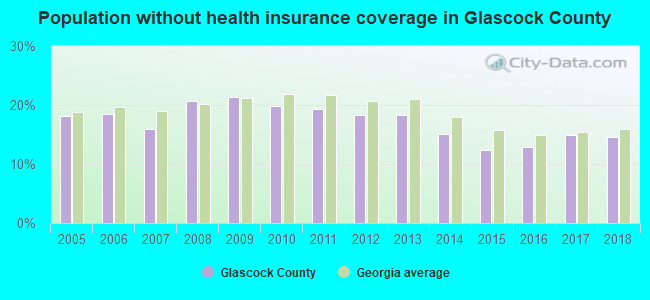
Population without health insurance coverage in 2000: 13%
Children under 18 without health insurance coverage in 2000: 9%
Medical specialist MDs per 100,000 population in 2005: 2,144
Household type by relationship:
Households: 2,954- Male householders: 474 (164 living alone), Female householders: 617 (163 living alone)
578 spouses (578 opposite-sex spouses), 17 unmarried partners, (17 opposite-sex unmarried partners), 922 children (858 natural, 0 adopted, 62 stepchildren), 103 grandchildren, 8 brothers or sisters, 60 parents, 0 foster children, 58 other relatives, 30 non-relatives
- In group quarters: 82
Size of family households: 419 2-persons, 117 3-persons, 79 4-persons, 60 5-persons, 37 6-persons, 36 7-or-more-persons.
Size of nonfamily households: 328 1-person, 11 2-persons.
336 married couples with children.
170 single-parent households (2 men, 168 women).
99.4% of residents of Glascock speak English at home.
0.2% of residents speak other Indo-European language at home (100% speak English very well).
In fiscal year 2004:
Federal Government expenditure: $19,879,000 ($7,556 per capita)
Department of Defense expenditure: $215,000
Federal direct payments to individuals for retirement and disability: $8,156,000
Federal other direct payments to individuals: $4,725,000
Federal direct payments not to individuals: $219,000
Federal grants: $5,986,000
Federal procurement contracts: $166,000 ($0,000 Department of Defense)
Federal salaries and wages: $628,000 ($0,000 Department of Defense)
Federal Government direct loans: $350,000
Federal guaranteed/insured loans: $471,000
Federal Government insurance: $256,000
Population change from April 1, 2000 to July 1, 2005:
Births: 176| Here: | 65 per 1000 residents |
| State: | 79 per 1000 residents |
Deaths: 194
| Here: | 72 per 1000 residents |
| State: | 38 per 1000 residents |
Net international migration: -4
| Here: | |
| State: |
Net internal migration: +177
| Here: | +65 per 1000 residents |
| State: | +26 per 1000 residents |
Total withdrawal of fresh water for public supply: 0.12 millions of gallons per day (all from ground)
| Here: | 6.7 |
| State: | 6.8 |
| Here: | 5.2 |
| State: | 4.6 |
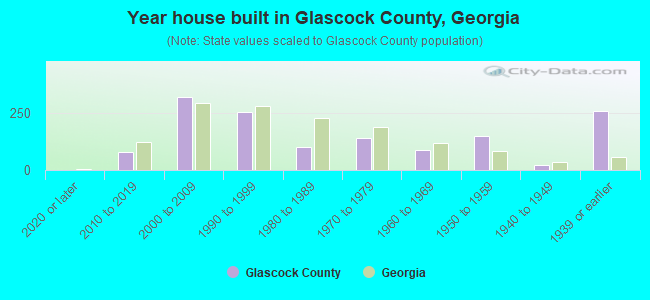
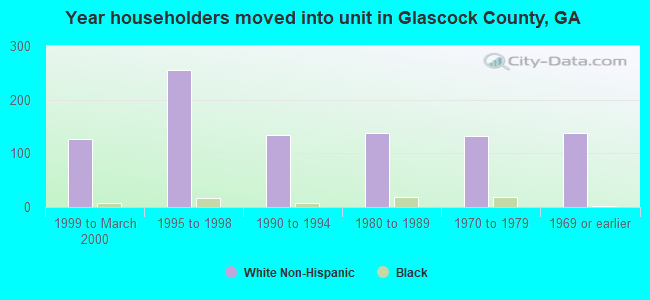
- Year house built in Glascock County, Georgia
- 02020 or later
- 672010 to 2019
- 3502000 to 2009
- 2591990 to 1999
- 1091980 to 1989
- 1201970 to 1979
- 771960 to 1969
- 1591950 to 1959
- 281940 to 1949
- 2191939 or earlier
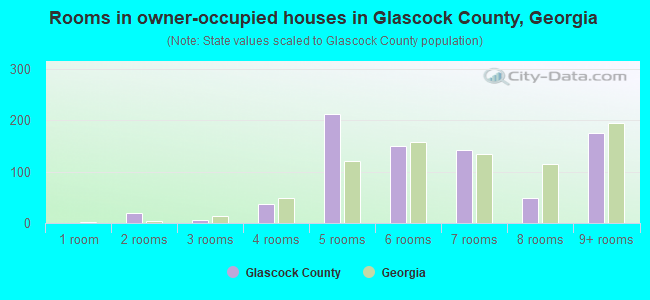
- Rooms in owner-occupied houses in Glascock County, Georgia
- 01 room
- 302 rooms
- 53 rooms
- 414 rooms
- 1575 rooms
- 1426 rooms
- 1217 rooms
- 488 rooms
- 2459+ rooms
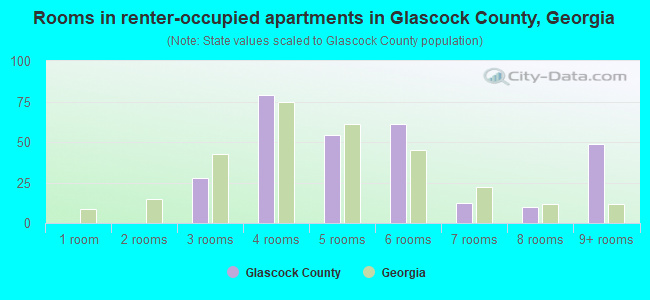
- Rooms in renter-occupied apartments in Glascock County, Georgia
- 01 room
- 02 rooms
- 383 rooms
- 754 rooms
- 555 rooms
- 636 rooms
- 157 rooms
- 228 rooms
- 419+ rooms
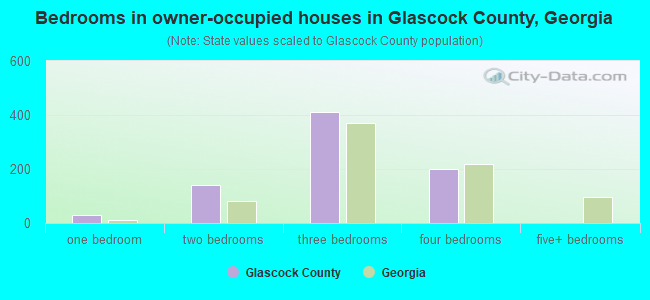
- Bedrooms in owner-occupied houses in Glascock County, Georgia
- 0no bedroom
- 371 bedroom
- 1142 bedrooms
- 3963 bedrooms
- 2124 bedrooms
- 225+ bedrooms
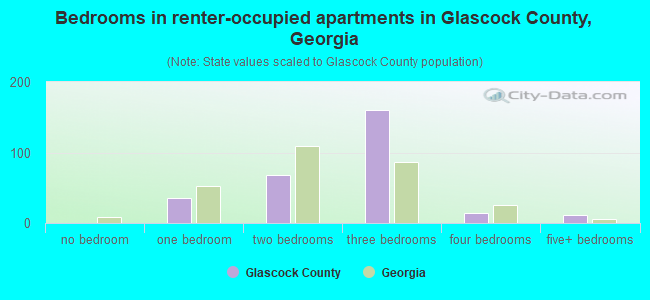
- Bedrooms in renter-occupied apartments in Glascock County, Georgia
- 0no bedroom
- 451 bedroom
- 762 bedrooms
- 1703 bedrooms
- 94 bedrooms
- 115+ bedrooms
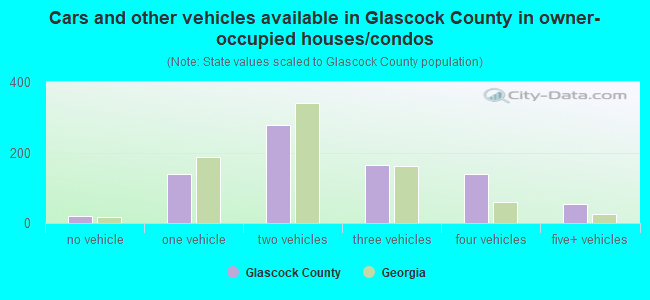
- Cars and other vehicles available in Glascock County in owner-occupied houses/condos
- 17no vehicle
- 1101 vehicle
- 2652 vehicles
- 1693 vehicles
- 1674 vehicles
- 535+ vehicles
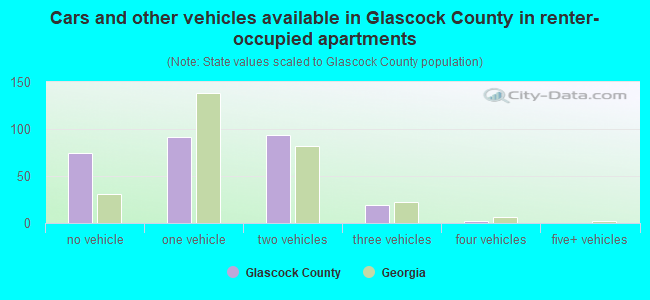
- Cars and other vehicles available in Glascock County in renter-occupied apartments
- 90no vehicle
- 1091 vehicle
- 912 vehicles
- 83 vehicles
- 94 vehicles
- 05+ vehicles
88.5% of Glascock County residents lived in the same house 1 years ago.
Out of people who lived in different houses, 7% lived in this county.
Out of people who lived in different counties, 99% lived in Georgia.
| Glascock County: | 88.5% |
| State average: | 86.6% |
Place of birth for U.S.-born residents:
- This state: 2,536
- Other state: 327
- Northeast: 46
- Midwest: 88
- South: 152
- West: 40
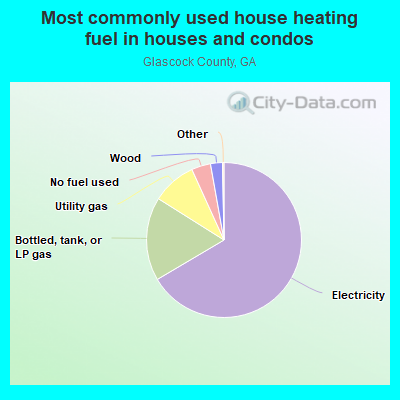
- 64.2%Electricity
- 23.3%Bottled, tank, or LP gas
- 7.8%Utility gas
- 2.8%No fuel used
- 1.9%Wood
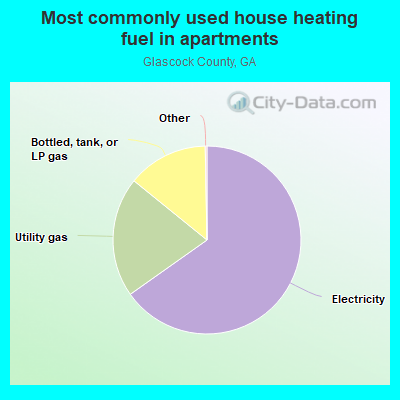
- 63.1%Electricity
- 19.6%Utility gas
- 17.3%Bottled, tank, or LP gas
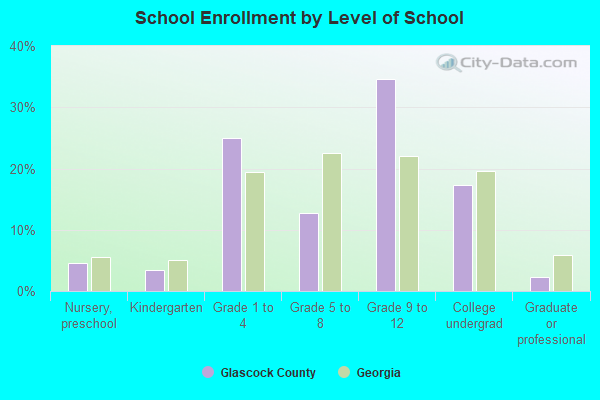
Private vs. public school enrollment:
| Here: | 12.0% |
| Georgia: | 12.1% |
| Here: | 2.9% |
| Georgia: | 10.8% |
| Here: | 0.0% |
| Georgia: | 17.1% |
Glascock County government finances - Expenditure in 2017:
- Charges - Other: $175,000
Parks and Recreation: $22,000
- Construction - Regular Highways: $974,000
Police Protection: $335,000
General Public Buildings: $39,000
Parks and Recreation: $2,000
- Current Operations - Police Protection: $376,000
Regular Highways: $285,000
Judicial and Legal Services: $257,000
General - Other: $251,000
General Public Buildings: $211,000
Financial Administration: $196,000
Health - Other: $147,000
Solid Waste Management: $115,000
Parks and Recreation: $73,000
Local Fire Protection: $58,000
Natural Resources - Other: $32,000
Libraries: $23,000
- Intergovernmental to Local - Other - General - Other: $68,000
- Local Intergovernmental - Other: $7,000
- Miscellaneous - General Revenue - Other: $65,000
Fines and Forfeits: $64,000
Rents: $29,000
Interest Earnings: $2,000
- Other Capital Outlay - Police Protection: $8,000
- Other Funds - Cash and Securities: $1,963,000
- State Intergovernmental - Other: $476,000
General Local Government Support: $3,000
- Tax - Property: $1,004,000
General Sales and Gross Receipts: $566,000
Insurance Premiums Sales: $123,000
Other: $2,000
Other License: $1,000
Glascock County government finances - Revenue in 2017:
- Charges - Other: $175,000
Parks and Recreation: $22,000
- Construction - Regular Highways: $974,000
Police Protection: $335,000
General Public Buildings: $39,000
Parks and Recreation: $2,000
- Current Operations - Police Protection: $376,000
Regular Highways: $285,000
Judicial and Legal Services: $257,000
General - Other: $251,000
General Public Buildings: $211,000
Financial Administration: $196,000
Health - Other: $147,000
Solid Waste Management: $115,000
Parks and Recreation: $73,000
Local Fire Protection: $58,000
Natural Resources - Other: $32,000
Libraries: $23,000
- Intergovernmental to Local - Other - General - Other: $68,000
- Local Intergovernmental - Other: $7,000
- Miscellaneous - General Revenue - Other: $65,000
Fines and Forfeits: $64,000
Rents: $29,000
Interest Earnings: $2,000
- Other Capital Outlay - Police Protection: $8,000
- Other Funds - Cash and Securities: $1,963,000
- State Intergovernmental - Other: $476,000
General Local Government Support: $3,000
- Tax - Property: $1,004,000
General Sales and Gross Receipts: $566,000
Insurance Premiums Sales: $123,000
Other: $2,000
Other License: $1,000
Glascock County government finances - Debt in 2017:
- Charges - Other: $175,000
Parks and Recreation: $22,000
- Construction - Regular Highways: $974,000
Police Protection: $335,000
General Public Buildings: $39,000
Parks and Recreation: $2,000
- Current Operations - Police Protection: $376,000
Regular Highways: $285,000
Judicial and Legal Services: $257,000
General - Other: $251,000
General Public Buildings: $211,000
Financial Administration: $196,000
Health - Other: $147,000
Solid Waste Management: $115,000
Parks and Recreation: $73,000
Local Fire Protection: $58,000
Natural Resources - Other: $32,000
Libraries: $23,000
- Intergovernmental to Local - Other - General - Other: $68,000
- Local Intergovernmental - Other: $7,000
- Miscellaneous - General Revenue - Other: $65,000
Fines and Forfeits: $64,000
Rents: $29,000
Interest Earnings: $2,000
- Other Capital Outlay - Police Protection: $8,000
- Other Funds - Cash and Securities: $1,963,000
- State Intergovernmental - Other: $476,000
General Local Government Support: $3,000
- Tax - Property: $1,004,000
General Sales and Gross Receipts: $566,000
Insurance Premiums Sales: $123,000
Other: $2,000
Other License: $1,000
Glascock County government finances - Cash and Securities in 2017:
- Charges - Other: $175,000
Parks and Recreation: $22,000
- Construction - Regular Highways: $974,000
Police Protection: $335,000
General Public Buildings: $39,000
Parks and Recreation: $2,000
- Current Operations - Police Protection: $376,000
Regular Highways: $285,000
Judicial and Legal Services: $257,000
General - Other: $251,000
General Public Buildings: $211,000
Financial Administration: $196,000
Health - Other: $147,000
Solid Waste Management: $115,000
Parks and Recreation: $73,000
Local Fire Protection: $58,000
Natural Resources - Other: $32,000
Libraries: $23,000
- Intergovernmental to Local - Other - General - Other: $68,000
- Local Intergovernmental - Other: $7,000
- Miscellaneous - General Revenue - Other: $65,000
Fines and Forfeits: $64,000
Rents: $29,000
Interest Earnings: $2,000
- Other Capital Outlay - Police Protection: $8,000
- Other Funds - Cash and Securities: $1,963,000
- State Intergovernmental - Other: $476,000
General Local Government Support: $3,000
- Tax - Property: $1,004,000
General Sales and Gross Receipts: $566,000
Insurance Premiums Sales: $123,000
Other: $2,000
Other License: $1,000
Supplemental Security Income (SSI) in 2006:
- Total number of recipients: 76
- Number of aged recipients: 10
- Number of blind and disabled recipients: 66
- Number of recipients under 18: 0
- Number of recipients between 18 and 64: 37
- Number of recipients older than 64: 0
- Number of recipients also receiving OASDI: 33
- Amount of payments (thousands of dollars): 24
| Most common first names in Glascock County, GA among deceased individuals | ||
| Name | Count | Lived (average) |
|---|---|---|
| Mary | 25 | 79.2 years |
| James | 20 | 68.5 years |
| William | 17 | 72.4 years |
| Willie | 16 | 78.2 years |
| John | 15 | 71.7 years |
| Annie | 11 | 82.4 years |
| Robert | 10 | 67.6 years |
| Joseph | 10 | 75.5 years |
| Frances | 10 | 82.0 years |
| George | 9 | 76.9 years |
| Most common last names in Glascock County, GA among deceased individuals | ||
| Last name | Count | Lived (average) |
|---|---|---|
| Usry | 40 | 79.1 years |
| Chalker | 39 | 75.1 years |
| Kitchens | 30 | 75.3 years |
| Walden | 19 | 77.4 years |
| Hadden | 14 | 75.3 years |
| Dixon | 13 | 77.4 years |
| Newsome | 13 | 76.3 years |
| Johnson | 12 | 77.0 years |
| Reese | 12 | 70.7 years |
| Todd | 11 | 71.1 years |
Glascock County on our top lists:
- #77 on the list of "Top 101 counties with highest percentage of residents voting for Romney (Republican) in the 2012 Presidential Election"
- #99 on the list of "Top 101 counties with the lowest total withdrawal of fresh water for public supply"