Fulton County, Arkansas (AR)
County owner-occupied free and clear houses and condos in 2010: 2,043
County owner-occupied houses and condos in 2000: 3,902
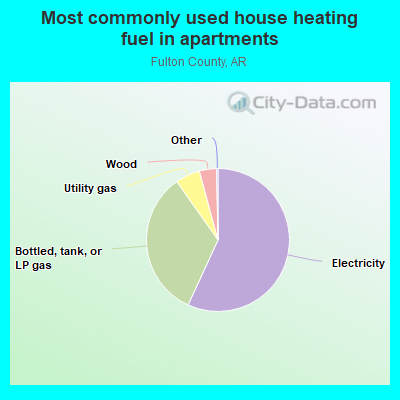
Renter-occupied apartments: 1,023 (it was 908 in 2000)
| % of renters here: | 19% |
| State: | 33% |
Land area: 618 sq. mi.
Water area: 2.2 sq. mi.
Population density: 20 people per square mile (low).
Industries providing employment: Educational, health and social services (31.5%), Retail trade (15.2%).
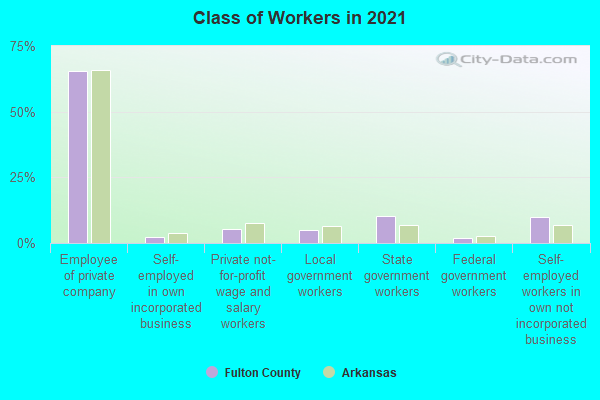
Type of workers:
- Private wage or salary: 74%
- Government: 17%
- Self-employed, not incorporated: 9%
- Unpaid family work: 0%
- OSM Map
- General Map
- Google Map
- MSN Map

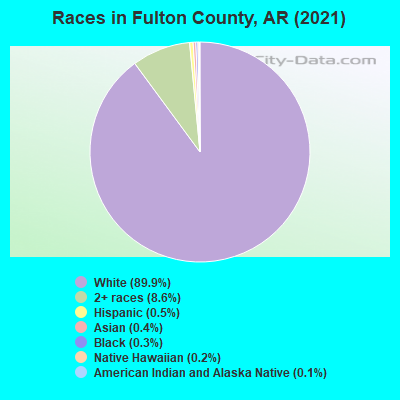
- 11,05489.7%White Non-Hispanic Alone
- 1,1729.5%Two or more races
- 730.6%Hispanic or Latino
- 220.2%Black Non-Hispanic Alone
- 40.03%Asian alone
| Median resident age: | 48.0 years |
| Arkansas median age: | 38.9 years |
| Males: 6,143 | |
| Females: 6,148 |

 | 3rd trip into Arkansas in search of retirement haven (23 replies) |
| Thinking of retiring in Salem, northern Ark. (18 replies) |
| Tell Me About Cherokee Village -- The Good, The Bad, and The Ugly (116 replies) |
| Some truth for moving to parts of Arkansas (182 replies) |
| Relocate to Arkansas (53 replies) |
| Arkansas Fishing stories and stuff (20 replies) |
| Fulton County: | 2.0 people |
| Arkansas: | 2 people |
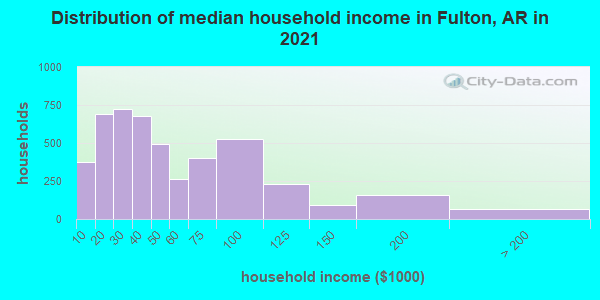
Estimated median household income in 2022: $38,293 ($25,529 in 1999)
| This county: | $38,293 |
| Arkansas: | $55,432 |
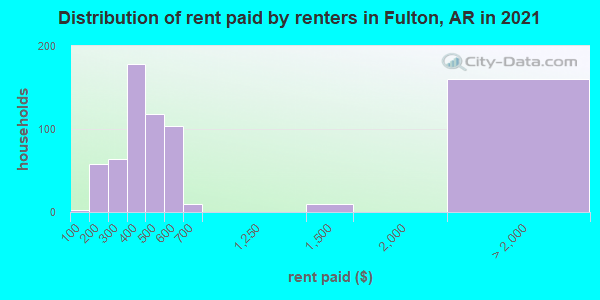
Median contract rent in 2022 for apartments: $421 (lower quartile is $283, upper quartile is $487)
| This county: | $421 |
| State: | $654 |
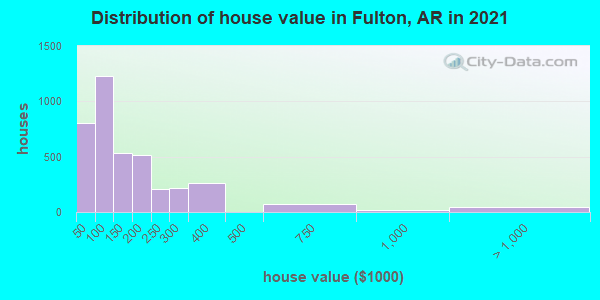
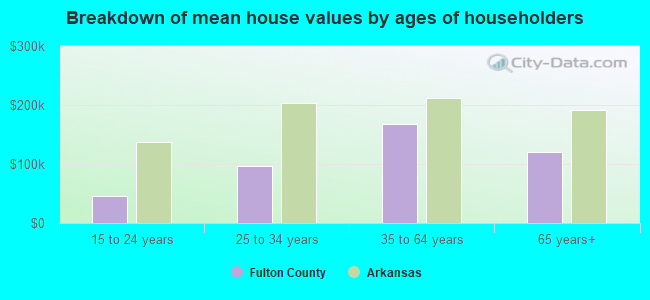
Estimated median house or condo value in 2022: $110,714 (it was $59,200 in 2000)
| Fulton: | $110,714 |
| Arkansas: | $179,800 |
Mean price in 2022:
Median monthly housing costs for homes and condos with a mortgage: $992Detached houses: $181,702
Here: $181,702 State: $243,881 Townhouses or other attached units: $108,113
Here: $108,113 State: $244,376 Mobile homes: $79,246
Here: $79,246 State: $79,566 Occupied boats, RVs, vans, etc.: $22,524
Here: $22,524 State: $127,304
Median monthly housing costs for units without a mortgage: $342
Institutionalized population: 155
Crime in 2021 (reported by the sheriff's office or county police, not the county total):
- Murders: 1
- Rapes: 7
- Robberies: 0
- Assaults: 31
- Burglaries: 0
- Thefts: 54
- Auto thefts: 10
Crime in 2020 (reported by the sheriff's office or county police, not the county total):
- Murders: 1
- Rapes: 5
- Robberies: 0
- Assaults: 19
- Burglaries: 0
- Thefts: 52
- Auto thefts: 7
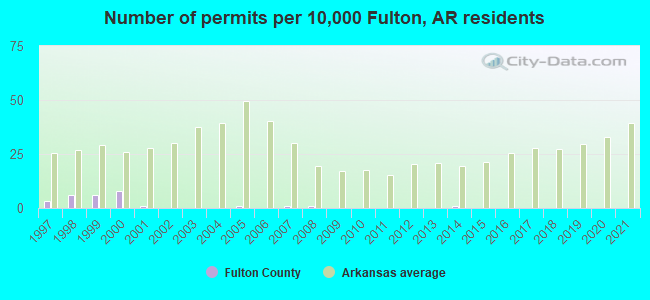
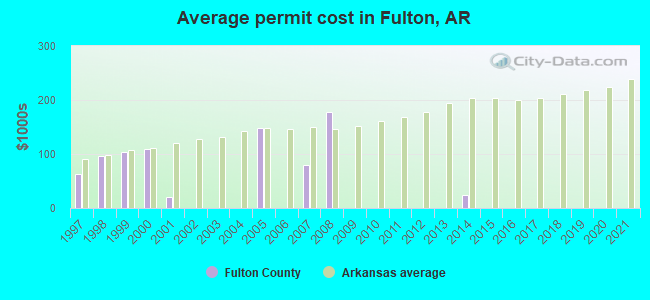
Single-family new house construction building permits:
- 2022: 0 buildings
- 2021: 0 buildings
- 2020: 0 buildings
- 2019: 0 buildings
- 2018: 0 buildings
- 2017: 0 buildings
- 2016: 0 buildings
- 2015: 0 buildings
- 2014: 1 building, cost: $25,000
- 2013: 0 buildings
- 2012: 0 buildings
- 2011: 0 buildings
- 2010: 0 buildings
- 2009: 0 buildings
- 2008: 1 building, cost: $177,500
- 2007: 1 building, cost: $80,000
- 2006: 0 buildings
- 2005: 1 building, cost: $148,500
- 2004: 0 buildings
- 2003: 0 buildings
- 2002: 0 buildings
- 2001: 1 building, cost: $20,000
- 2000: 9 buildings, average cost: $109,000
- 1999: 7 buildings, average cost: $103,100
- 1998: 7 buildings, average cost: $95,700
- 1997: 4 buildings, average cost: $62,500
Median real estate property taxes paid for housing units with mortgages in 2022: $606 (0.4%)
Median real estate property taxes paid for housing units with no mortgage in 2022: $447 (0.4%)
| Fulton County: | 15.8% |
| Arkansas: | 16.8% |
Median age of residents in 2022: 48.0 years old
(Males: 46.6 years old, Females: 50.4 years old)
(Median age for: White residents: 48.6 years old, Black residents: 35.2 years old, Hispanic or Latino residents: 64.9 years old)
Fair market rent in 2006 for a 1-bedroom apartment in Fulton County is $364 a month.
Fair market rent for a 2-bedroom apartment is $456 a month.
Fair market rent for a 3-bedroom apartment is $599 a month.
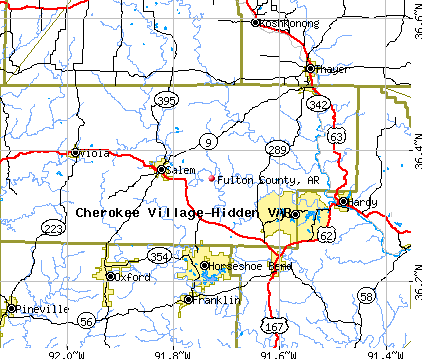
Cities in this county include: Salem, Mammoth Spring, Viola.
Notable locations in this county outside city limits:
Notable locations in Fulton County: Elk Ranch (A), South Carroll County Volunteer Fire Department Station 1 (B), South Carroll County Volunteer Fire Department Substation (C), Arkansas Game and Fish Commission Law Enforcement - Northwest Regional Office (D), Grassy Knob Volunteer Fire Department (E), Inspiration Point Volunteer Fire Department Main Station (F), Inspiration Point Volunteer Fire Department Substation (G). Display/hide their locations on the map
Churches in Fulton County include: Union Church (A), Ward Church (B), White Oak Church (C), Winona Springs Church (D), Zion Hill Church (E), Berkes Community Church (F), Beulah Church (G), Boyd Church (H), Busch Church (I). Display/hide their locations on the map
Cemeteries: Sites Cemetery (1), Sisco Cemetery (2), Shady Grove Cemetery (3), Riddle Cemetery (4), Oak Hill Cemetery (5), Oak Hills Cemetery (6), Bobo Cemetery (7). Display/hide their locations on the map
Reservoirs: Jackson Lake (A), Fuller Lake (B), Farwell Spider Creek Lake (C), Eureka Springs City Lake (D), Lake Lucerene (E), Lake of No Return (F), Brewer Lake (G). Display/hide their locations on the map
Streams, rivers, and creeks: North Fork North Clifty Creek (A), Mills Branch (B), Mill Branch (C), Marshall Branch (D), Long Creek (E), Kenner Creek (F), Kenner Branch (G), Keels Creek (H), Honey Creek (I). Display/hide their locations on the map
Parks in Fulton County include: Beaver Dam Site Park (1), Cricket Creek Public Use Area (2), Starkey Public Use Area (3). Display/hide their locations on the map
Neighboring counties: DeKalb County, Tennessee  , Dickson County, Tennessee , Taos County, New Mexico
  , Randolph County , Woodward County, Oklahoma , Ochiltree County, Texas , Virginia Beach city, Virginia .
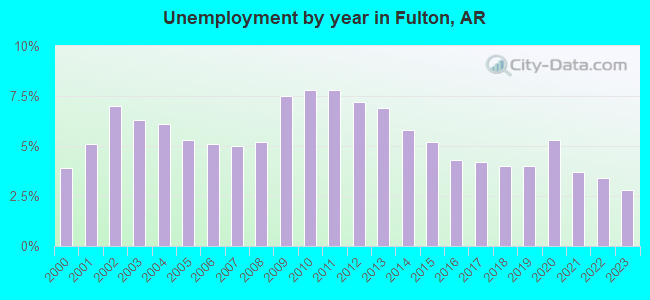
| Here: | 4.1% |
| Arkansas: | 3.4% |
Current college students: 276
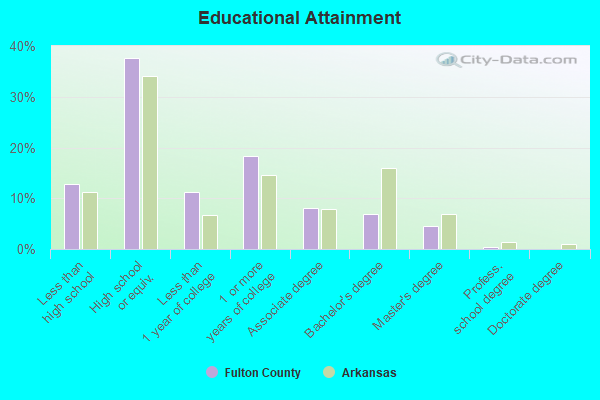
People 25 years of age or older with a high school degree or higher: 86.9%
People 25 years of age or older with a bachelor's degree or higher: 14.4%
Number of foreign born residents: 80 (75.9% naturalized citizens)
| Fulton County: | 0.7% |
| Whole state: | 5.1% |
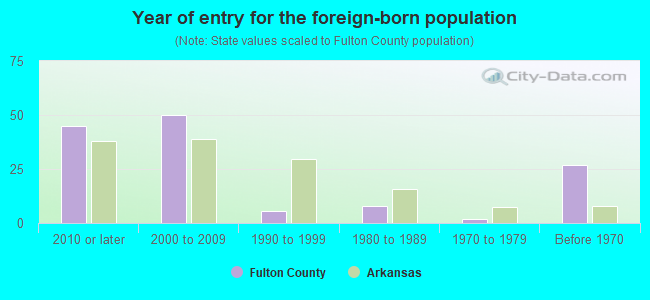
- Year of entry for the foreign-born population
- 02010 or later
- 02000 to 2009
- 91990 to 1999
- 81980 to 1989
- 21970 to 1979
- 27Before 1970
Mean travel time to work (commute): minutes
Percentage of county residents living and working in this county: 85.4%
Housing units in structures:
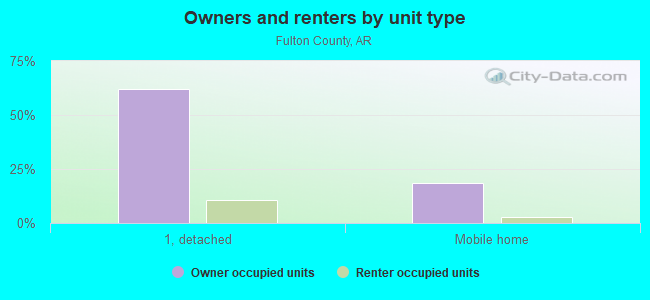
- One, detached: 4,460
- One, attached: 51
- Two: 81
- 3 or 4: 31
- 5 to 9: 10
- 10 to 19: 2
- 20 to 49: 30
- 50 or more: 12
- Mobile homes: 1,603
- Boats, RVs, vans, etc.: 58
Housing units in Fulton County with a mortgage: 1,728 (9 second mortgage, 0 home equity loan, 0 both second mortgage and home equity loan)
Houses without a mortgage: 14
| Here: | 6.7% with mortgage |
| State: | 98.4% with mortgage |
Religion statistics for Fulton County
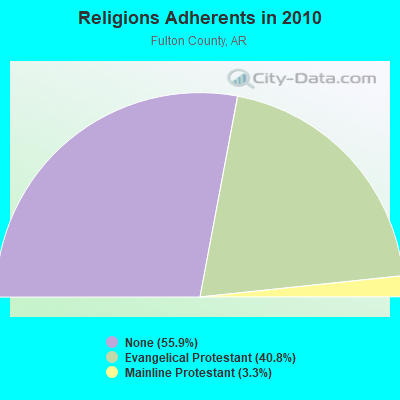
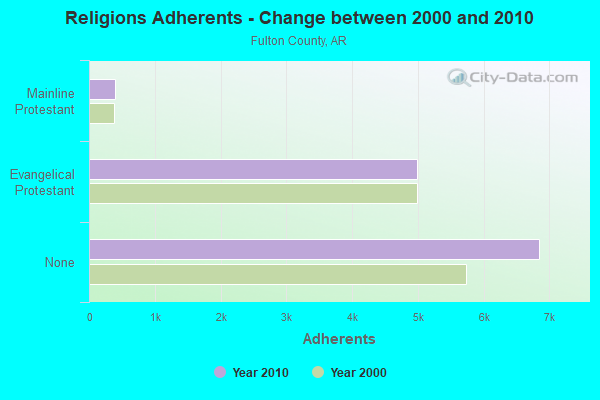
| Religion | Adherents | Congregations |
|---|---|---|
| Evangelical Protestant | 4,993 | 41 |
| Mainline Protestant | 402 | 6 |
| Other | 2 | 2 |
| None | 6,848 | - |
Source: Clifford Grammich, Kirk Hadaway, Richard Houseal, Dale E.Jones, Alexei Krindatch, Richie Stanley and Richard H.Taylor. 2012. 2010 U.S.Religion Census: Religious Congregations & Membership Study. Association of Statisticians of American Religious Bodies. Jones, Dale E., et al. 2002. Congregations and Membership in the United States 2000. Nashville, TN: Glenmary Research Center.
Food Environment Statistics:
| Fulton County: | 0.85 / 10,000 pop. |
| State: | 2.02 / 10,000 pop. |
| Fulton County: | 5.11 / 10,000 pop. |
| Arkansas: | 4.94 / 10,000 pop. |
| This county: | 5.11 / 10,000 pop. |
| State: | 6.66 / 10,000 pop. |
| Fulton County: | 10.5% |
| Arkansas: | 9.8% |
| Fulton County: | 28.5% |
| State: | 29.1% |
| Here: | 8.8% |
| State: | 13.6% |
Agriculture in Fulton County:
Average size of farms: 304 acresAverage value of agricultural products sold per farm: $19,115
Average value of crops sold per acre for harvested cropland: $27.49
The value of livestock, poultry, and their products as a percentage of the total market value of agricultural products sold: 95.75%
Average total farm production expenses per farm: $16,868
Harvested cropland as a percentage of land in farms: 9.71%
Irrigated harvested cropland as a percentage of land in farms: 0.26%
Average market value of all machinery and equipment per farm: $26,324
The percentage of farms operated by a family or individual: 96.22%
Average age of principal farm operators: 55 years
Average number of cattle and calves per 100 acres of all land in farms: 20.55
Milk cows as a percentage of all cattle and calves: 1.47%
All wheat for grain: 80 harvested acres
Tornado activity:
Fulton County historical area-adjusted tornado activity is significantly below Arkansas state average. It is 4725702.4 times below overall U.S. average.Tornadoes in this county have caused 16 injuries recorded between 1950 and 2004.
On 3/12/1961, a category 2 (max. wind speeds 113-157 mph) tornado injured 14 people and caused between $5000 and $50,000 in damages.
Earthquake activity:
Fulton County-area historical earthquake activity is significantly above Arkansas state average. It is 495% greater than the overall U.S. average.On 3/25/1976 at 00:41:20, a magnitude 5.0 (4.9 MB, 5.0 LG, Class: Moderate, Intensity: VI - VII) earthquake occurred 92.9 miles away from Fulton County center
On 5/4/1991 at 01:18:54, a magnitude 5.0 (4.4 MB, 4.6 LG, 5.0 LG, Depth: 3.1 mi) earthquake occurred 107.0 miles away from the county center
On 9/3/2016 at 12:02:44, a magnitude 5.8 (5.8 MW, Depth: 3.5 mi) earthquake occurred 289.5 miles away from the county center
On 9/26/1990 at 13:18:51, a magnitude 5.0 (4.7 MB, 4.8 LG, 5.0 LG, Depth: 7.7 mi) earthquake occurred 133.9 miles away from the county center
On 2/28/2011 at 05:00:50, a magnitude 4.7 (4.7 MW, Depth: 2.0 mi, Class: Light, Intensity: IV - V) earthquake occurred 82.9 miles away from Fulton County center
On 5/4/2001 at 06:42:12, a magnitude 4.7 (4.2 MB, 4.7 LG, 4.5 LG) earthquake occurred 83.7 miles away from the county center
Magnitude types: regional Lg-wave magnitude (LG), body-wave magnitude (MB), moment magnitude (MW)
Most recent natural disasters:
- Arkansas Covid-19 Pandemic, Incident Period: January 20, 2020, FEMA Id: 4518, Natural disaster type: Other
- Arkansas Severe Storms, Tornadoes, Straight-line Winds, And Flooding, Incident Period: April 26, 2017 - May 19, 2017, FEMA Id: 4318, Natural disaster type: Storm, Tornado, Flood, Wind
- Arkansas Severe Storms, Tornadoes, and Flooding, Incident Period: April 27, 2014 to April 28, 2014, Major Disaster (Presidential) Declared DR-4174: April 29, 2014, FEMA Id: 4174, Natural disaster type: Storm, Tornado, Flood
- Arkansas Severe Winter Storm, Incident Period: December 05, 2013 to December 07, 2013, Major Disaster (Presidential) Declared DR-4160: January 06, 2014, FEMA Id: 4160, Natural disaster type: Winter Storm
- Arkansas Severe Storms, Tornadoes, and Associated Flooding, Incident Period: April 14, 2011 to June 03, 2011, Major Disaster (Presidential) Declared DR-1975: May 02, 2011, FEMA Id: 1975, Natural disaster type: Storm, Tornado, Flood
- Arkansas Severe Storms, Tornadoes, and Flooding, Incident Period: October 29, 2009 to November 08, 2009, Major Disaster (Presidential) Declared DR-1861: December 03, 2009, FEMA Id: 1861, Natural disaster type: Storm, Tornado, Flood
- Arkansas Severe Winter Storm, Incident Period: January 26, 2009 to January 30, 2009, Major Disaster (Presidential) Declared DR-1819: February 06, 2009, FEMA Id: 1819, Natural disaster type: Winter Storm
- Arkansas Severe Winter Storm, Incident Period: January 26, 2009 to January 30, 2009, Emergency Declared EM-3301: January 28, 2009, FEMA Id: 3301, Natural disaster type: Winter Storm
- Arkansas Severe Storms, Tornadoes, and Flooding, Incident Period: March 18, 2008 to April 28, 2008, Major Disaster (Presidential) Declared DR-1751: March 26, 2008, FEMA Id: 1751, Natural disaster type: Storm, Tornado, Flood
- Arkansas Severe Storms and Tornadoes, Incident Period: April 01, 2006 to April 03, 2006, Major Disaster (Presidential) Declared DR-1636: April 12, 2006, FEMA Id: 1636, Natural disaster type: Storm, Tornado
- 10 other natural disasters have been reported since 1953.
The number of natural disasters in Fulton County (20) is greater than the US average (15).
Major Disasters (Presidential) Declared: 15
Emergencies Declared: 3
Causes of natural disasters: Storms: 12, Floods: 11, Tornadoes: 8, Winter Storms: 4, Drought: 1, Hurricane: 1, Ice Storm: 1, Wind: 1, Other: 1 (Note: some incidents may be assigned to more than one category).
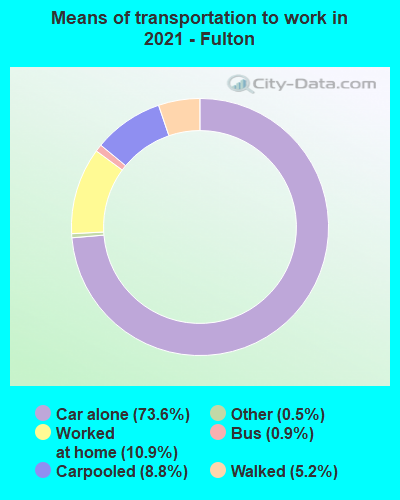
Means of transportation to work:
- Drove a car alone: 1,901 (69.8%)
- Carpooled: 254 (9.3%)
- Bus: 2 (0.1%)
- Taxicab, motorcycle, or other means: 11 (0.4%)
- Walked: 152 (5.6%)
- Worked at home: 455 (16.7%)

- Health care and social assistance (28%)
- Retail trade (16%)
- Educational services (13%)
- Accommodation and food services (5%)
- Public administration (4%)
- Manufacturing (4%)
- Other services, except public administration (3%)
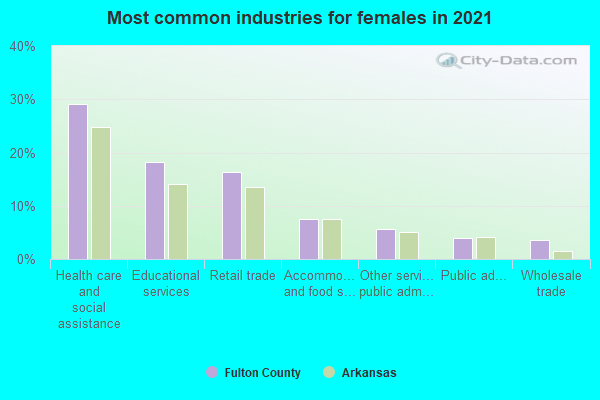
- Health care and social assistance (31%)
- Retail trade (18%)
- Educational services (15%)
- Accommodation and food services (5%)
- Public administration (4%)
- Manufacturing (4%)
- Other services, except public administration (4%)
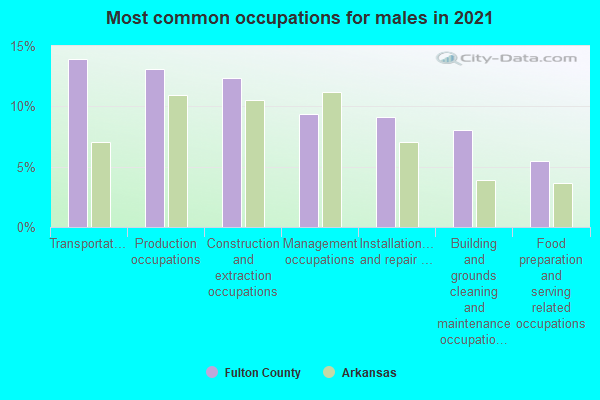
- Transportation occupations (12%)
- Management occupations (11%)
- Production occupations (10%)
- Building and grounds cleaning and maintenance occupations (9%)
- Installation, maintenance, and repair occupations (7%)
- Construction and extraction occupations (7%)
- Food preparation and serving related occupations (7%)
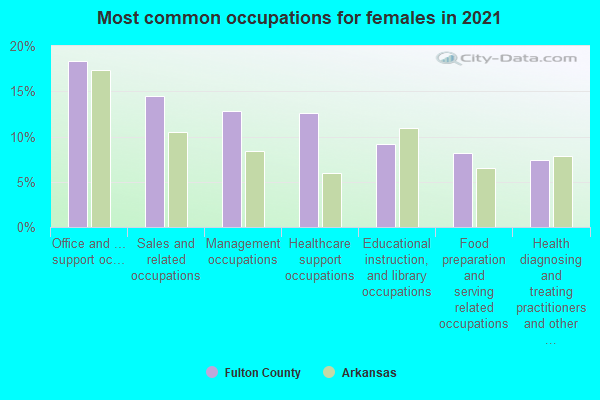
- Office and administrative support occupations (17%)
- Sales and related occupations (17%)
- Healthcare support occupations (15%)
- Management occupations (12%)
- Health diagnosing and treating practitioners and other technical occupations (10%)
- Food preparation and serving related occupations (7%)
- Educational instruction, and library occupations (6%)
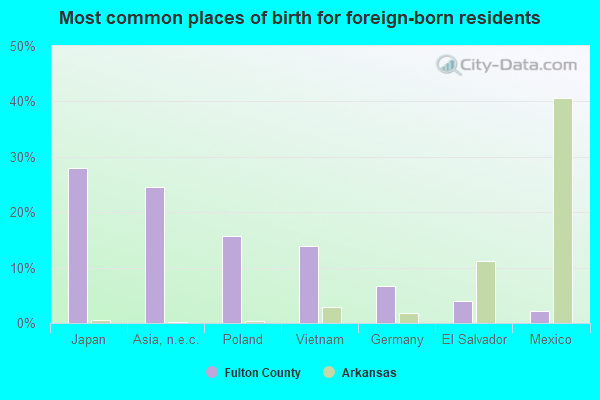
- Poland (27%)
- Vietnam (25%)
- Germany (14%)
- El Salvador (10%)
- Mexico (9%)
- Philippines (4%)
- Norway (0%)
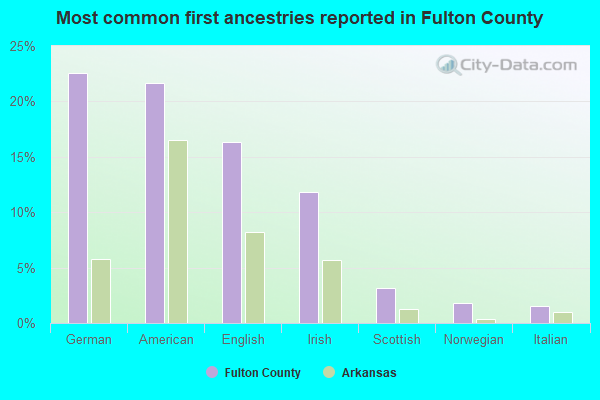
- German (23%)
- American (21%)
- English (19%)
- Irish (13%)
- Scottish (3%)
- Italian (2%)
- Swedish (2%)
People in group quarters in Fulton County, Arkansas in 2010:
- 148 people in nursing facilities/skilled-nursing facilities
- 10 people in group homes intended for adults
- 7 people in local jails and other municipal confinement facilities
People in group quarters in Fulton County, Arkansas in 2000:
- 110 people in nursing homes
- 10 people in local jails and other confinement facilities (including police lockups)
- 10 people in homes for the mentally retarded
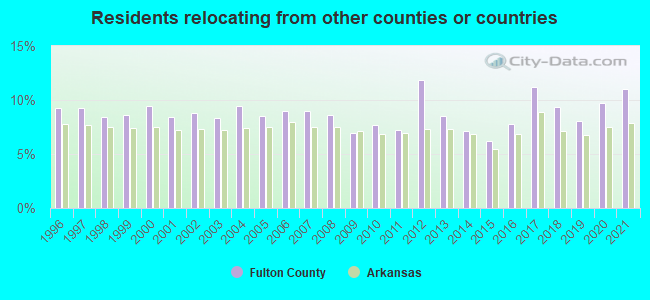
11.04% of this county's 2021 resident taxpayers lived in other counties in 2020 ($42,422 average adjusted gross income)
| Here: | 11.04% |
| Arkansas average: | 7.82% |
10 or fewer of this county's residents moved from foreign countries.
5.40% relocated from other counties in Arkansas ($19,610 average AGI)
5.65% relocated from other states ($22,812 average AGI)
Fulton County: 5.65% Arkansas average: 3.41%
Top counties from which taxpayers relocated into this county between 2020 and 2021:
| from Sharp County, AR | |
| from Baxter County, AR | |
| from Oregon County, MO | |
| from Izard County, AR |
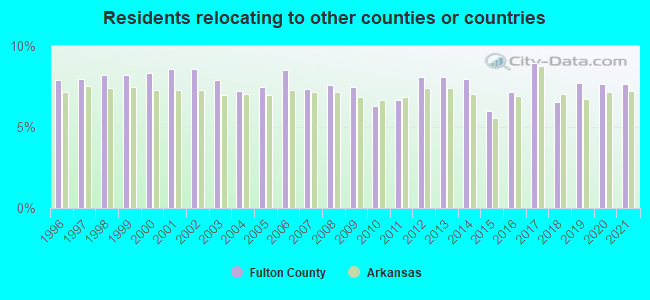
7.68% of this county's 2020 resident taxpayers moved to other counties in 2021 ($35,695 average adjusted gross income)
| Here: | 7.68% |
| Arkansas average: | 7.23% |
10 or fewer of this county's residents moved to foreign countries.
4.89% relocated to other counties in Arkansas ($25,575 average AGI)
2.79% relocated to other states ($10,120 average AGI)
Fulton County: 2.79% Arkansas average: 2.79%
Top counties to which taxpayers relocated from this county between 2020 and 2021:
| to Sharp County, AR | |
| to Baxter County, AR | |
| to Izard County, AR | |
| to Oregon County, MO |
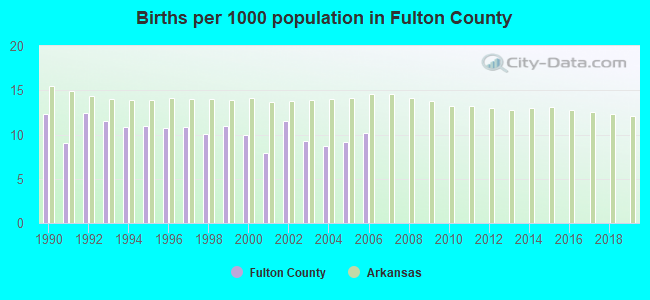
Births per 1000 population from 1990 to 1999: 11.0
Births per 1000 population from 2000 to 2006: 9.5
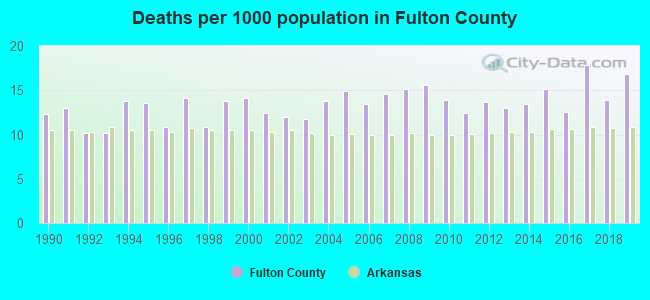
Deaths per 1000 population from 1990 to 1999: 12.3
Deaths per 1000 population from 2000 to 2009: 13.8
Deaths per 1000 population from 2010 to 2020: 14.6
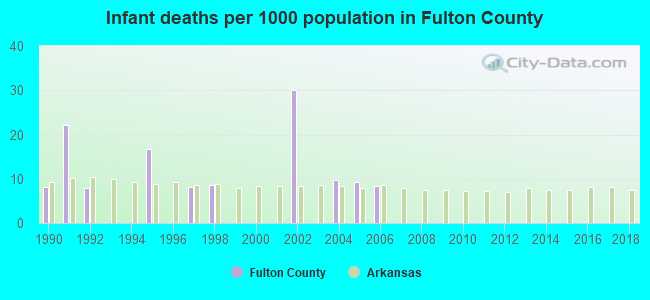
Infant deaths per 1000 live births from 1990 to 1999: 7.2
Infant deaths per 1000 live births from 2000 to 2006: 8.2
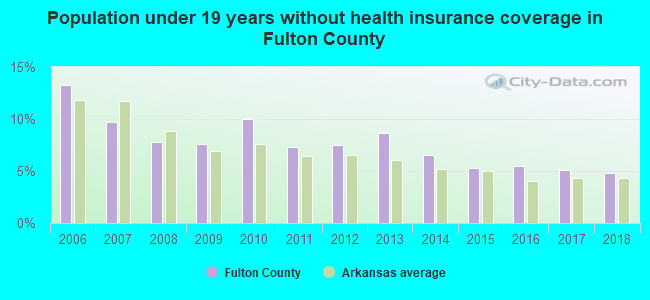
Persons under 19 years old without health insurance coverage in 2018: 4.8%
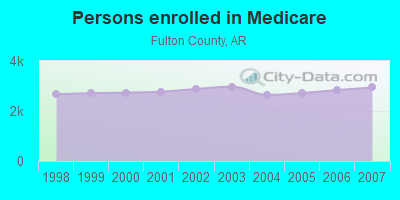
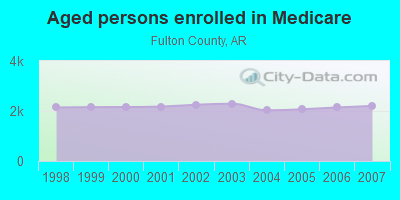
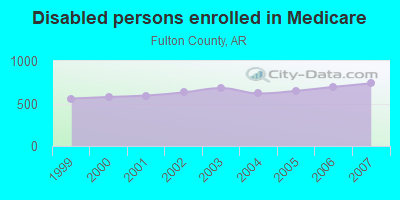
Persons enrolled in hospital insurance and/or supplemental medical insurance (Medicare) in July 1, 2007: 2,942 (2,204 aged, 738 disabled)
Children under 18 without health insurance coverage in 2007: 219 (9%)
Most common underlying causes of death in Fulton County, Arkansas in 1999 - 2019:
- Acute myocardial infarction, unspecified (303)
- Bronchus or lung, unspecified - Malignant neoplasms (244)
- Atherosclerotic heart disease (235)
- Chronic obstructive pulmonary disease, unspecified (151)
- Congestive heart failure (34)
- Non-insulin-dependent diabetes mellitus, without complications (22)
- Unspecified dementia (12)
- Alzheimer disease, unspecified (10)
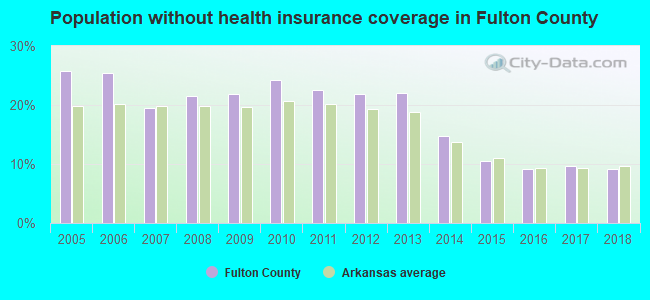
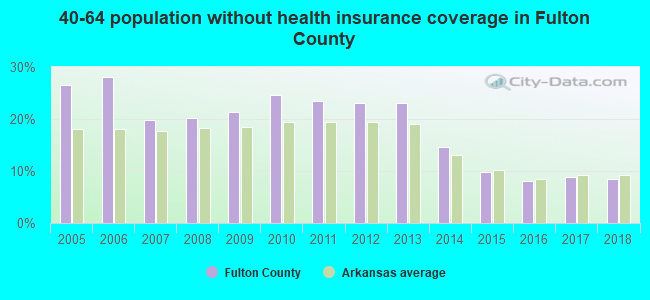
Population without health insurance coverage in 2000: 18%
Children under 18 without health insurance coverage in 2000: 14%
Suicides per 1,000,000 population from 2000 to 2006: 269.8. This is less than state average.
Household type by relationship:
Households: 12,291- Male householders: 2,302 (861 living alone), Female householders: 2,659 (948 living alone)
2,318 spouses (2,311 opposite-sex spouses), 224 unmarried partners, (224 opposite-sex unmarried partners), 3,406 children (3,069 natural, 173 adopted, 157 stepchildren), 466 grandchildren, 92 brothers or sisters, 168 parents, 0 foster children, 231 other relatives, 242 non-relatives
- In group quarters: 186
Size of family households: 1,526 2-persons, 500 3-persons, 460 4-persons, 272 5-persons, 46 6-persons, 137 7-or-more-persons.
Size of nonfamily households: 1,809 1-person, 235 2-persons.
1,905 married couples with children.
311 single-parent households (73 men, 238 women).
99.4% of residents of Fulton speak English at home.
0.3% of residents speak Spanish at home (38% speak English very well, 62% speak English not well).
0.2% of residents speak Asian or Pacific Island language at home (86% speak English very well, 14% speak English well).
In fiscal year 2004:
Federal Government expenditure: $76,713,000 ($6,442 per capita)
Department of Defense expenditure: $1,948,000
Federal direct payments to individuals for retirement and disability: $42,154,000
Federal other direct payments to individuals: $16,729,000
Federal direct payments not to individuals: $775,000
Federal grants: $14,707,000
Federal procurement contracts: $424,000 ($0,000 Department of Defense)
Federal salaries and wages: $1,924,000 ($0,000 Department of Defense)
Federal Government direct loans: $287,000
Federal guaranteed/insured loans: $910,000
Federal Government insurance: $1,197,000
Population change from April 1, 2000 to July 1, 2005:
Births: 576| Here: | 48 per 1000 residents |
| State: | 72 per 1000 residents |
Deaths: 738
| Here: | 62 per 1000 residents |
| State: | 53 per 1000 residents |
Net international migration: 0
| Here: | 0 per 1000 residents |
| State: | +8 per 1000 residents |
Net internal migration: +481
| Here: | +40 per 1000 residents |
| State: | +13 per 1000 residents |
Total withdrawal of fresh water for public supply: 0.84 millions of gallons per day (4% from ground, 96% from surface)
| Here: | 5.6 |
| State: | 6.1 |
| Here: | 4.7 |
| State: | 4.3 |
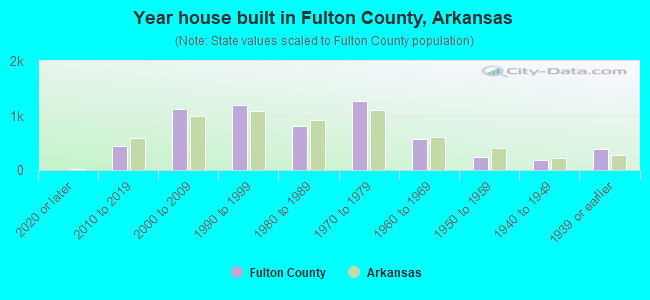
- Year house built in Fulton County, Arkansas
- 292020 or later
- 4172010 to 2019
- 9532000 to 2009
- 1,3331990 to 1999
- 6931980 to 1989
- 1,3891970 to 1979
- 6431960 to 1969
- 2051950 to 1959
- 1671940 to 1949
- 3181939 or earlier
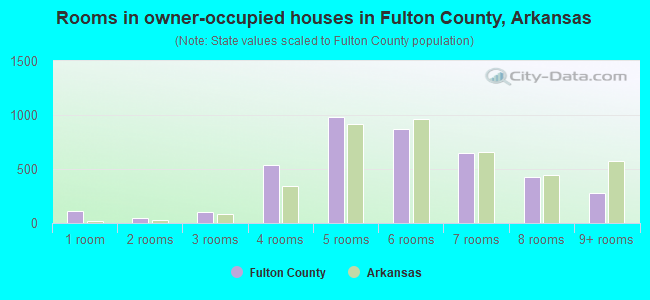
- Rooms in owner-occupied houses in Fulton County, Arkansas
- 1091 room
- 882 rooms
- 803 rooms
- 6754 rooms
- 1,0605 rooms
- 8176 rooms
- 7377 rooms
- 3988 rooms
- 2599+ rooms
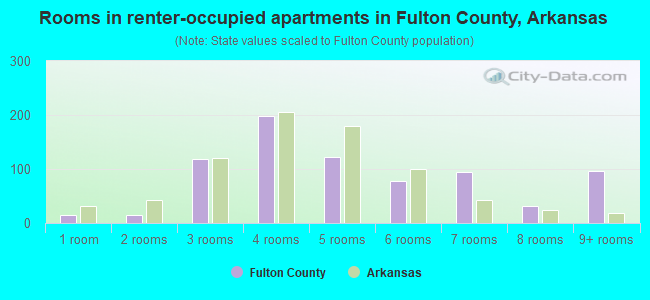
- Rooms in renter-occupied apartments in Fulton County, Arkansas
- 171 room
- 32 rooms
- 1493 rooms
- 1894 rooms
- 1335 rooms
- 1146 rooms
- 487 rooms
- 238 rooms
- 789+ rooms
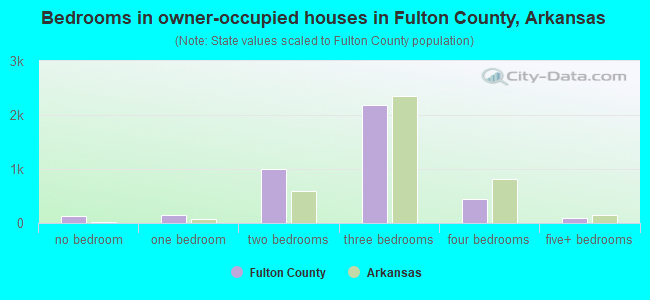
- Bedrooms in owner-occupied houses in Fulton County, Arkansas
- 127no bedroom
- 1631 bedroom
- 1,0372 bedrooms
- 2,3253 bedrooms
- 4064 bedrooms
- 1355+ bedrooms
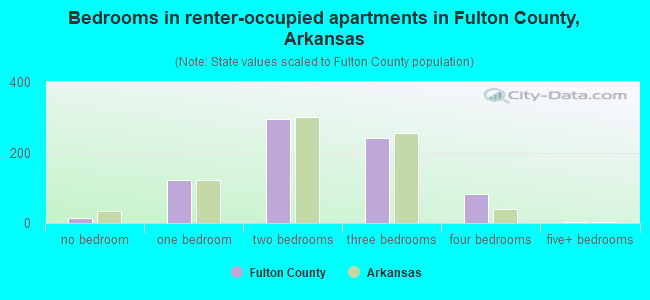
- Bedrooms in renter-occupied apartments in Fulton County, Arkansas
- 17no bedroom
- 1511 bedroom
- 2942 bedrooms
- 2293 bedrooms
- 714 bedrooms
- 05+ bedrooms
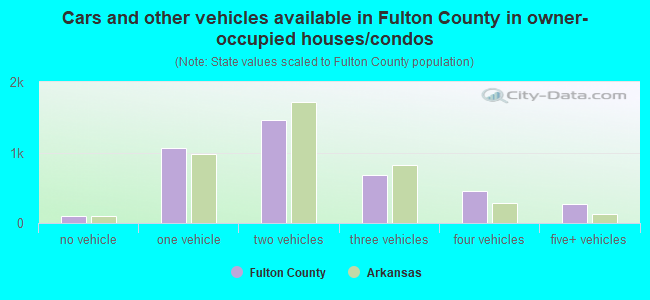
- Cars and other vehicles available in Fulton County in owner-occupied houses/condos
- 162no vehicle
- 1,1231 vehicle
- 1,6862 vehicles
- 6313 vehicles
- 3784 vehicles
- 2415+ vehicles
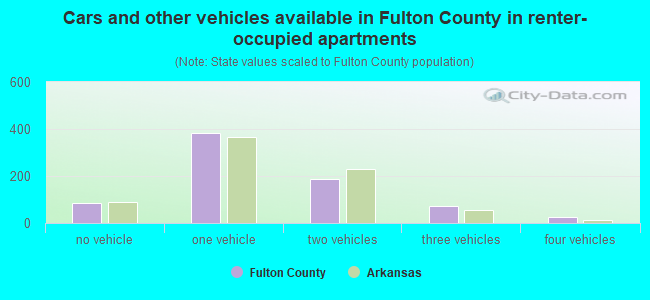
- Cars and other vehicles available in Fulton County in renter-occupied apartments
- 124no vehicle
- 3361 vehicle
- 1702 vehicles
- 953 vehicles
- 284 vehicles
- 35+ vehicles
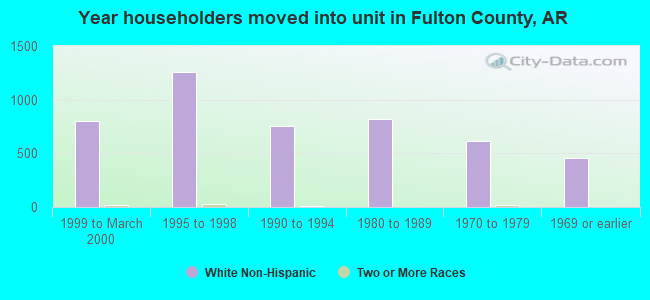
90.4% of Fulton County residents lived in the same house 1 years ago.
Out of people who lived in different houses, 19% lived in this county.
Out of people who lived in different counties, 67% lived in Arkansas.
| Fulton County: | 90.4% |
| State average: | 87.0% |
Place of birth for U.S.-born residents:
- This state: 6,299
- Other state: 5,949
- Northeast: 145
- Midwest: 3,253
- South: 1,500
- West: 1,028
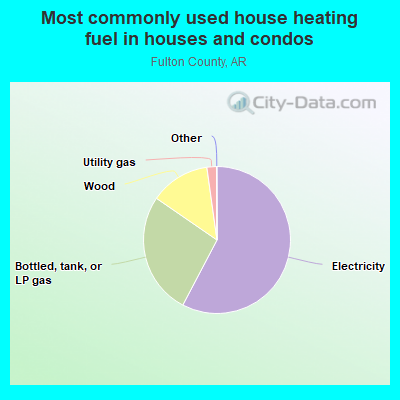
- 56.2%Electricity
- 27.5%Bottled, tank, or LP gas
- 14.1%Wood
- 2.0%Utility gas
- 63.8%Electricity
- 28.2%Bottled, tank, or LP gas
- 3.9%Utility gas
- 3.5%Wood
- 0.5%No fuel used
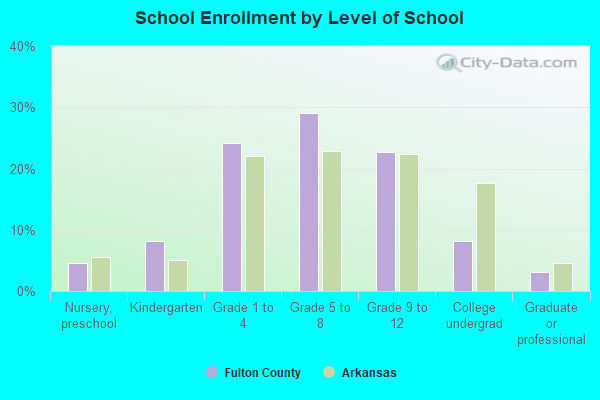
Private vs. public school enrollment:
| Here: | 22.8% |
| Arkansas: | 10.5% |
| Here: | 6.5% |
| Arkansas: | 8.7% |
| Here: | 4.3% |
| Arkansas: | 19.4% |

Fulton County government finances - Expenditure in 2018:
- Charges - Hospital Public: $13,440,000
Other: $181,000
- Construction - Parks and Recreation: $85,000
- Current Operations - Hospitals: $9,921,000
Regular Highways: $1,412,000
Police Protection: $709,000
Central Staff Services: $386,000
Financial Administration: $384,000
Judicial and Legal Services: $207,000
General - Other: $158,000
Libraries: $126,000
General Public Buildings: $109,000
Health - Other: $104,000
Local Fire Protection: $73,000
Public Welfare - Other: $66,000
Correctional Institutions: $48,000
Parks and Recreation: $10,000
- Federal Intergovernmental - General Local Government Support: $2,000
- General - Interest on Debt: $249,000
- Intergovernmental to Local - Other - Local Fire Protection: $352,000
Other - General - Other: $267,000
- Long Term Debt - Beginning Outstanding - Unspecified Public Purpose: $7,208,000
Outstanding Unspecified Public Purpose: $6,611,000
Retired Unspecified Public Purpose: $597,000
- Miscellaneous - Fines and Forfeits: $291,000
General Revenue - Other: $167,000
Interest Earnings: $7,000
- Other Capital Outlay - Hospitals: $184,000
Regular Highways: $32,000
General - Other: $11,000
- Other Funds - Cash and Securities: $2,847,000
- Sinking Funds - Cash and Securities: $176,000
- State Intergovernmental - Highways: $1,170,000
General Local Government Support: $500,000
Other: $305,000
Health and Hospitals: $60,000
- Tax - General Sales and Gross Receipts: $1,553,000
Property: $1,084,000
Public Utilities Sales: $150,000
- Total Salaries and Wages: $4,644,000
Fulton County government finances - Revenue in 2018:
- Charges - Hospital Public: $13,440,000
Other: $181,000
- Construction - Parks and Recreation: $85,000
- Current Operations - Hospitals: $9,921,000
Regular Highways: $1,412,000
Police Protection: $709,000
Central Staff Services: $386,000
Financial Administration: $384,000
Judicial and Legal Services: $207,000
General - Other: $158,000
Libraries: $126,000
General Public Buildings: $109,000
Health - Other: $104,000
Local Fire Protection: $73,000
Public Welfare - Other: $66,000
Correctional Institutions: $48,000
Parks and Recreation: $10,000
- Federal Intergovernmental - General Local Government Support: $2,000
- General - Interest on Debt: $249,000
- Intergovernmental to Local - Other - Local Fire Protection: $352,000
Other - General - Other: $267,000
- Long Term Debt - Beginning Outstanding - Unspecified Public Purpose: $7,208,000
Outstanding Unspecified Public Purpose: $6,611,000
Retired Unspecified Public Purpose: $597,000
- Miscellaneous - Fines and Forfeits: $291,000
General Revenue - Other: $167,000
Interest Earnings: $7,000
- Other Capital Outlay - Hospitals: $184,000
Regular Highways: $32,000
General - Other: $11,000
- Other Funds - Cash and Securities: $2,847,000
- Sinking Funds - Cash and Securities: $176,000
- State Intergovernmental - Highways: $1,170,000
General Local Government Support: $500,000
Other: $305,000
Health and Hospitals: $60,000
- Tax - General Sales and Gross Receipts: $1,553,000
Property: $1,084,000
Public Utilities Sales: $150,000
- Total Salaries and Wages: $4,644,000
Fulton County government finances - Debt in 2018:
- Charges - Hospital Public: $13,440,000
Other: $181,000
- Construction - Parks and Recreation: $85,000
- Current Operations - Hospitals: $9,921,000
Regular Highways: $1,412,000
Police Protection: $709,000
Central Staff Services: $386,000
Financial Administration: $384,000
Judicial and Legal Services: $207,000
General - Other: $158,000
Libraries: $126,000
General Public Buildings: $109,000
Health - Other: $104,000
Local Fire Protection: $73,000
Public Welfare - Other: $66,000
Correctional Institutions: $48,000
Parks and Recreation: $10,000
- Federal Intergovernmental - General Local Government Support: $2,000
- General - Interest on Debt: $249,000
- Intergovernmental to Local - Other - Local Fire Protection: $352,000
Other - General - Other: $267,000
- Long Term Debt - Beginning Outstanding - Unspecified Public Purpose: $7,208,000
Outstanding Unspecified Public Purpose: $6,611,000
Retired Unspecified Public Purpose: $597,000
- Miscellaneous - Fines and Forfeits: $291,000
General Revenue - Other: $167,000
Interest Earnings: $7,000
- Other Capital Outlay - Hospitals: $184,000
Regular Highways: $32,000
General - Other: $11,000
- Other Funds - Cash and Securities: $2,847,000
- Sinking Funds - Cash and Securities: $176,000
- State Intergovernmental - Highways: $1,170,000
General Local Government Support: $500,000
Other: $305,000
Health and Hospitals: $60,000
- Tax - General Sales and Gross Receipts: $1,553,000
Property: $1,084,000
Public Utilities Sales: $150,000
- Total Salaries and Wages: $4,644,000
Fulton County government finances - Cash and Securities in 2018:
- Charges - Hospital Public: $13,440,000
Other: $181,000
- Construction - Parks and Recreation: $85,000
- Current Operations - Hospitals: $9,921,000
Regular Highways: $1,412,000
Police Protection: $709,000
Central Staff Services: $386,000
Financial Administration: $384,000
Judicial and Legal Services: $207,000
General - Other: $158,000
Libraries: $126,000
General Public Buildings: $109,000
Health - Other: $104,000
Local Fire Protection: $73,000
Public Welfare - Other: $66,000
Correctional Institutions: $48,000
Parks and Recreation: $10,000
- Federal Intergovernmental - General Local Government Support: $2,000
- General - Interest on Debt: $249,000
- Intergovernmental to Local - Other - Local Fire Protection: $352,000
Other - General - Other: $267,000
- Long Term Debt - Beginning Outstanding - Unspecified Public Purpose: $7,208,000
Outstanding Unspecified Public Purpose: $6,611,000
Retired Unspecified Public Purpose: $597,000
- Miscellaneous - Fines and Forfeits: $291,000
General Revenue - Other: $167,000
Interest Earnings: $7,000
- Other Capital Outlay - Hospitals: $184,000
Regular Highways: $32,000
General - Other: $11,000
- Other Funds - Cash and Securities: $2,847,000
- Sinking Funds - Cash and Securities: $176,000
- State Intergovernmental - Highways: $1,170,000
General Local Government Support: $500,000
Other: $305,000
Health and Hospitals: $60,000
- Tax - General Sales and Gross Receipts: $1,553,000
Property: $1,084,000
Public Utilities Sales: $150,000
- Total Salaries and Wages: $4,644,000
Supplemental Security Income (SSI) in 2006:
- Total number of recipients: 497
- Number of aged recipients: 54
- Number of blind and disabled recipients: 443
- Number of recipients under 18: 43
- Number of recipients between 18 and 64: 334
- Number of recipients older than 64: 120
- Number of recipients also receiving OASDI: 244
- Amount of payments (thousands of dollars): 199
| Most common first names in Fulton County, AR among deceased individuals | ||
| Name | Count | Lived (average) |
|---|---|---|
| William | 90 | 78.9 years |
| James | 86 | 77.2 years |
| John | 80 | 78.1 years |
| Mary | 53 | 82.0 years |
| George | 48 | 75.4 years |
| Charles | 40 | 73.7 years |
| Robert | 39 | 75.2 years |
| Ruth | 23 | 82.2 years |
| Thomas | 23 | 75.9 years |
| Donald | 22 | 65.0 years |
| Most common last names in Fulton County, AR among deceased individuals | ||
| Last name | Count | Lived (average) |
|---|---|---|
| Smith | 65 | 75.9 years |
| Young | 29 | 76.6 years |
| Collins | 29 | 79.5 years |
| Taylor | 27 | 76.1 years |
| Johnson | 26 | 76.0 years |
| Williams | 26 | 76.6 years |
| Brown | 25 | 77.3 years |
| Langston | 21 | 76.4 years |
| Martin | 20 | 74.5 years |
| Davis | 20 | 77.1 years |
| Businesses in Fulton County, AR | ||||
| Name | Count | Name | Count | |
|---|---|---|---|---|
| Dairy Queen | 1 | SONIC Drive-In | 2 | |
| H&R Block | 1 | Subway | 1 | |
| RadioShack | 1 | |||
Fulton County on our top lists:
- #62 on the list of "Top 101 counties with the smallest number of children under 18 without health insurance coverage in 2000"
- #77 on the list of "Top 101 counties with the lowest ground withdrawal of fresh water for public supply"