Crime rate in Berkeley, California (CA): murders, rapes, robberies, assaults, burglaries, thefts, auto thefts, arson, law enforcement employees, police officers, crime map
Crime rate in Berkeley, CA
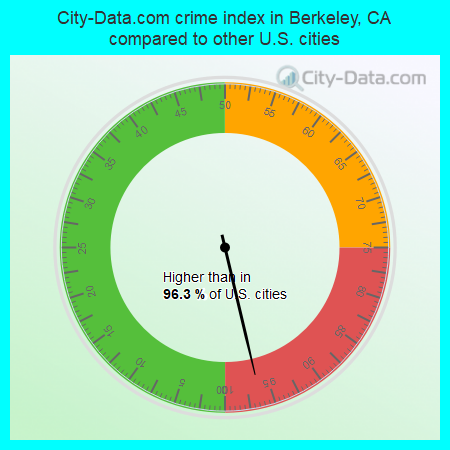
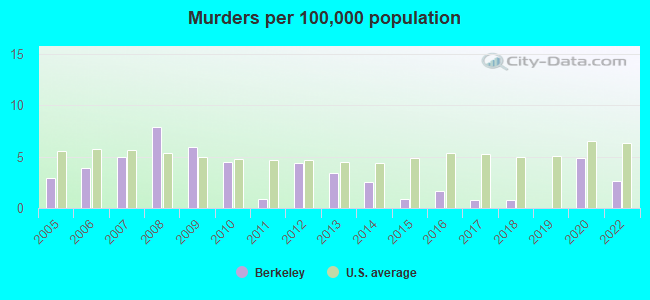
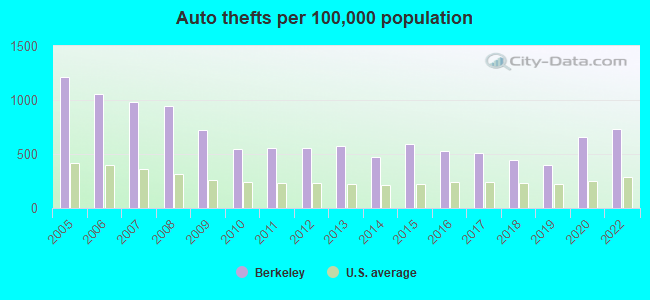
The 2022 crime rate in Berkeley, CA is 475 (City-Data.com crime index), which is 1.9 times higher than the U.S. average. It was higher than in 96.3% U.S. cities. The 2022 Berkeley crime rate rose by 29% compared to 2020. The number of homicides stood at 3 - a decrease of 3 compared to 2020. In the last 5 years Berkeley has seen rise of violent crime and increasing property crime.See how dangerous Berkeley, CA is compared to the nearest cities:
(Note: Higher means more crime)
(Note: Higher means more crime)
| Berkeley: | 475.2 |
| Albany: | 209.0 |
| Kensington: | 119.7 |
| Emeryville: | 1,025.3 |
| El Cerrito: | 315.1 |
| Piedmont: | 252.7 |
| Orinda: | 50.9 |
| Richmond: | 385.6 |
| Oakland: | 814.9 |
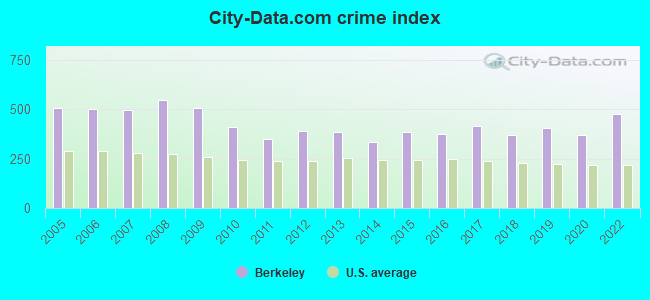
The City-Data.com crime index weighs serious crimes and violent crimes more heavily. Higher means more crime, U.S. average is 246.1. It adjusts for the number of visitors and daily workers commuting into cities.
- means the value is smaller than the state average.- means the value is about the same as the state average.
- means the value is bigger than the state average.
- means the value is much bigger than the state average.
According to our research of California and other state lists, there were 69 registered sex offenders living in Berkeley, California as of April 27, 2024.
The ratio of all residents to sex offenders in Berkeley is 1,757 to 1.
The ratio of registered sex offenders to all residents in this city is lower than the state average.
Violent crime rate in 2022
| Berkeley: | 333.4 |
| U.S. Average: | 219.8 |
Violent crime rate in 2020
| Berkeley: | 246.0 |
| U.S. Average: | 228.2 |
Violent crime rate in 2019
| Berkeley: | 281.8 |
| U.S. Average: | 219.9 |
Violent crime rate in 2018
| Berkeley: | 264.3 |
| U.S. Average: | 221.2 |
Violent crime rate in 2017
| Berkeley: | 306.5 |
| U.S. Average: | 226.2 |
Violent crime rate in 2016
| Berkeley: | 269.9 |
| U.S. Average: | 227.3 |
Violent crime rate in 2015
| Berkeley: | 239.6 |
| U.S. Average: | 219.3 |
Violent crime rate in 2014
| Berkeley: | 201.7 |
| U.S. Average: | 211.1 |
Violent crime rate in 2013
| Berkeley: | 258.1 |
| U.S. Average: | 214.2 |
Violent crime rate in 2012
| Berkeley: | 235.3 |
| U.S. Average: | 187.4 |
Violent crime rate in 2011
| Berkeley: | 221.2 |
| U.S. Average: | 187.1 |
Violent crime rate in 2010
| Berkeley: | 253.6 |
| U.S. Average: | 195.7 |
Violent crime rate in 2009
| Berkeley: | 326.1 |
| U.S. Average: | 208.9 |
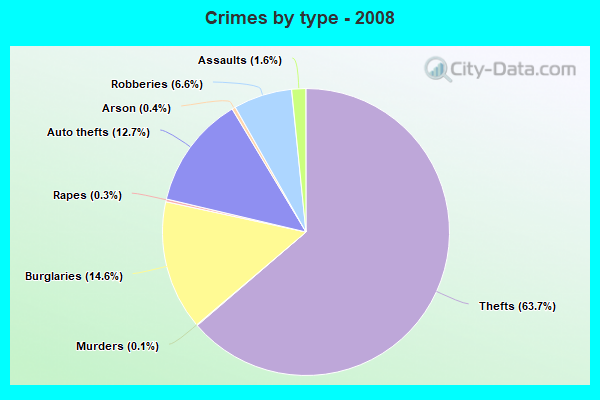
Violent crime rate in 2008
| Berkeley: | 346.4 |
| U.S. Average: | 222.5 |
Violent crime rate in 2007
| Berkeley: | 304.4 |
| U.S. Average: | 229.1 |
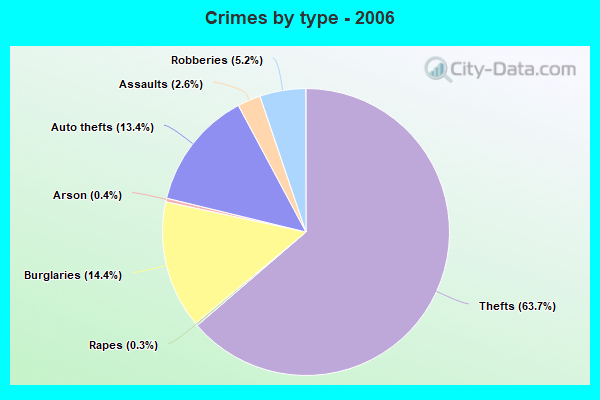
Violent crime rate in 2006
| Berkeley: | 304.4 |
| U.S. Average: | 232.6 |
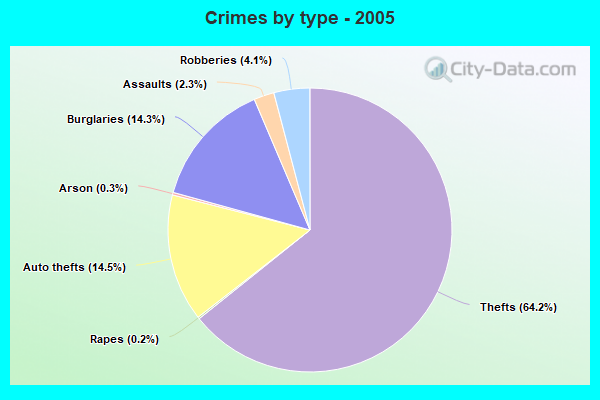
Violent crime rate in 2005
| Berkeley: | 265.8 |
| U.S. Average: | 227.0 |
Property crime rate in 2022
| Berkeley: | 490.2 |
| U.S. Average: | 166.5 |
Property crime rate in 2020
| Berkeley: | 389.7 |
| U.S. Average: | 169.6 |
Property crime rate in 2019
| Berkeley: | 389.0 |
| U.S. Average: | 179.7 |
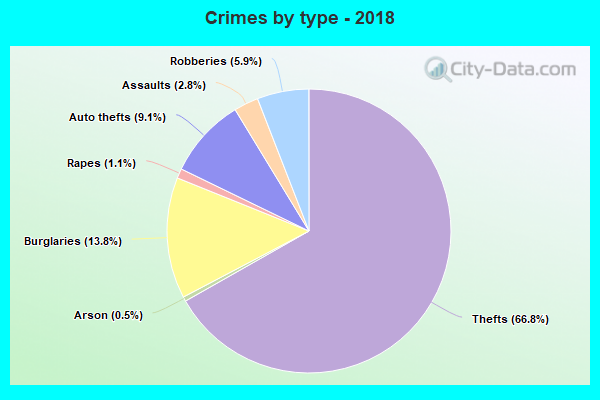
Property crime rate in 2018
| Berkeley: | 362.2 |
| U.S. Average: | 190.2 |
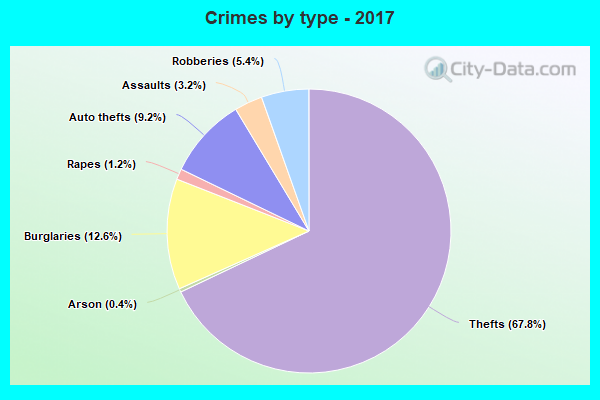
Property crime rate in 2017
| Berkeley: | 399.0 |
| U.S. Average: | 206.4 |
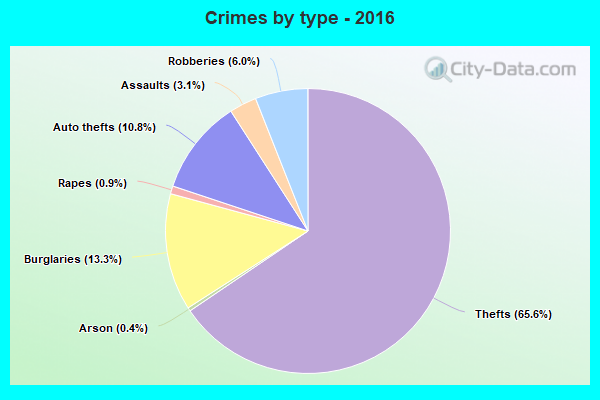
Property crime rate in 2016
| Berkeley: | 372.4 |
| U.S. Average: | 216.6 |
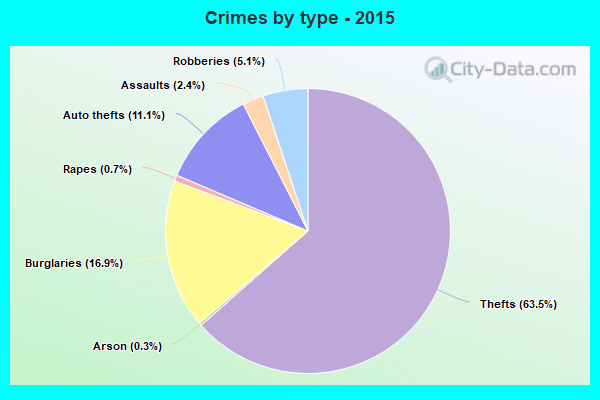
Property crime rate in 2015
| Berkeley: | 440.7 |
| U.S. Average: | 221.5 |
Property crime rate in 2014
| Berkeley: | 382.5 |
| U.S. Average: | 230.8 |
Property crime rate in 2013
| Berkeley: | 424.6 |
| U.S. Average: | 250.4 |
Property crime rate in 2012
| Berkeley: | 430.2 |
| U.S. Average: | 267.3 |
Property crime rate in 2011
| Berkeley: | 406.0 |
| U.S. Average: | 273.5 |
Property crime rate in 2010
| Berkeley: | 463.5 |
| U.S. Average: | 276.4 |
Property crime rate in 2009
| Berkeley: | 551.3 |
| U.S. Average: | 285.6 |
Property crime rate in 2008
| Berkeley: | 594.3 |
| U.S. Average: | 302.2 |
Property crime rate in 2007
| Berkeley: | 566.7 |
| U.S. Average: | 309.2 |
Property crime rate in 2006
| Berkeley: | 578.7 |
| U.S. Average: | 317.3 |
Property crime rate in 2005
| Berkeley: | 630.0 |
| U.S. Average: | 322.3 |
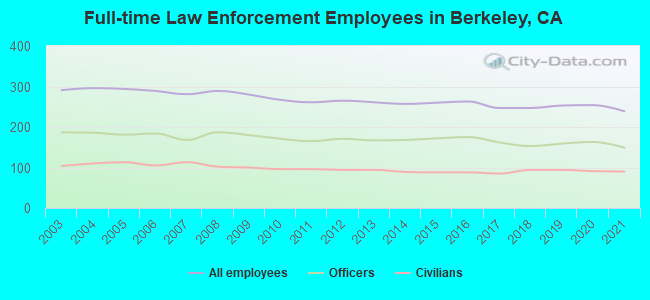
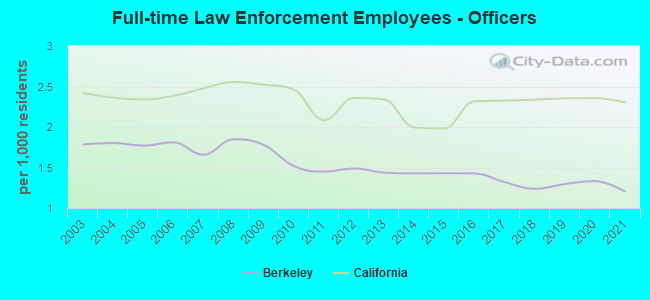
Full-time law enforcement employees in 2021, including police officers: 239 (149 officers - 125 male; 24 female).
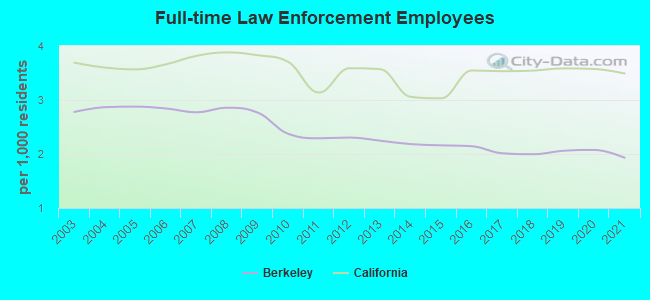
| Officers per 1,000 residents here: | 1.20 |
| California average: | 2.30 |
Full-time law enforcement employees in 2020, including police officers: 254 (163 officers - 137 male; 26 female).
| Officers per 1,000 residents here: | 1.33 |
| California average: | 2.36 |
Full-time law enforcement employees in 2019, including police officers: 253 (159 officers - 134 male; 25 female).
| Officers per 1,000 residents here: | 1.29 |
| California average: | 2.35 |
Full-time law enforcement employees in 2018, including police officers: 247 (153 officers - 130 male; 23 female).
| Officers per 1,000 residents here: | 1.24 |
| California average: | 2.34 |
Full-time law enforcement employees in 2017, including police officers: 247 (162 officers - 133 male; 29 female).
| Officers per 1,000 residents here: | 1.32 |
| California average: | 2.32 |
Full-time law enforcement employees in 2016, including police officers: 263 (175 officers - 141 male; 34 female).
| Officers per 1,000 residents here: | 1.43 |
| California average: | 2.32 |
Full-time law enforcement employees in 2015, including police officers: 260 (172 officers - 135 male; 37 female).
| Officers per 1,000 residents here: | 1.43 |
| California average: | 1.98 |
Full-time law enforcement employees in 2014, including police officers: 257 (168 officers - 134 male; 34 female).
| Officers per 1,000 residents here: | 1.43 |
| California average: | 2.00 |
Full-time law enforcement employees in 2013, including police officers: 261 (167 officers - 134 male; 33 female).
| Officers per 1,000 residents here: | 1.44 |
| California average: | 2.34 |
Full-time law enforcement employees in 2012, including police officers: 265 (171 officers - 136 male; 35 female).
| Officers per 1,000 residents here: | 1.49 |
| California average: | 2.36 |
Full-time law enforcement employees in 2011, including police officers: 261 (165 officers - 131 male; 34 female).
| Officers per 1,000 residents here: | 1.45 |
| California average: | 2.09 |
Full-time law enforcement employees in 2010, including police officers: 267 (171 officers - 134 male; 37 female).
| Officers per 1,000 residents here: | 1.52 |
| California average: | 2.46 |
Full-time law enforcement employees in 2009, including police officers: 280 (180 officers - 140 male; 40 female).
| Officers per 1,000 residents here: | 1.78 |
| California average: | 2.52 |
Full-time law enforcement employees in 2008, including police officers: 289 (187 officers - 106 male; 81 female).
| Officers per 1,000 residents here: | 1.85 |
| California average: | 2.55 |
Full-time law enforcement employees in 2007, including police officers: 281 (168 officers - 133 male; 35 female).
| Officers per 1,000 residents here: | 1.66 |
| California average: | 2.48 |
Full-time law enforcement employees in 2006, including police officers: 289 (184 officers - 147 male; 37 female).
| Officers per 1,000 residents here: | 1.81 |
| California average: | 2.38 |
Full-time law enforcement employees in 2005, including police officers: 294 (181 officers - 144 male; 37 female).
| Officers per 1,000 residents here: | 1.77 |
| California average: | 2.34 |
Full-time law enforcement employees in 2004, including police officers: 296 (186 officers - 150 male; 36 female).
| Officers per 1,000 residents here: | 1.80 |
| California average: | 2.36 |
Full-time law enforcement employees in 2003, including police officers: 291 (187 officers - 151 male; 36 female).
| Officers per 1,000 residents here: | 1.79 |
| California average: | 2.42 |


Zip codes: 94608, 94609, 94618, 94702, 94703, 94704, 94705, 94708, 94709, 94720.