Crime rate in Fort Wayne, Indiana (IN): murders, rapes, robberies, assaults, burglaries, thefts, auto thefts, arson, law enforcement employees, police officers, crime map
Crime rate in Fort Wayne, IN
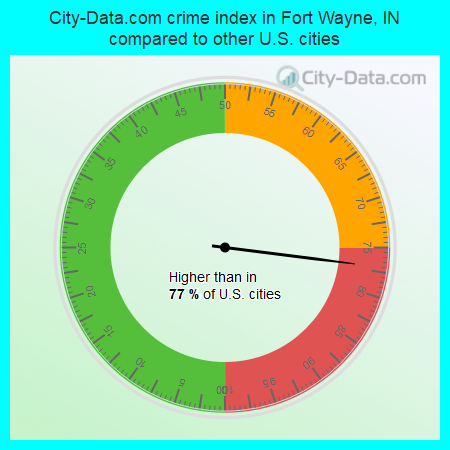
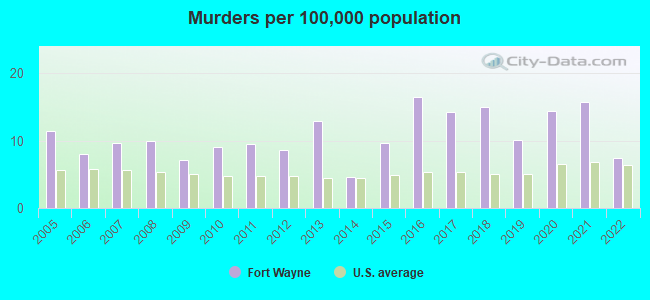
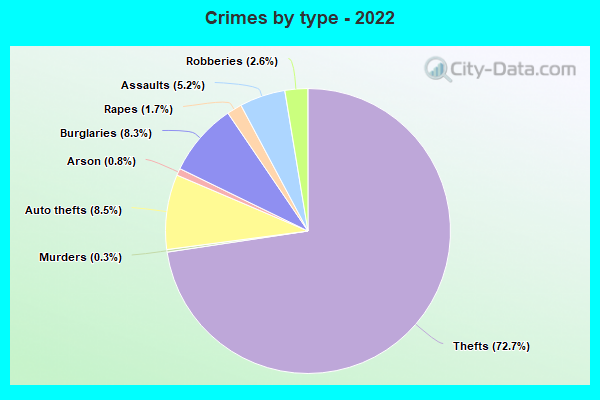
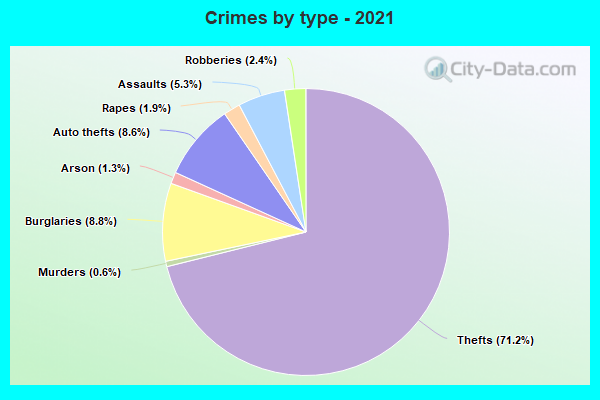
The 2022 crime rate in Fort Wayne, IN is 211 (City-Data.com crime index), which is about the average for the U.S. cities. It was higher than in 77.0% U.S. cities. The 2022 Fort Wayne crime rate fell by 4% compared to 2021. The number of homicides stood at 20 - a decrease of 23 compared to 2021. In the last 5 years Fort Wayne has seen decreasing violent crime and decline of property crime.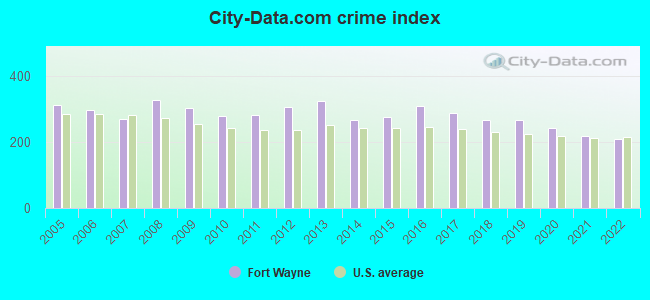
The City-Data.com crime index weighs serious crimes and violent crimes more heavily. Higher means more crime, U.S. average is 246.1. It adjusts for the number of visitors and daily workers commuting into cities.
- means the value is smaller than the state average.- means the value is about the same as the state average.
- means the value is bigger than the state average.
- means the value is much bigger than the state average.
According to our research of Indiana and other state lists, there were 18 registered sex offenders living in Fort Wayne, Indiana as of April 27, 2024.
The ratio of all residents to sex offenders in Fort Wayne is 14,519 to 1.
The ratio of registered sex offenders to all residents in this city is much lower than the state average.
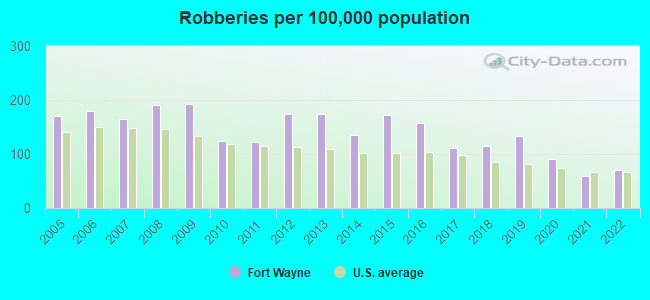
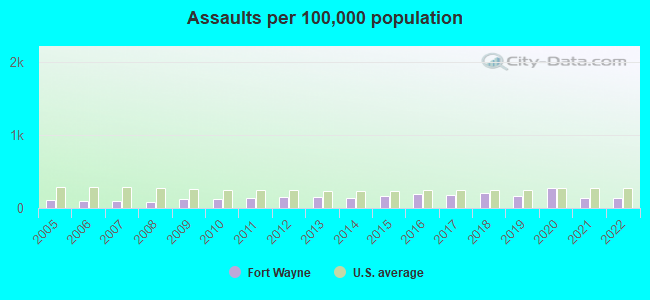
Violent crime rate in 2022
| Fort Wayne: | 164.7 |
| U.S. Average: | 219.8 |
Violent crime rate in 2021
| Fort Wayne: | 175.9 |
| U.S. Average: | 224.8 |
Violent crime rate in 2020
| Fort Wayne: | 245.7 |
| U.S. Average: | 228.2 |
Violent crime rate in 2019
| Fort Wayne: | 222.9 |
| U.S. Average: | 219.9 |
Violent crime rate in 2018
| Fort Wayne: | 238.2 |
| U.S. Average: | 221.2 |
Violent crime rate in 2017
| Fort Wayne: | 225.7 |
| U.S. Average: | 226.2 |
Violent crime rate in 2016
| Fort Wayne: | 241.6 |
| U.S. Average: | 227.3 |
Violent crime rate in 2015
| Fort Wayne: | 222.6 |
| U.S. Average: | 219.3 |
Violent crime rate in 2014
| Fort Wayne: | 185.9 |
| U.S. Average: | 211.1 |
Violent crime rate in 2013
| Fort Wayne: | 224.7 |
| U.S. Average: | 214.2 |
Violent crime rate in 2012
| Fort Wayne: | 212.4 |
| U.S. Average: | 187.4 |
Violent crime rate in 2011
| Fort Wayne: | 186.5 |
| U.S. Average: | 187.1 |
Violent crime rate in 2010
| Fort Wayne: | 179.5 |
| U.S. Average: | 195.7 |
Violent crime rate in 2009
| Fort Wayne: | 199.7 |
| U.S. Average: | 208.9 |
Violent crime rate in 2008
| Fort Wayne: | 196.5 |
| U.S. Average: | 222.5 |
Violent crime rate in 2007
| Fort Wayne: | 158.5 |
| U.S. Average: | 229.1 |
Violent crime rate in 2006
| Fort Wayne: | 160.5 |
| U.S. Average: | 232.6 |
Violent crime rate in 2005
| Fort Wayne: | 173.1 |
| U.S. Average: | 227.0 |
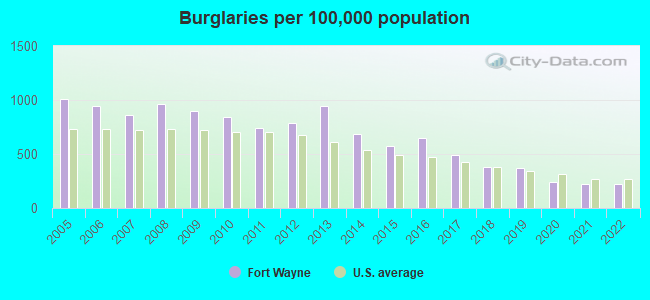
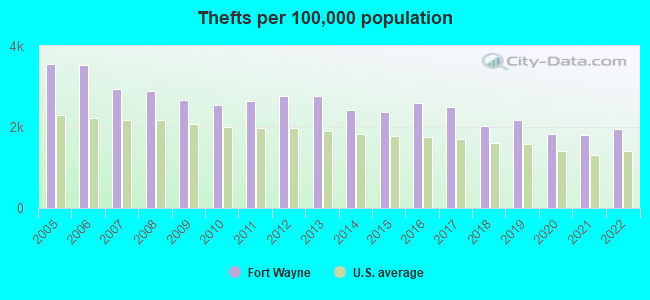
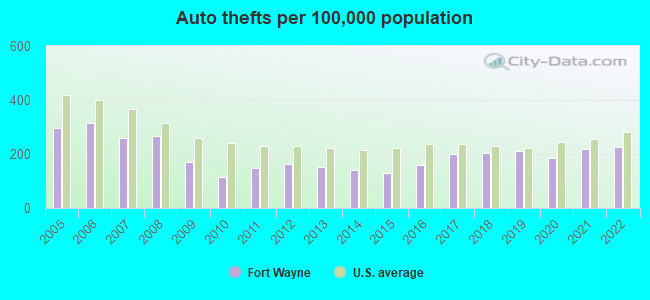
Property crime rate in 2022
| Fort Wayne: | 175.1 |
| U.S. Average: | 166.5 |
Property crime rate in 2021
| Fort Wayne: | 167.5 |
| U.S. Average: | 157.8 |
Property crime rate in 2020
| Fort Wayne: | 167.2 |
| U.S. Average: | 169.6 |
Property crime rate in 2019
| Fort Wayne: | 214.3 |
| U.S. Average: | 179.7 |
Property crime rate in 2018
| Fort Wayne: | 207.8 |
| U.S. Average: | 190.2 |
Property crime rate in 2017
| Fort Wayne: | 252.6 |
| U.S. Average: | 206.4 |
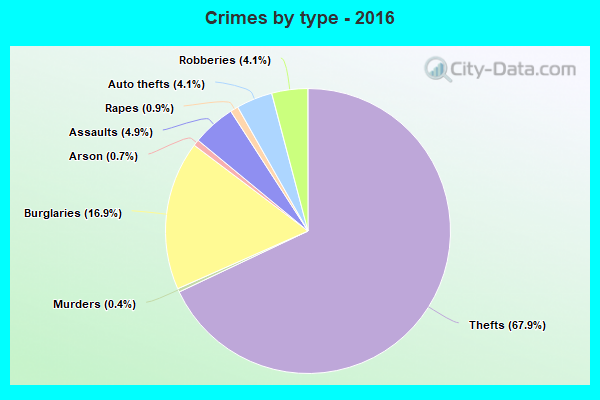
Property crime rate in 2016
| Fort Wayne: | 283.7 |
| U.S. Average: | 216.6 |
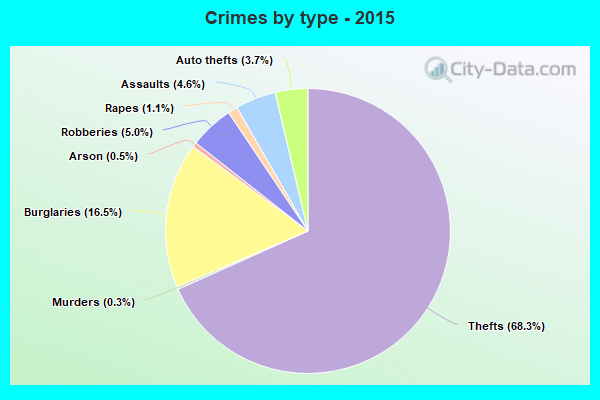
Property crime rate in 2015
| Fort Wayne: | 251.2 |
| U.S. Average: | 221.5 |
Property crime rate in 2014
| Fort Wayne: | 279.5 |
| U.S. Average: | 230.8 |
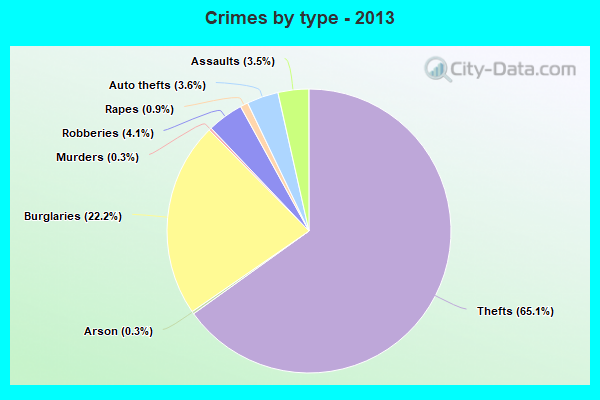
Property crime rate in 2013
| Fort Wayne: | 348.6 |
| U.S. Average: | 250.4 |
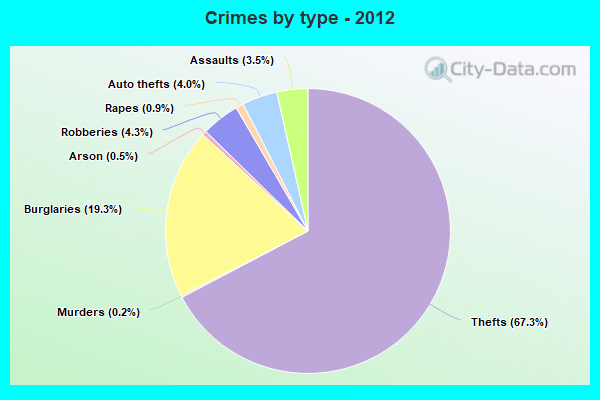
Property crime rate in 2012
| Fort Wayne: | 320.0 |
| U.S. Average: | 267.3 |
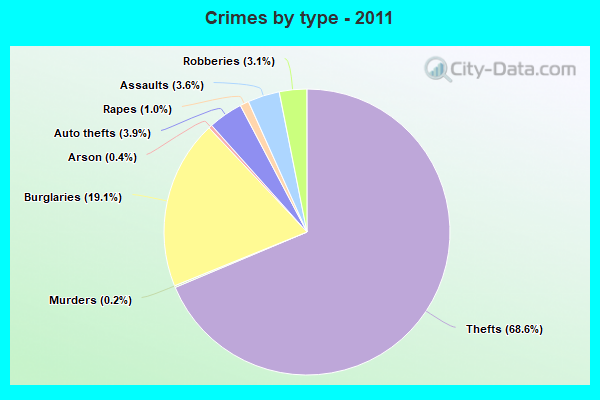
Property crime rate in 2011
| Fort Wayne: | 303.2 |
| U.S. Average: | 273.5 |
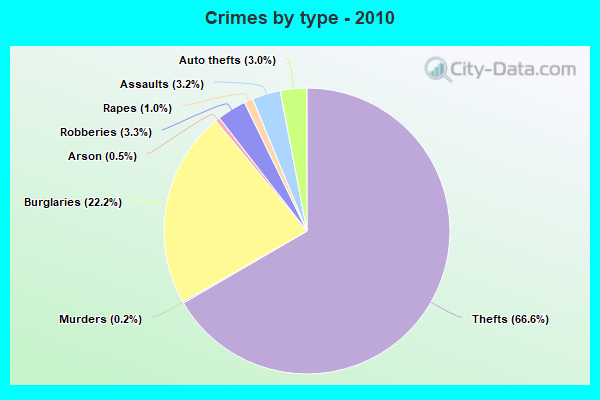
Property crime rate in 2010
| Fort Wayne: | 312.5 |
| U.S. Average: | 276.4 |
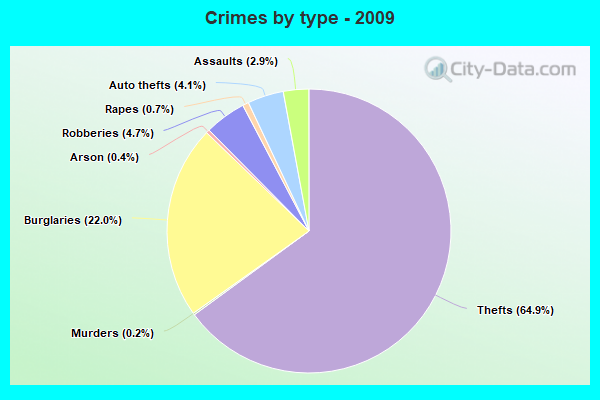
Property crime rate in 2009
| Fort Wayne: | 338.7 |
| U.S. Average: | 285.6 |
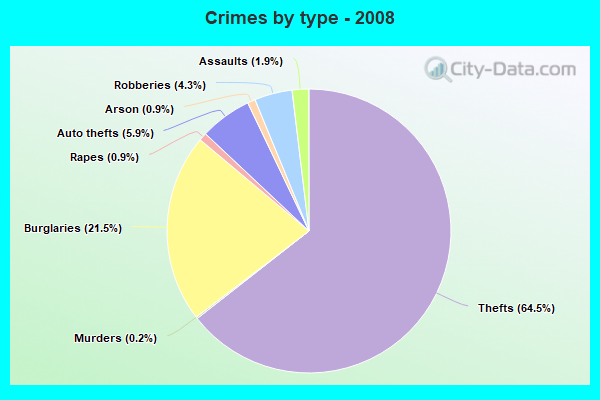
Property crime rate in 2008
| Fort Wayne: | 375.7 |
| U.S. Average: | 302.2 |
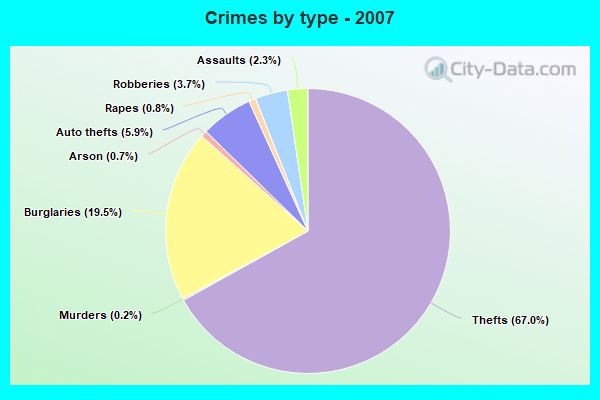
Property crime rate in 2007
| Fort Wayne: | 306.2 |
| U.S. Average: | 309.2 |
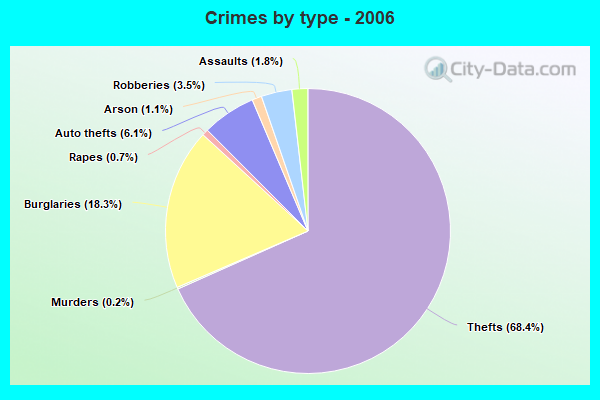
Property crime rate in 2006
| Fort Wayne: | 353.7 |
| U.S. Average: | 317.3 |
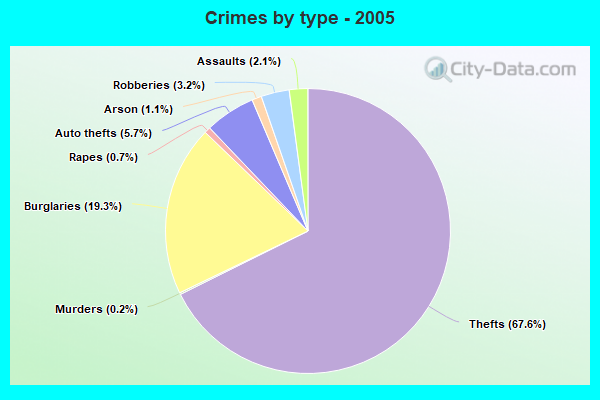
Property crime rate in 2005
| Fort Wayne: | 364.2 |
| U.S. Average: | 322.3 |
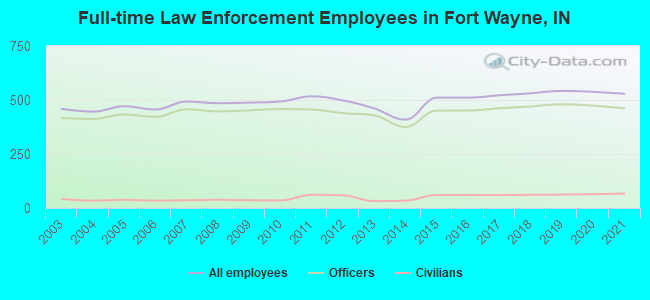
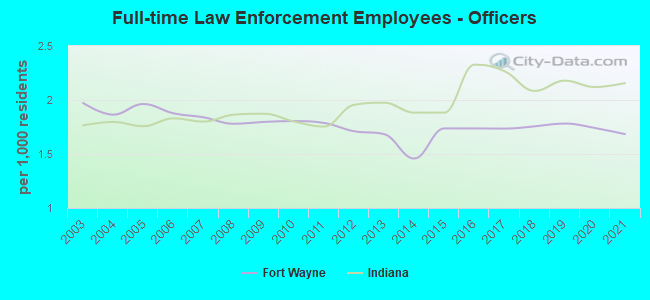
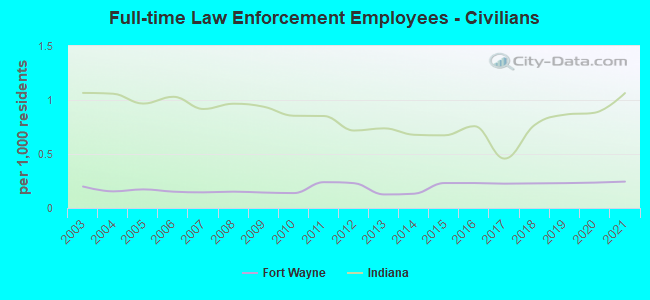
Full-time law enforcement employees in 2021, including police officers: 529 (462 officers - 408 male; 54 female).
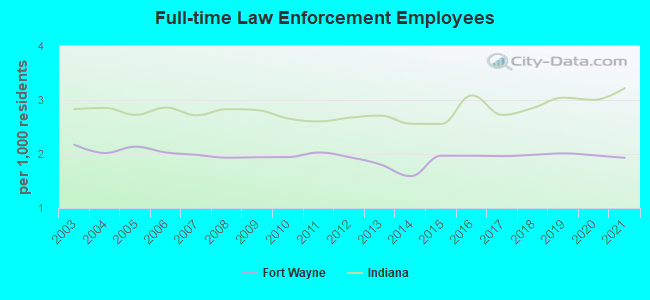
| Officers per 1,000 residents here: | 1.68 |
| Indiana average: | 2.16 |
Full-time law enforcement employees in 2020, including police officers: 538 (474 officers - 418 male; 56 female).
| Officers per 1,000 residents here: | 1.74 |
| Indiana average: | 2.12 |
Full-time law enforcement employees in 2019, including police officers: 542 (480 officers - 425 male; 55 female).
| Officers per 1,000 residents here: | 1.78 |
| Indiana average: | 2.18 |
Full-time law enforcement employees in 2018, including police officers: 531 (470 officers - 415 male; 55 female).
| Officers per 1,000 residents here: | 1.76 |
| Indiana average: | 2.08 |
Full-time law enforcement employees in 2017, including police officers: 522 (462 officers - 407 male; 55 female).
| Officers per 1,000 residents here: | 1.74 |
| Indiana average: | 2.27 |
Full-time law enforcement employees in 2015, including police officers: 511 (451 officers - 397 male; 54 female).
| Officers per 1,000 residents here: | 1.74 |
| Indiana average: | 1.88 |
Full-time law enforcement employees in 2014, including police officers: 409 (375 officers - 332 male; 43 female).
| Officers per 1,000 residents here: | 1.46 |
| Indiana average: | 1.88 |
Full-time law enforcement employees in 2013, including police officers: 461 (429 officers - 379 male; 50 female).
| Officers per 1,000 residents here: | 1.68 |
| Indiana average: | 1.97 |
Full-time law enforcement employees in 2012, including police officers: 498 (439 officers - 388 male; 51 female).
| Officers per 1,000 residents here: | 1.71 |
| Indiana average: | 1.96 |
Full-time law enforcement employees in 2011, including police officers: 517 (456 officers - 402 male; 54 female).
| Officers per 1,000 residents here: | 1.79 |
| Indiana average: | 1.75 |
Full-time law enforcement employees in 2010, including police officers: 493 (458 officers - 403 male; 55 female).
| Officers per 1,000 residents here: | 1.81 |
| Indiana average: | 1.80 |
Full-time law enforcement employees in 2009, including police officers: 488 (452 officers - 398 male; 54 female).
| Officers per 1,000 residents here: | 1.80 |
| Indiana average: | 1.87 |
Full-time law enforcement employees in 2008, including police officers: 485 (447 officers - 392 male; 55 female).
| Officers per 1,000 residents here: | 1.78 |
| Indiana average: | 1.86 |
Full-time law enforcement employees in 2007, including police officers: 493 (457 officers - 401 male; 56 female).
| Officers per 1,000 residents here: | 1.84 |
| Indiana average: | 1.80 |
Full-time law enforcement employees in 2006, including police officers: 456 (422 officers - 372 male; 50 female).
| Officers per 1,000 residents here: | 1.88 |
| Indiana average: | 1.83 |
Full-time law enforcement employees in 2005, including police officers: 471 (433 officers - 382 male; 51 female).
| Officers per 1,000 residents here: | 1.96 |
| Indiana average: | 1.76 |
Full-time law enforcement employees in 2004, including police officers: 446 (412 officers - 365 male; 47 female).
| Officers per 1,000 residents here: | 1.86 |
| Indiana average: | 1.80 |
Full-time law enforcement employees in 2003, including police officers: 459 (417 officers - 367 male; 50 female).
| Officers per 1,000 residents here: | 1.97 |
| Indiana average: | 1.77 |

Zip codes: 46774, 46802, 46803, 46804, 46805, 46806, 46807, 46808, 46809, 46814, 46815, 46816, 46818, 46819, 46825, 46835, 46845.