Crime rate in Portland, Oregon (OR): murders, rapes, robberies, assaults, burglaries, thefts, auto thefts, arson, law enforcement employees, police officers, crime map
Crime rate in Portland, OR
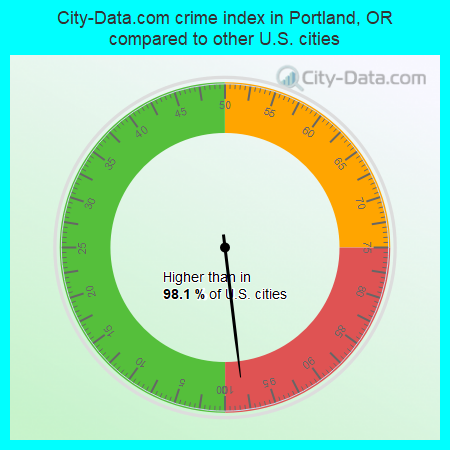
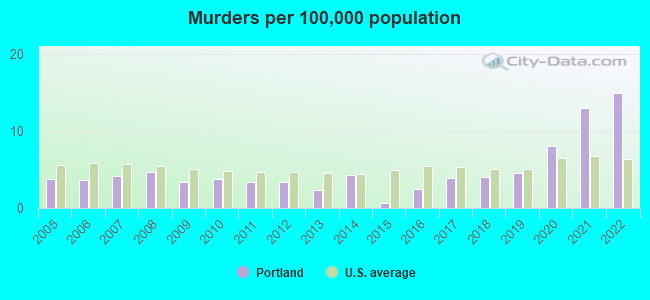
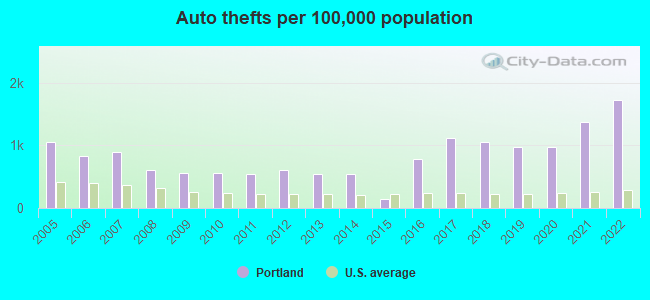
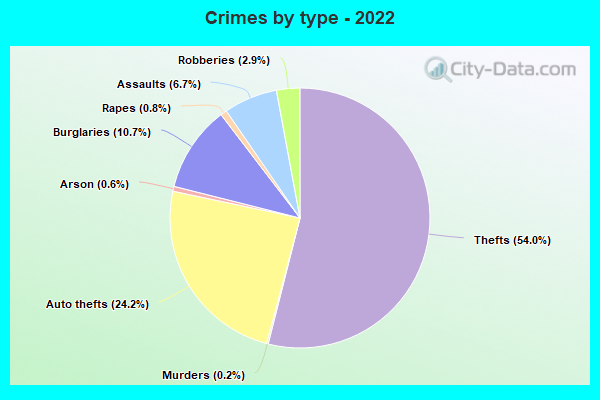
The 2022 crime rate in Portland, OR is 576 (City-Data.com crime index), which is 2.3 times higher than the U.S. average. It was higher than in 98.1% U.S. cities. The 2022 Portland crime rate rose by 11% compared to 2021. The number of homicides stood at 94 - an increase of 8 compared to 2021. In the last 5 years Portland has seen rise of violent crime and increasing property crime.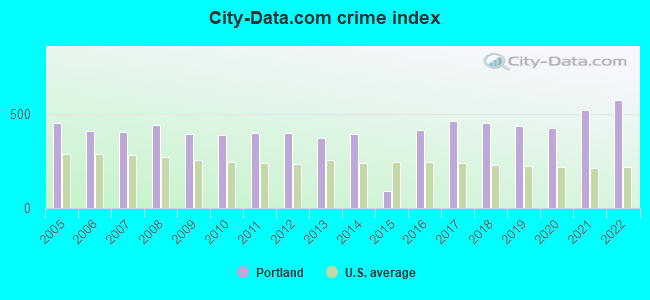
The City-Data.com crime index weighs serious crimes and violent crimes more heavily. Higher means more crime, U.S. average is 246.1. It adjusts for the number of visitors and daily workers commuting into cities.
- means the value is smaller than the state average.- means the value is about the same as the state average.
- means the value is bigger than the state average.
- means the value is much bigger than the state average.
According to our research of Oregon and other state lists, there were 374 registered sex offenders living in Portland, Oregon as of April 27, 2024.
The ratio of all residents to sex offenders in Portland is 1,710 to 1.
Violent crime rate in 2022
| Portland: | 426.0 |
| U.S. Average: | 219.8 |
Violent crime rate in 2021
| Portland: | 415.4 |
| U.S. Average: | 224.8 |
Violent crime rate in 2020
| Portland: | 318.9 |
| U.S. Average: | 228.2 |
Violent crime rate in 2019
| Portland: | 311.4 |
| U.S. Average: | 219.9 |
Violent crime rate in 2018
| Portland: | 306.1 |
| U.S. Average: | 221.2 |
Violent crime rate in 2017
| Portland: | 299.0 |
| U.S. Average: | 226.2 |
Violent crime rate in 2016
| Portland: | 285.4 |
| U.S. Average: | 227.3 |
Violent crime rate in 2015
| Portland: | 59.9 |
| U.S. Average: | 219.3 |
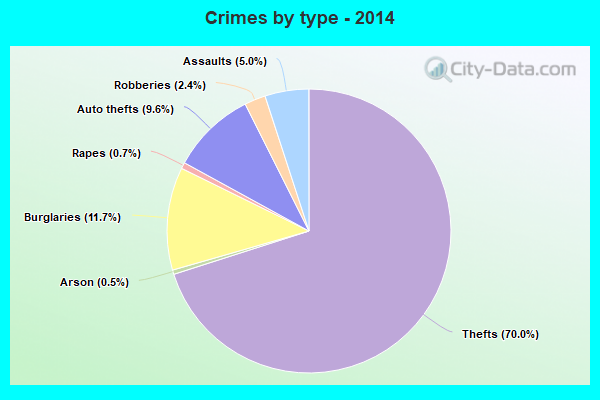
Violent crime rate in 2014
| Portland: | 264.0 |
| U.S. Average: | 211.1 |
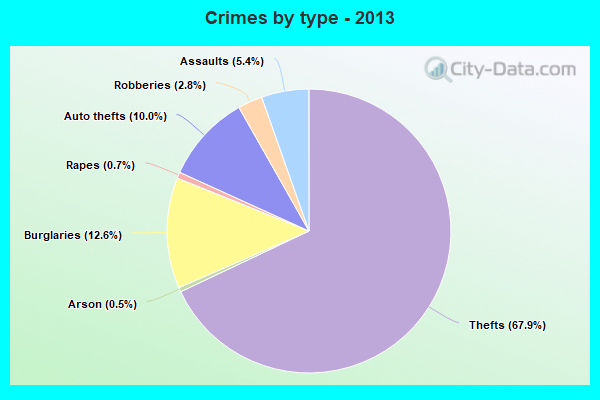
Violent crime rate in 2013
| Portland: | 264.1 |
| U.S. Average: | 214.2 |
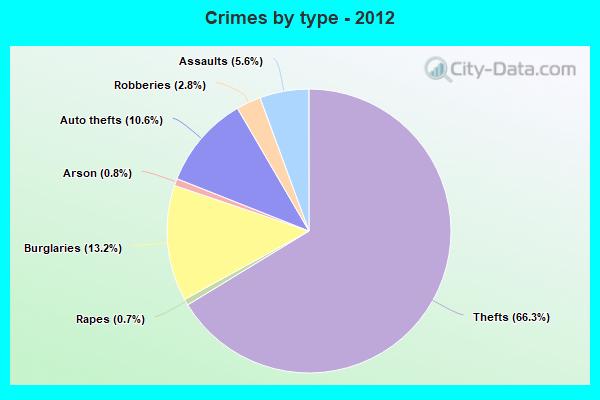
Violent crime rate in 2012
| Portland: | 282.9 |
| U.S. Average: | 187.4 |
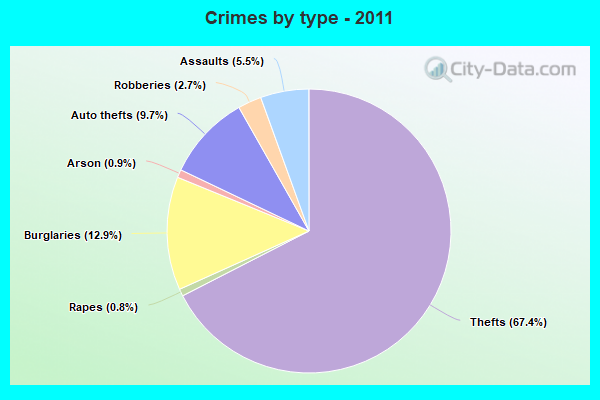
Violent crime rate in 2011
| Portland: | 284.3 |
| U.S. Average: | 187.1 |
Violent crime rate in 2010
| Portland: | 286.7 |
| U.S. Average: | 195.7 |
Violent crime rate in 2009
| Portland: | 304.3 |
| U.S. Average: | 208.9 |
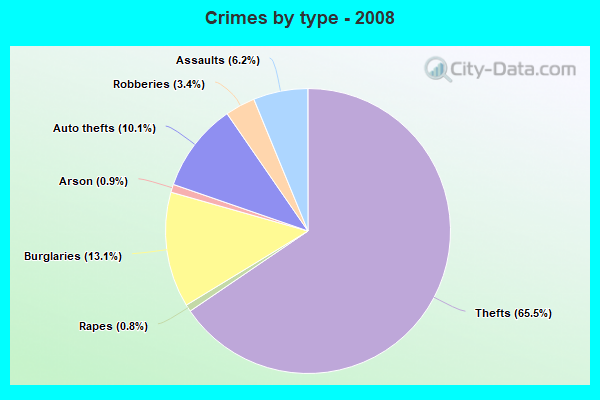
Violent crime rate in 2008
| Portland: | 341.1 |
| U.S. Average: | 222.5 |
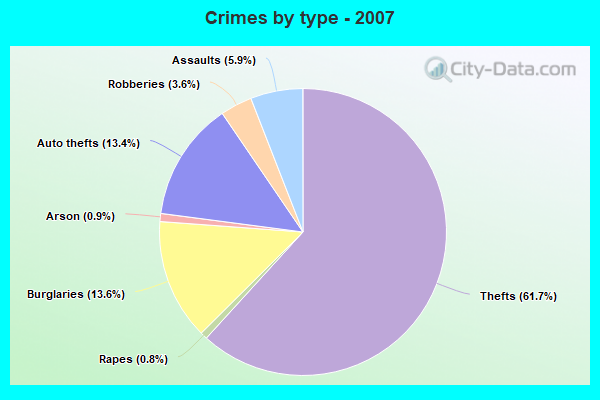
Violent crime rate in 2007
| Portland: | 304.7 |
| U.S. Average: | 229.1 |
Violent crime rate in 2006
| Portland: | 315.7 |
| U.S. Average: | 232.6 |
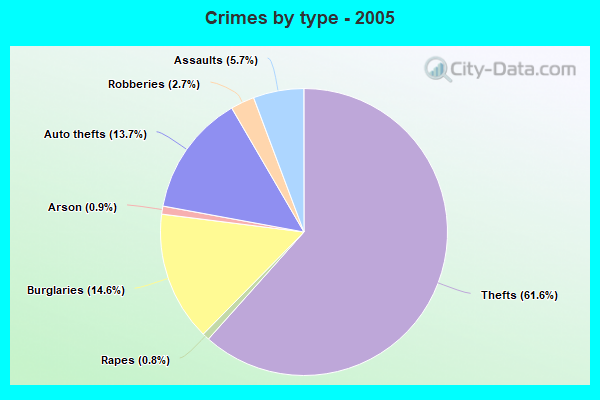
Violent crime rate in 2005
| Portland: | 318.1 |
| U.S. Average: | 227.0 |
Property crime rate in 2022
| Portland: | 602.5 |
| U.S. Average: | 166.5 |
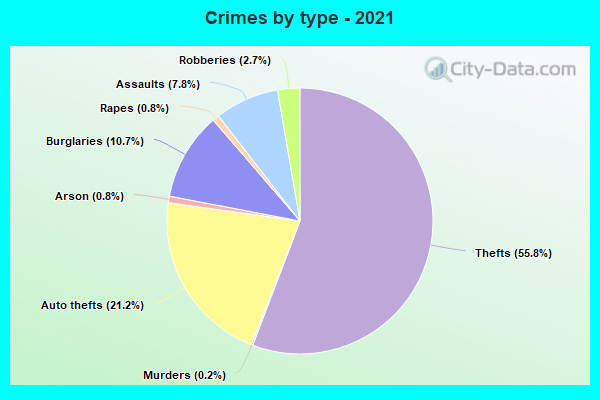
Property crime rate in 2021
| Portland: | 523.1 |
| U.S. Average: | 157.8 |
Property crime rate in 2020
| Portland: | 447.4 |
| U.S. Average: | 169.6 |
Property crime rate in 2019
| Portland: | 454.6 |
| U.S. Average: | 179.7 |
Property crime rate in 2018
| Portland: | 483.2 |
| U.S. Average: | 190.2 |
Property crime rate in 2017
| Portland: | 506.2 |
| U.S. Average: | 206.4 |
Property crime rate in 2016
| Portland: | 433.4 |
| U.S. Average: | 216.6 |
Property crime rate in 2015
| Portland: | 101.1 |
| U.S. Average: | 221.5 |
Property crime rate in 2014
| Portland: | 417.6 |
| U.S. Average: | 230.8 |
Property crime rate in 2013
| Portland: | 398.9 |
| U.S. Average: | 250.4 |
Property crime rate in 2012
| Portland: | 426.7 |
| U.S. Average: | 267.3 |
Property crime rate in 2011
| Portland: | 418.5 |
| U.S. Average: | 273.5 |
Property crime rate in 2010
| Portland: | 404.6 |
| U.S. Average: | 276.4 |
Property crime rate in 2009
| Portland: | 391.6 |
| U.S. Average: | 285.6 |
Property crime rate in 2008
| Portland: | 441.6 |
| U.S. Average: | 302.2 |
Property crime rate in 2007
| Portland: | 418.9 |
| U.S. Average: | 309.2 |
Property crime rate in 2006
| Portland: | 428.9 |
| U.S. Average: | 317.3 |
Property crime rate in 2005
| Portland: | 505.8 |
| U.S. Average: | 322.3 |

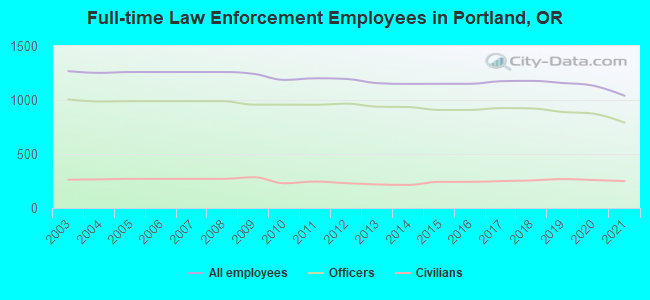
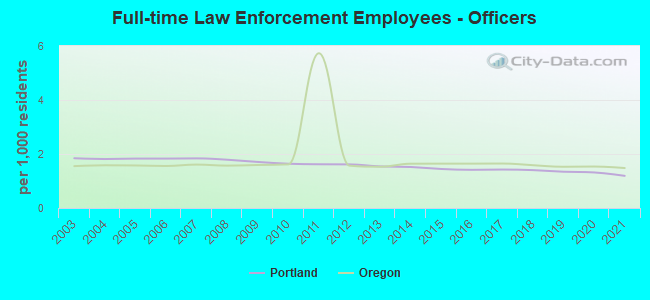
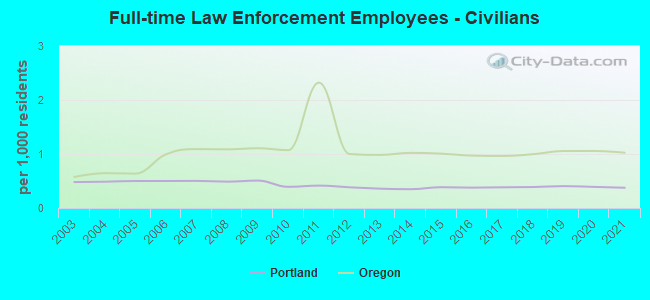
Full-time law enforcement employees in 2021, including police officers: 1,040 (791 officers - 654 male; 137 female).
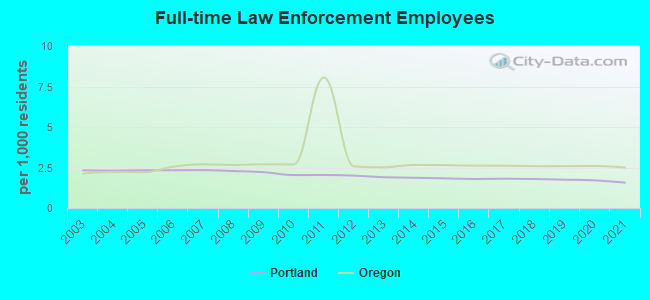
| Officers per 1,000 residents here: | 1.19 |
| Oregon average: | 1.48 |
Full-time law enforcement employees in 2020, including police officers: 1,132 (873 officers - 731 male; 142 female).
| Officers per 1,000 residents here: | 1.32 |
| Oregon average: | 1.54 |
Full-time law enforcement employees in 2019, including police officers: 1,157 (889 officers - 745 male; 144 female).
| Officers per 1,000 residents here: | 1.34 |
| Oregon average: | 1.53 |
Full-time law enforcement employees in 2018, including police officers: 1,177 (922 officers - 777 male; 145 female).
| Officers per 1,000 residents here: | 1.40 |
| Oregon average: | 1.59 |
Full-time law enforcement employees in 2017, including police officers: 1,174 (925 officers - 783 male; 142 female).
| Officers per 1,000 residents here: | 1.42 |
| Oregon average: | 1.65 |
Full-time law enforcement employees in 2016, including police officers: 1,150 (908 officers - 767 male; 141 female).
| Officers per 1,000 residents here: | 1.41 |
| Oregon average: | 1.64 |
Full-time law enforcement employees in 2015, including police officers: 1,150 (908 officers - 767 male; 141 female).
| Officers per 1,000 residents here: | 1.45 |
| Oregon average: | 1.64 |
Full-time law enforcement employees in 2014, including police officers: 1,149 (935 officers - 788 male; 147 female).
| Officers per 1,000 residents here: | 1.52 |
| Oregon average: | 1.64 |
Full-time law enforcement employees in 2013, including police officers: 1,156 (938 officers - 789 male; 149 female).
| Officers per 1,000 residents here: | 1.54 |
| Oregon average: | 1.53 |
Full-time law enforcement employees in 2012, including police officers: 1,195 (966 officers - 813 male; 153 female).
| Officers per 1,000 residents here: | 1.62 |
| Oregon average: | 1.57 |
Full-time law enforcement employees in 2011, including police officers: 1,201 (956 officers - 806 male; 150 female).
| Officers per 1,000 residents here: | 1.62 |
| Oregon average: | 5.73 |
Full-time law enforcement employees in 2010, including police officers: 1,186 (957 officers - 803 male; 154 female).
| Officers per 1,000 residents here: | 1.64 |
| Oregon average: | 1.62 |
Full-time law enforcement employees in 2009, including police officers: 1,242 (957 officers - 807 male; 150 female).
| Officers per 1,000 residents here: | 1.71 |
| Oregon average: | 1.59 |
Full-time law enforcement employees in 2008, including police officers: 1,259 (989 officers - 830 male; 159 female).
| Officers per 1,000 residents here: | 1.79 |
| Oregon average: | 1.57 |
Full-time law enforcement employees in 2007, including police officers: 1,259 (989 officers - 830 male; 159 female).
| Officers per 1,000 residents here: | 1.84 |
| Oregon average: | 1.61 |
Full-time law enforcement employees in 2005, including police officers: 1,259 (989 officers - 830 male; 159 female).
| Officers per 1,000 residents here: | 1.83 |
| Oregon average: | 1.58 |
Full-time law enforcement employees in 2004, including police officers: 1,251 (986 officers - 828 male; 158 female).
| Officers per 1,000 residents here: | 1.81 |
| Oregon average: | 1.58 |
Full-time law enforcement employees in 2003, including police officers: 1,267 (1,005 officers - 844 male; 161 female).
| Officers per 1,000 residents here: | 1.84 |
| Oregon average: | 1.55 |


Zip codes: 97201, 97203, 97204, 97205, 97208, 97209, 97210, 97211, 97212, 97213, 97214, 97215, 97216, 97217, 97218, 97221, 97227, 97232, 97239, 97266.