Please register to participate in our discussions with 2 million other members - it's free and quick! Some forums can only be seen by registered members. After you create your account, you'll be able to customize options and access all our 15,000 new posts/day with fewer ads.
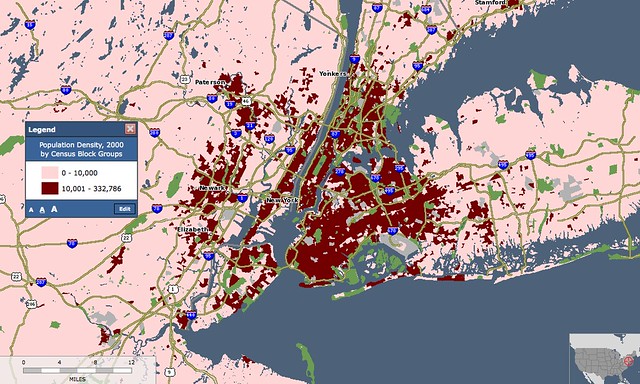
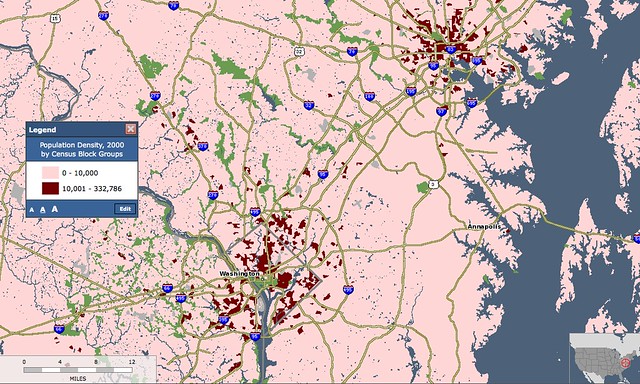
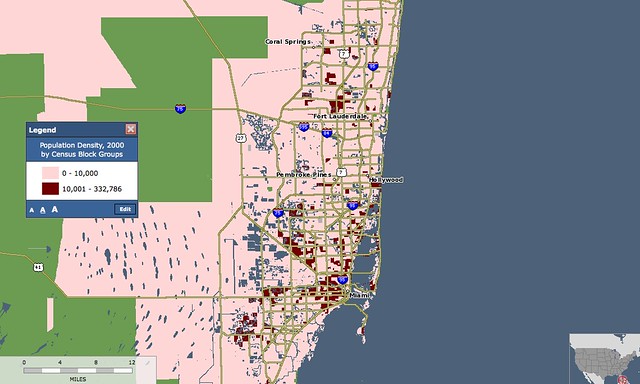
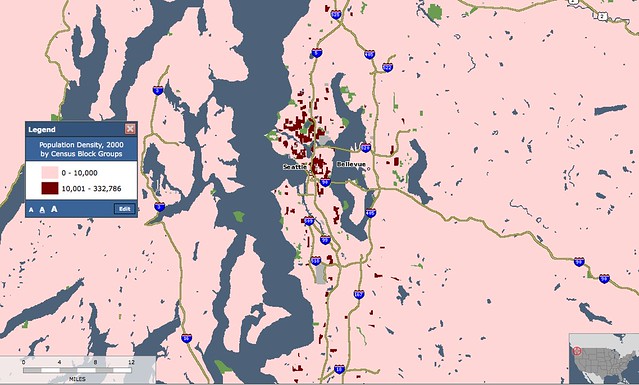
it's really a toss-up. I gave it to the one with the more overall areas of 10,000+, but in each case the other one had a larger contiguous 10,000+ with no holes.
So I went through and took the top 60 largest cities in population based on the 2000 Census (will update with 2010 numbers when they are all released) and worked out their densities based on their square miles. Then I put them all at exactly 100 square miles and came out with new figures on what the population would be and where cities would truly rank.
Based on your math, you could have saved yourself alot of trouble (and time) by just listing the cities in order of most dense to least dense. Nice try, but it takes much more math (and work) to do accurately what you've just attempted.
I do find one definite fault with this line of thinking...and it absolutely kills some of the southern cities with large municipal boundaries...
In some of these places, the density varies from the urban city center with several thousand people per square mile, to areas that are nearly rural and undeveloped with less than 500 per square mile.
I think it would be much more interesting, and accurate, to compare cities with their densest 100 square miles surrounding the city center.
Take my hometown of Nashville, for instance. Nashville takes a huge hit because of the consolidated city-county government. The land area for the city is about 470 square miles, with a population (2000) of 545,000. That gives you a density of about 1,160 per square mile. That is obviously rather low. The county includes a lot of hilly area that just aren't suited for high density development, and many parts remain undeveloped to this day.
However, the Urban Service District in Nashville covers just 169 square miles, and had a population of close to 400,000 in 2000, more than doubles the density to 2,367 per square mile. That gives you a much better idea of the density of the "city" of Nashville.
Furthermore, if you look at historical census data from 1950, Nashville had a population of 174,000 in a land area of just 22 square miles. That's a density of 7,909 per square mile...when the city and county consolidated in the 1960s, the population jumped to 448,000, but the density dropped to under 900 per square mile.
The point is, some of these southern cities have cores that are significantly more dense than the outlying city limits. So if you're going to recalculate cities to just include 100 square miles, then you should take the most relevant 100 square miles -- close to the city center -- rather than just recalculate the entire area's density to conform to a 100 square mile limit.
it's really a toss-up. I gave it to the one with the more overall areas of 10,000+, but in each case the other one had a larger contiguous 10,000+ with no holes.
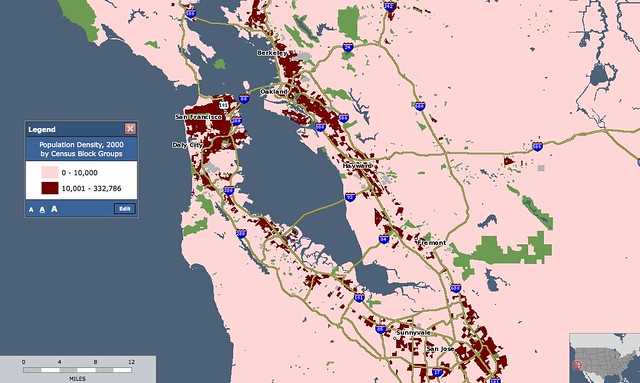
where was Boston in the images, imagine it would be very similar to SF/Philly with the images you provided
ahh... dang I knew I missed one. I'll do it later but I'm pretty sure it won't be comparable to SF/Philly because outside of the city Boston's density drops off drastically.
ahh... dang I knew I missed one. I'll do it later but I'm pretty sure it won't be comparable to SF/Philly because outside of the city Boston's density drops off drastically.
I made the maps on simplymap (my school has an account). It took all of 5 minutes. It's a great app if you have access... like a super-simplified GIS.
Please register to post and access all features of our very popular forum. It is free and quick. Over $68,000 in prizes has already been given out to active posters on our forum. Additional giveaways are planned.
Detailed information about all U.S. cities, counties, and zip codes on our site: City-data.com.

 Please register to participate in our discussions with 2 million other members - it's free and quick! Some forums can only be seen by registered members. After you create your account, you'll be able to customize options and access all our 15,000 new posts/day with fewer ads.