Beaumont, California Submit your own pictures of this city and show them to the world
OSM Map
General Map
Google Map
MSN Map
OSM Map
General Map
Google Map
MSN Map
OSM Map
General Map
Google Map
MSN Map
OSM Map
General Map
Google Map
MSN Map
Please wait while loading the map...
Population in 2022: 56,349 (99% urban, 1% rural). Population change since 2000: +395.0%Males: 27,453 Females: 28,896
March 2022 cost of living index in Beaumont: 81.4 (low, U.S. average is 100) Percentage of residents living in poverty in 2022: 7.9%for White Non-Hispanic residents , 8.5% for Black residents , 9.9% for Hispanic or Latino residents , 7.6% for American Indian residents , 8.8% for other race residents , 3.8% for two or more races residents )
Profiles of local businesses
Business Search - 14 Million verified businesses
Data:
Median household income ($)
Median household income (% change since 2000)
Household income diversity
Ratio of average income to average house value (%)
Ratio of average income to average rent
Median household income ($) - White
Median household income ($) - Black or African American
Median household income ($) - Asian
Median household income ($) - Hispanic or Latino
Median household income ($) - American Indian and Alaska Native
Median household income ($) - Multirace
Median household income ($) - Other Race
Median household income for houses/condos with a mortgage ($)
Median household income for apartments without a mortgage ($)
Races - White alone (%)
Races - White alone (% change since 2000)
Races - Black alone (%)
Races - Black alone (% change since 2000)
Races - American Indian alone (%)
Races - American Indian alone (% change since 2000)
Races - Asian alone (%)
Races - Asian alone (% change since 2000)
Races - Hispanic (%)
Races - Hispanic (% change since 2000)
Races - Native Hawaiian and Other Pacific Islander alone (%)
Races - Native Hawaiian and Other Pacific Islander alone (% change since 2000)
Races - Two or more races (%)
Races - Two or more races (% change since 2000)
Races - Other race alone (%)
Races - Other race alone (% change since 2000)
Racial diversity
Unemployment (%)
Unemployment (% change since 2000)
Unemployment (%) - White
Unemployment (%) - Black or African American
Unemployment (%) - Asian
Unemployment (%) - Hispanic or Latino
Unemployment (%) - American Indian and Alaska Native
Unemployment (%) - Multirace
Unemployment (%) - Other Race
Population density (people per square mile)
Population - Males (%)
Population - Females (%)
Population - Males (%) - White
Population - Males (%) - Black or African American
Population - Males (%) - Asian
Population - Males (%) - Hispanic or Latino
Population - Males (%) - American Indian and Alaska Native
Population - Males (%) - Multirace
Population - Males (%) - Other Race
Population - Females (%) - White
Population - Females (%) - Black or African American
Population - Females (%) - Asian
Population - Females (%) - Hispanic or Latino
Population - Females (%) - American Indian and Alaska Native
Population - Females (%) - Multirace
Population - Females (%) - Other Race
Coronavirus confirmed cases (Apr 30, 2024)
Deaths caused by coronavirus (Apr 30, 2024)
Coronavirus confirmed cases (per 100k population) (Apr 30, 2024)
Deaths caused by coronavirus (per 100k population) (Apr 30, 2024)
Daily increase in number of cases (Apr 30, 2024)
Weekly increase in number of cases (Apr 30, 2024)
Cases doubled (in days) (Apr 30, 2024)
Hospitalized patients (Apr 18, 2022)
Negative test results (Apr 18, 2022)
Total test results (Apr 18, 2022)
COVID Vaccine doses distributed (per 100k population) (Sep 19, 2023)
COVID Vaccine doses administered (per 100k population) (Sep 19, 2023)
COVID Vaccine doses distributed (Sep 19, 2023)
COVID Vaccine doses administered (Sep 19, 2023)
Likely homosexual households (%)
Likely homosexual households (% change since 2000)
Likely homosexual households - Lesbian couples (%)
Likely homosexual households - Lesbian couples (% change since 2000)
Likely homosexual households - Gay men (%)
Likely homosexual households - Gay men (% change since 2000)
Cost of living index
Median gross rent ($)
Median contract rent ($)
Median monthly housing costs ($)
Median house or condo value ($)
Median house or condo value ($ change since 2000)
Mean house or condo value by units in structure - 1, detached ($)
Mean house or condo value by units in structure - 1, attached ($)
Mean house or condo value by units in structure - 2 ($)
Mean house or condo value by units in structure by units in structure - 3 or 4 ($)
Mean house or condo value by units in structure - 5 or more ($)
Mean house or condo value by units in structure - Boat, RV, van, etc. ($)
Mean house or condo value by units in structure - Mobile home ($)
Median house or condo value ($) - White
Median house or condo value ($) - Black or African American
Median house or condo value ($) - Asian
Median house or condo value ($) - Hispanic or Latino
Median house or condo value ($) - American Indian and Alaska Native
Median house or condo value ($) - Multirace
Median house or condo value ($) - Other Race
Median resident age
Resident age diversity
Median resident age - Males
Median resident age - Females
Median resident age - White
Median resident age - Black or African American
Median resident age - Asian
Median resident age - Hispanic or Latino
Median resident age - American Indian and Alaska Native
Median resident age - Multirace
Median resident age - Other Race
Median resident age - Males - White
Median resident age - Males - Black or African American
Median resident age - Males - Asian
Median resident age - Males - Hispanic or Latino
Median resident age - Males - American Indian and Alaska Native
Median resident age - Males - Multirace
Median resident age - Males - Other Race
Median resident age - Females - White
Median resident age - Females - Black or African American
Median resident age - Females - Asian
Median resident age - Females - Hispanic or Latino
Median resident age - Females - American Indian and Alaska Native
Median resident age - Females - Multirace
Median resident age - Females - Other Race
Commute - mean travel time to work (minutes)
Travel time to work - Less than 5 minutes (%)
Travel time to work - Less than 5 minutes (% change since 2000)
Travel time to work - 5 to 9 minutes (%)
Travel time to work - 5 to 9 minutes (% change since 2000)
Travel time to work - 10 to 19 minutes (%)
Travel time to work - 10 to 19 minutes (% change since 2000)
Travel time to work - 20 to 29 minutes (%)
Travel time to work - 20 to 29 minutes (% change since 2000)
Travel time to work - 30 to 39 minutes (%)
Travel time to work - 30 to 39 minutes (% change since 2000)
Travel time to work - 40 to 59 minutes (%)
Travel time to work - 40 to 59 minutes (% change since 2000)
Travel time to work - 60 to 89 minutes (%)
Travel time to work - 60 to 89 minutes (% change since 2000)
Travel time to work - 90 or more minutes (%)
Travel time to work - 90 or more minutes (% change since 2000)
Marital status - Never married (%)
Marital status - Now married (%)
Marital status - Separated (%)
Marital status - Widowed (%)
Marital status - Divorced (%)
Median family income ($)
Median family income (% change since 2000)
Median non-family income ($)
Median non-family income (% change since 2000)
Median per capita income ($)
Median per capita income (% change since 2000)
Median family income ($) - White
Median family income ($) - Black or African American
Median family income ($) - Asian
Median family income ($) - Hispanic or Latino
Median family income ($) - American Indian and Alaska Native
Median family income ($) - Multirace
Median family income ($) - Other Race
Median year house/condo built
Median year apartment built
Year house built - Built 2005 or later (%)
Year house built - Built 2000 to 2004 (%)
Year house built - Built 1990 to 1999 (%)
Year house built - Built 1980 to 1989 (%)
Year house built - Built 1970 to 1979 (%)
Year house built - Built 1960 to 1969 (%)
Year house built - Built 1950 to 1959 (%)
Year house built - Built 1940 to 1949 (%)
Year house built - Built 1939 or earlier (%)
Average household size
Household density (households per square mile)
Average household size - White
Average household size - Black or African American
Average household size - Asian
Average household size - Hispanic or Latino
Average household size - American Indian and Alaska Native
Average household size - Multirace
Average household size - Other Race
Occupied housing units (%)
Vacant housing units (%)
Owner occupied housing units (%)
Renter occupied housing units (%)
Vacancy status - For rent (%)
Vacancy status - For sale only (%)
Vacancy status - Rented or sold, not occupied (%)
Vacancy status - For seasonal, recreational, or occasional use (%)
Vacancy status - For migrant workers (%)
Vacancy status - Other vacant (%)
Residents with income below the poverty level (%)
Residents with income below 50% of the poverty level (%)
Children below poverty level (%)
Poor families by family type - Married-couple family (%)
Poor families by family type - Male, no wife present (%)
Poor families by family type - Female, no husband present (%)
Poverty status for native-born residents (%)
Poverty status for foreign-born residents (%)
Poverty among high school graduates not in families (%)
Poverty among people who did not graduate high school not in families (%)
Residents with income below the poverty level (%) - White
Residents with income below the poverty level (%) - Black or African American
Residents with income below the poverty level (%) - Asian
Residents with income below the poverty level (%) - Hispanic or Latino
Residents with income below the poverty level (%) - American Indian and Alaska Native
Residents with income below the poverty level (%) - Multirace
Residents with income below the poverty level (%) - Other Race
Air pollution - Air Quality Index (AQI)
Air pollution - CO
Air pollution - NO2
Air pollution - SO2
Air pollution - Ozone
Air pollution - PM10
Air pollution - PM25
Air pollution - Pb
Crime - Murders per 100,000 population
Crime - Rapes per 100,000 population
Crime - Robberies per 100,000 population
Crime - Assaults per 100,000 population
Crime - Burglaries per 100,000 population
Crime - Thefts per 100,000 population
Crime - Auto thefts per 100,000 population
Crime - Arson per 100,000 population
Crime - City-data.com crime index
Crime - Violent crime index
Crime - Property crime index
Crime - Murders per 100,000 population (5 year average)
Crime - Rapes per 100,000 population (5 year average)
Crime - Robberies per 100,000 population (5 year average)
Crime - Assaults per 100,000 population (5 year average)
Crime - Burglaries per 100,000 population (5 year average)
Crime - Thefts per 100,000 population (5 year average)
Crime - Auto thefts per 100,000 population (5 year average)
Crime - Arson per 100,000 population (5 year average)
Crime - City-data.com crime index (5 year average)
Crime - Violent crime index (5 year average)
Crime - Property crime index (5 year average)
1996 Presidential Elections Results (%) - Democratic Party (Clinton)
1996 Presidential Elections Results (%) - Republican Party (Dole)
1996 Presidential Elections Results (%) - Other
2000 Presidential Elections Results (%) - Democratic Party (Gore)
2000 Presidential Elections Results (%) - Republican Party (Bush)
2000 Presidential Elections Results (%) - Other
2004 Presidential Elections Results (%) - Democratic Party (Kerry)
2004 Presidential Elections Results (%) - Republican Party (Bush)
2004 Presidential Elections Results (%) - Other
2008 Presidential Elections Results (%) - Democratic Party (Obama)
2008 Presidential Elections Results (%) - Republican Party (McCain)
2008 Presidential Elections Results (%) - Other
2012 Presidential Elections Results (%) - Democratic Party (Obama)
2012 Presidential Elections Results (%) - Republican Party (Romney)
2012 Presidential Elections Results (%) - Other
2016 Presidential Elections Results (%) - Democratic Party (Clinton)
2016 Presidential Elections Results (%) - Republican Party (Trump)
2016 Presidential Elections Results (%) - Other
2020 Presidential Elections Results (%) - Democratic Party (Biden)
2020 Presidential Elections Results (%) - Republican Party (Trump)
2020 Presidential Elections Results (%) - Other
Ancestries Reported - Arab (%)
Ancestries Reported - Czech (%)
Ancestries Reported - Danish (%)
Ancestries Reported - Dutch (%)
Ancestries Reported - English (%)
Ancestries Reported - French (%)
Ancestries Reported - French Canadian (%)
Ancestries Reported - German (%)
Ancestries Reported - Greek (%)
Ancestries Reported - Hungarian (%)
Ancestries Reported - Irish (%)
Ancestries Reported - Italian (%)
Ancestries Reported - Lithuanian (%)
Ancestries Reported - Norwegian (%)
Ancestries Reported - Polish (%)
Ancestries Reported - Portuguese (%)
Ancestries Reported - Russian (%)
Ancestries Reported - Scotch-Irish (%)
Ancestries Reported - Scottish (%)
Ancestries Reported - Slovak (%)
Ancestries Reported - Subsaharan African (%)
Ancestries Reported - Swedish (%)
Ancestries Reported - Swiss (%)
Ancestries Reported - Ukrainian (%)
Ancestries Reported - United States (%)
Ancestries Reported - Welsh (%)
Ancestries Reported - West Indian (%)
Ancestries Reported - Other (%)
Educational Attainment - No schooling completed (%)
Educational Attainment - Less than high school (%)
Educational Attainment - High school or equivalent (%)
Educational Attainment - Less than 1 year of college (%)
Educational Attainment - 1 or more years of college (%)
Educational Attainment - Associate degree (%)
Educational Attainment - Bachelor's degree (%)
Educational Attainment - Master's degree (%)
Educational Attainment - Professional school degree (%)
Educational Attainment - Doctorate degree (%)
School Enrollment - Nursery, preschool (%)
School Enrollment - Kindergarten (%)
School Enrollment - Grade 1 to 4 (%)
School Enrollment - Grade 5 to 8 (%)
School Enrollment - Grade 9 to 12 (%)
School Enrollment - College undergrad (%)
School Enrollment - Graduate or professional (%)
School Enrollment - Not enrolled in school (%)
School enrollment - Public schools (%)
School enrollment - Private schools (%)
School enrollment - Not enrolled (%)
Median number of rooms in houses and condos
Median number of rooms in apartments
Housing units lacking complete plumbing facilities (%)
Housing units lacking complete kitchen facilities (%)
Density of houses
Urban houses (%)
Rural houses (%)
Households with people 60 years and over (%)
Households with people 65 years and over (%)
Households with people 75 years and over (%)
Households with one or more nonrelatives (%)
Households with no nonrelatives (%)
Population in households (%)
Family households (%)
Nonfamily households (%)
Population in families (%)
Family households with own children (%)
Median number of bedrooms in owner occupied houses
Mean number of bedrooms in owner occupied houses
Median number of bedrooms in renter occupied houses
Mean number of bedrooms in renter occupied houses
Median number of vehichles in owner occupied houses
Mean number of vehichles in owner occupied houses
Median number of vehichles in renter occupied houses
Mean number of vehichles in renter occupied houses
Mortgage status - with mortgage (%)
Mortgage status - with second mortgage (%)
Mortgage status - with home equity loan (%)
Mortgage status - with both second mortgage and home equity loan (%)
Mortgage status - without a mortgage (%)
Average family size
Average family size - White
Average family size - Black or African American
Average family size - Asian
Average family size - Hispanic or Latino
Average family size - American Indian and Alaska Native
Average family size - Multirace
Average family size - Other Race
Geographical mobility - Same house 1 year ago (%)
Geographical mobility - Moved within same county (%)
Geographical mobility - Moved from different county within same state (%)
Geographical mobility - Moved from different state (%)
Geographical mobility - Moved from abroad (%)
Place of birth - Born in state of residence (%)
Place of birth - Born in other state (%)
Place of birth - Native, outside of US (%)
Place of birth - Foreign born (%)
Housing units in structures - 1, detached (%)
Housing units in structures - 1, attached (%)
Housing units in structures - 2 (%)
Housing units in structures - 3 or 4 (%)
Housing units in structures - 5 to 9 (%)
Housing units in structures - 10 to 19 (%)
Housing units in structures - 20 to 49 (%)
Housing units in structures - 50 or more (%)
Housing units in structures - Mobile home (%)
Housing units in structures - Boat, RV, van, etc. (%)
House/condo owner moved in on average (years ago)
Renter moved in on average (years ago)
Year householder moved into unit - Moved in 1999 to March 2000 (%)
Year householder moved into unit - Moved in 1995 to 1998 (%)
Year householder moved into unit - Moved in 1990 to 1994 (%)
Year householder moved into unit - Moved in 1980 to 1989 (%)
Year householder moved into unit - Moved in 1970 to 1979 (%)
Year householder moved into unit - Moved in 1969 or earlier (%)
Means of transportation to work - Drove car alone (%)
Means of transportation to work - Carpooled (%)
Means of transportation to work - Public transportation (%)
Means of transportation to work - Bus or trolley bus (%)
Means of transportation to work - Streetcar or trolley car (%)
Means of transportation to work - Subway or elevated (%)
Means of transportation to work - Railroad (%)
Means of transportation to work - Ferryboat (%)
Means of transportation to work - Taxicab (%)
Means of transportation to work - Motorcycle (%)
Means of transportation to work - Bicycle (%)
Means of transportation to work - Walked (%)
Means of transportation to work - Other means (%)
Working at home (%)
Industry diversity
Most Common Industries - Agriculture, forestry, fishing and hunting, and mining (%)
Most Common Industries - Agriculture, forestry, fishing and hunting (%)
Most Common Industries - Mining, quarrying, and oil and gas extraction (%)
Most Common Industries - Construction (%)
Most Common Industries - Manufacturing (%)
Most Common Industries - Wholesale trade (%)
Most Common Industries - Retail trade (%)
Most Common Industries - Transportation and warehousing, and utilities (%)
Most Common Industries - Transportation and warehousing (%)
Most Common Industries - Utilities (%)
Most Common Industries - Information (%)
Most Common Industries - Finance and insurance, and real estate and rental and leasing (%)
Most Common Industries - Finance and insurance (%)
Most Common Industries - Real estate and rental and leasing (%)
Most Common Industries - Professional, scientific, and management, and administrative and waste management services (%)
Most Common Industries - Professional, scientific, and technical services (%)
Most Common Industries - Management of companies and enterprises (%)
Most Common Industries - Administrative and support and waste management services (%)
Most Common Industries - Educational services, and health care and social assistance (%)
Most Common Industries - Educational services (%)
Most Common Industries - Health care and social assistance (%)
Most Common Industries - Arts, entertainment, and recreation, and accommodation and food services (%)
Most Common Industries - Arts, entertainment, and recreation (%)
Most Common Industries - Accommodation and food services (%)
Most Common Industries - Other services, except public administration (%)
Most Common Industries - Public administration (%)
Occupation diversity
Most Common Occupations - Management, business, science, and arts occupations (%)
Most Common Occupations - Management, business, and financial occupations (%)
Most Common Occupations - Management occupations (%)
Most Common Occupations - Business and financial operations occupations (%)
Most Common Occupations - Computer, engineering, and science occupations (%)
Most Common Occupations - Computer and mathematical occupations (%)
Most Common Occupations - Architecture and engineering occupations (%)
Most Common Occupations - Life, physical, and social science occupations (%)
Most Common Occupations - Education, legal, community service, arts, and media occupations (%)
Most Common Occupations - Community and social service occupations (%)
Most Common Occupations - Legal occupations (%)
Most Common Occupations - Education, training, and library occupations (%)
Most Common Occupations - Arts, design, entertainment, sports, and media occupations (%)
Most Common Occupations - Healthcare practitioners and technical occupations (%)
Most Common Occupations - Health diagnosing and treating practitioners and other technical occupations (%)
Most Common Occupations - Health technologists and technicians (%)
Most Common Occupations - Service occupations (%)
Most Common Occupations - Healthcare support occupations (%)
Most Common Occupations - Protective service occupations (%)
Most Common Occupations - Fire fighting and prevention, and other protective service workers including supervisors (%)
Most Common Occupations - Law enforcement workers including supervisors (%)
Most Common Occupations - Food preparation and serving related occupations (%)
Most Common Occupations - Building and grounds cleaning and maintenance occupations (%)
Most Common Occupations - Personal care and service occupations (%)
Most Common Occupations - Sales and office occupations (%)
Most Common Occupations - Sales and related occupations (%)
Most Common Occupations - Office and administrative support occupations (%)
Most Common Occupations - Natural resources, construction, and maintenance occupations (%)
Most Common Occupations - Farming, fishing, and forestry occupations (%)
Most Common Occupations - Construction and extraction occupations (%)
Most Common Occupations - Installation, maintenance, and repair occupations (%)
Most Common Occupations - Production, transportation, and material moving occupations (%)
Most Common Occupations - Production occupations (%)
Most Common Occupations - Transportation occupations (%)
Most Common Occupations - Material moving occupations (%)
People in Group quarters - Institutionalized population (%)
People in Group quarters - Correctional institutions (%)
People in Group quarters - Federal prisons and detention centers (%)
People in Group quarters - Halfway houses (%)
People in Group quarters - Local jails and other confinement facilities (including police lockups) (%)
People in Group quarters - Military disciplinary barracks (%)
People in Group quarters - State prisons (%)
People in Group quarters - Other types of correctional institutions (%)
People in Group quarters - Nursing homes (%)
People in Group quarters - Hospitals/wards, hospices, and schools for the handicapped (%)
People in Group quarters - Hospitals/wards and hospices for chronically ill (%)
People in Group quarters - Hospices or homes for chronically ill (%)
People in Group quarters - Military hospitals or wards for chronically ill (%)
People in Group quarters - Other hospitals or wards for chronically ill (%)
People in Group quarters - Hospitals or wards for drug/alcohol abuse (%)
People in Group quarters - Mental (Psychiatric) hospitals or wards (%)
People in Group quarters - Schools, hospitals, or wards for the mentally retarded (%)
People in Group quarters - Schools, hospitals, or wards for the physically handicapped (%)
People in Group quarters - Institutions for the deaf (%)
People in Group quarters - Institutions for the blind (%)
People in Group quarters - Orthopedic wards and institutions for the physically handicapped (%)
People in Group quarters - Wards in general hospitals for patients who have no usual home elsewhere (%)
People in Group quarters - Wards in military hospitals for patients who have no usual home elsewhere (%)
People in Group quarters - Juvenile institutions (%)
People in Group quarters - Long-term care (%)
People in Group quarters - Homes for abused, dependent, and neglected children (%)
People in Group quarters - Residential treatment centers for emotionally disturbed children (%)
People in Group quarters - Training schools for juvenile delinquents (%)
People in Group quarters - Short-term care, detention or diagnostic centers for delinquent children (%)
People in Group quarters - Type of juvenile institution unknown (%)
People in Group quarters - Noninstitutionalized population (%)
People in Group quarters - College dormitories (includes college quarters off campus) (%)
People in Group quarters - Military quarters (%)
People in Group quarters - On base (%)
People in Group quarters - Barracks, unaccompanied personnel housing (UPH), (Enlisted/Officer), ;and similar group living quarters for military personnel (%)
People in Group quarters - Transient quarters for temporary residents (%)
People in Group quarters - Military ships (%)
People in Group quarters - Group homes (%)
People in Group quarters - Homes or halfway houses for drug/alcohol abuse (%)
People in Group quarters - Homes for the mentally ill (%)
People in Group quarters - Homes for the mentally retarded (%)
People in Group quarters - Homes for the physically handicapped (%)
People in Group quarters - Other group homes (%)
People in Group quarters - Religious group quarters (%)
People in Group quarters - Dormitories (%)
People in Group quarters - Agriculture workers' dormitories on farms (%)
People in Group quarters - Job Corps and vocational training facilities (%)
People in Group quarters - Other workers' dormitories (%)
People in Group quarters - Crews of maritime vessels (%)
People in Group quarters - Other nonhousehold living situations (%)
People in Group quarters - Other noninstitutional group quarters (%)
Residents speaking English at home (%)
Residents speaking English at home - Born in the United States (%)
Residents speaking English at home - Native, born elsewhere (%)
Residents speaking English at home - Foreign born (%)
Residents speaking Spanish at home (%)
Residents speaking Spanish at home - Born in the United States (%)
Residents speaking Spanish at home - Native, born elsewhere (%)
Residents speaking Spanish at home - Foreign born (%)
Residents speaking other language at home (%)
Residents speaking other language at home - Born in the United States (%)
Residents speaking other language at home - Native, born elsewhere (%)
Residents speaking other language at home - Foreign born (%)
Class of Workers - Employee of private company (%)
Class of Workers - Self-employed in own incorporated business (%)
Class of Workers - Private not-for-profit wage and salary workers (%)
Class of Workers - Local government workers (%)
Class of Workers - State government workers (%)
Class of Workers - Federal government workers (%)
Class of Workers - Self-employed workers in own not incorporated business and Unpaid family workers (%)
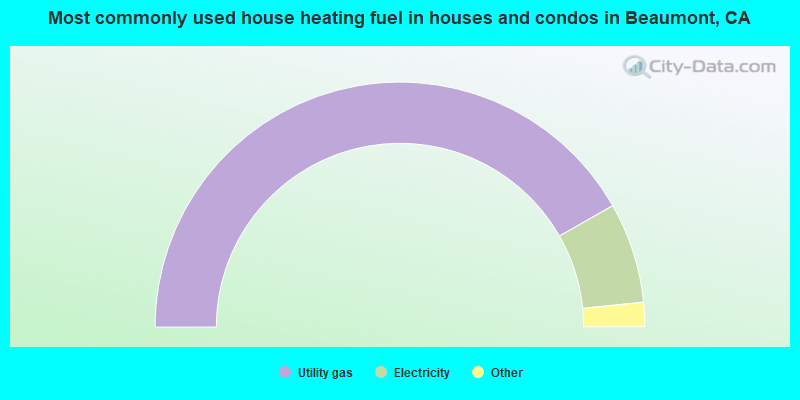
House heating fuel used in houses and condos - Utility gas (%)
House heating fuel used in houses and condos - Bottled, tank, or LP gas (%)
House heating fuel used in houses and condos - Electricity (%)
House heating fuel used in houses and condos - Fuel oil, kerosene, etc. (%)
House heating fuel used in houses and condos - Coal or coke (%)
House heating fuel used in houses and condos - Wood (%)
House heating fuel used in houses and condos - Solar energy (%)
House heating fuel used in houses and condos - Other fuel (%)
House heating fuel used in houses and condos - No fuel used (%)
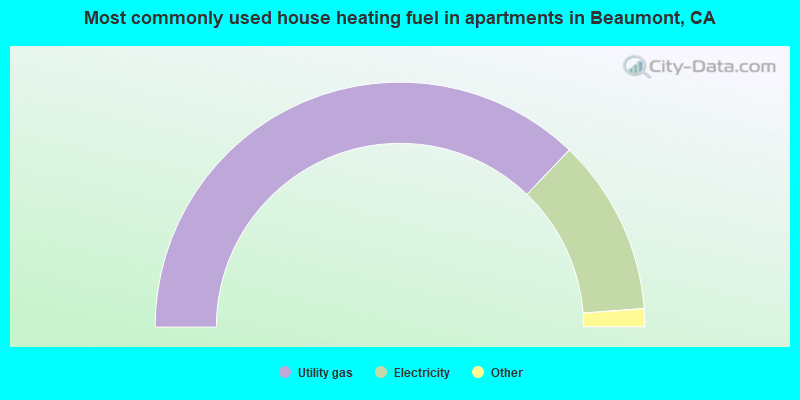
House heating fuel used in apartments - Utility gas (%)
House heating fuel used in apartments - Bottled, tank, or LP gas (%)
House heating fuel used in apartments - Electricity (%)
House heating fuel used in apartments - Fuel oil, kerosene, etc. (%)
House heating fuel used in apartments - Coal or coke (%)
House heating fuel used in apartments - Wood (%)
House heating fuel used in apartments - Solar energy (%)
House heating fuel used in apartments - Other fuel (%)
House heating fuel used in apartments - No fuel used (%)
Armed forces status - In Armed Forces (%)
Armed forces status - Civilian (%)
Armed forces status - Civilian - Veteran (%)
Armed forces status - Civilian - Nonveteran (%)
Fatal accidents locations in years 2005-2021
Fatal accidents locations in 2005
Fatal accidents locations in 2006
Fatal accidents locations in 2007
Fatal accidents locations in 2008
Fatal accidents locations in 2009
Fatal accidents locations in 2010
Fatal accidents locations in 2011
Fatal accidents locations in 2012
Fatal accidents locations in 2013
Fatal accidents locations in 2014
Fatal accidents locations in 2015
Fatal accidents locations in 2016
Fatal accidents locations in 2017
Fatal accidents locations in 2018
Fatal accidents locations in 2019
Fatal accidents locations in 2020
Fatal accidents locations in 2021
Alcohol use - People drinking some alcohol every month (%)
Alcohol use - People not drinking at all (%)
Alcohol use - Average days/month drinking alcohol
Alcohol use - Average drinks/week
Alcohol use - Average days/year people drink much
Audiometry - Average condition of hearing (%)
Audiometry - People that can hear a whisper from across a quiet room (%)
Audiometry - People that can hear normal voice from across a quiet room (%)
Audiometry - Ears ringing, roaring, buzzing (%)
Audiometry - Had a job exposure to loud noise (%)
Audiometry - Had off-work exposure to loud noise (%)
Blood Pressure & Cholesterol - Has high blood pressure (%)
Blood Pressure & Cholesterol - Checking blood pressure at home (%)
Blood Pressure & Cholesterol - Frequently checking blood cholesterol (%)
Blood Pressure & Cholesterol - Has high cholesterol level (%)
Consumer Behavior - Money monthly spent on food at supermarket/grocery store
Consumer Behavior - Money monthly spent on food at other stores
Consumer Behavior - Money monthly spent on eating out
Consumer Behavior - Money monthly spent on carryout/delivered foods
Consumer Behavior - Income spent on food at supermarket/grocery store (%)
Consumer Behavior - Income spent on food at other stores (%)
Consumer Behavior - Income spent on eating out (%)
Consumer Behavior - Income spent on carryout/delivered foods (%)
Current Health Status - General health condition (%)
Current Health Status - Blood donors (%)
Current Health Status - Has blood ever tested for HIV virus (%)
Current Health Status - Left-handed people (%)
Dermatology - People using sunscreen (%)
Diabetes - Diabetics (%)
Diabetes - Had a blood test for high blood sugar (%)
Diabetes - People taking insulin (%)
Diet Behavior & Nutrition - Diet health (%)
Diet Behavior & Nutrition - Milk product consumption (# of products/month)
Diet Behavior & Nutrition - Meals not home prepared (#/week)
Diet Behavior & Nutrition - Meals from fast food or pizza place (#/week)
Diet Behavior & Nutrition - Ready-to-eat foods (#/month)
Diet Behavior & Nutrition - Frozen meals/pizza (#/month)
Drug Use - People that ever used marijuana or hashish (%)
Drug Use - Ever used hard drugs (%)
Drug Use - Ever used any form of cocaine (%)
Drug Use - Ever used heroin (%)
Drug Use - Ever used methamphetamine (%)
Health Insurance - People covered by health insurance (%)
Kidney Conditions-Urology - Avg. # of times urinating at night
Medical Conditions - People with asthma (%)
Medical Conditions - People with anemia (%)
Medical Conditions - People with psoriasis (%)
Medical Conditions - People with overweight (%)
Medical Conditions - Elderly people having difficulties in thinking or remembering (%)
Medical Conditions - People who ever received blood transfusion (%)
Medical Conditions - People having trouble seeing even with glass/contacts (%)
Medical Conditions - People with arthritis (%)
Medical Conditions - People with gout (%)
Medical Conditions - People with congestive heart failure (%)
Medical Conditions - People with coronary heart disease (%)
Medical Conditions - People with angina pectoris (%)
Medical Conditions - People who ever had heart attack (%)
Medical Conditions - People who ever had stroke (%)
Medical Conditions - People with emphysema (%)
Medical Conditions - People with thyroid problem (%)
Medical Conditions - People with chronic bronchitis (%)
Medical Conditions - People with any liver condition (%)
Medical Conditions - People who ever had cancer or malignancy (%)
Mental Health - People who have little interest in doing things (%)
Mental Health - People feeling down, depressed, or hopeless (%)
Mental Health - People who have trouble sleeping or sleeping too much (%)
Mental Health - People feeling tired or having little energy (%)
Mental Health - People with poor appetite or overeating (%)
Mental Health - People feeling bad about themself (%)
Mental Health - People who have trouble concentrating on things (%)
Mental Health - People moving or speaking slowly or too fast (%)
Mental Health - People having thoughts they would be better off dead (%)
Oral Health - Average years since last visit a dentist
Oral Health - People embarrassed because of mouth (%)
Oral Health - People with gum disease (%)
Oral Health - General health of teeth and gums (%)
Oral Health - Average days a week using dental floss/device
Oral Health - Average days a week using mouthwash for dental problem
Oral Health - Average number of teeth
Pesticide Use - Households using pesticides to control insects (%)
Pesticide Use - Households using pesticides to kill weeds (%)
Physical Activity - People doing vigorous-intensity work activities (%)
Physical Activity - People doing moderate-intensity work activities (%)
Physical Activity - People walking or bicycling (%)
Physical Activity - People doing vigorous-intensity recreational activities (%)
Physical Activity - People doing moderate-intensity recreational activities (%)
Physical Activity - Average hours a day doing sedentary activities
Physical Activity - Average hours a day watching TV or videos
Physical Activity - Average hours a day using computer
Physical Functioning - People having limitations keeping them from working (%)
Physical Functioning - People limited in amount of work they can do (%)
Physical Functioning - People that need special equipment to walk (%)
Physical Functioning - People experiencing confusion/memory problems (%)
Physical Functioning - People requiring special healthcare equipment (%)
Prescription Medications - Average number of prescription medicines taking
Preventive Aspirin Use - Adults 40+ taking low-dose aspirin (%)
Reproductive Health - Vaginal deliveries (%)
Reproductive Health - Cesarean deliveries (%)
Reproductive Health - Deliveries resulted in a live birth (%)
Reproductive Health - Pregnancies resulted in a delivery (%)
Reproductive Health - Women breastfeeding newborns (%)
Reproductive Health - Women that had a hysterectomy (%)
Reproductive Health - Women that had both ovaries removed (%)
Reproductive Health - Women that have ever taken birth control pills (%)
Reproductive Health - Women taking birth control pills (%)
Reproductive Health - Women that have ever used Depo-Provera or injectables (%)
Reproductive Health - Women that have ever used female hormones (%)
Sexual Behavior - People 18+ that ever had sex (vaginal, anal, or oral) (%)
Sexual Behavior - Males 18+ that ever had vaginal sex with a woman (%)
Sexual Behavior - Males 18+ that ever performed oral sex on a woman (%)
Sexual Behavior - Males 18+ that ever had anal sex with a woman (%)
Sexual Behavior - Males 18+ that ever had any sex with a man (%)
Sexual Behavior - Females 18+ that ever had vaginal sex with a man (%)
Sexual Behavior - Females 18+ that ever performed oral sex on a man (%)
Sexual Behavior - Females 18+ that ever had anal sex with a man (%)
Sexual Behavior - Females 18+ that ever had any kind of sex with a woman (%)
Sexual Behavior - Average age people first had sex
Sexual Behavior - Average number of female sex partners in lifetime (males 18+)
Sexual Behavior - Average number of female vaginal sex partners in lifetime (males 18+)
Sexual Behavior - Average age people first performed oral sex on a woman (18+)
Sexual Behavior - Average number of woman performed oral sex on in lifetime (18+)
Sexual Behavior - Average number of male sex partners in lifetime (males 18+)
Sexual Behavior - Average number of male anal sex partners in lifetime (males 18+)
Sexual Behavior - Average age people first performed oral sex on a man (18+)
Sexual Behavior - Average number of male oral sex partners in lifetime (18+)
Sexual Behavior - People using protection when performing oral sex (%)
Sexual Behavior - Average number of times people have vaginal or anal sex a year
Sexual Behavior - People having sex without condom (%)
Sexual Behavior - Average number of male sex partners in lifetime (females 18+)
Sexual Behavior - Average number of male vaginal sex partners in lifetime (females 18+)
Sexual Behavior - Average number of female sex partners in lifetime (females 18+)
Sexual Behavior - Circumcised males 18+ (%)
Sleep Disorders - Average hours sleeping at night
Sleep Disorders - People that has trouble sleeping (%)
Smoking-Cigarette Use - People smoking cigarettes (%)
Taste & Smell - People 40+ having problems with smell (%)
Taste & Smell - People 40+ having problems with taste (%)
Taste & Smell - People 40+ that ever had wisdom teeth removed (%)
Taste & Smell - People 40+ that ever had tonsils teeth removed (%)
Taste & Smell - People 40+ that ever had a loss of consciousness because of a head injury (%)
Taste & Smell - People 40+ that ever had a broken nose or other serious injury to face or skull (%)
Taste & Smell - People 40+ that ever had two or more sinus infections (%)
Weight - Average height (inches)
Weight - Average weight (pounds)
Weight - Average BMI
Weight - People that are obese (%)
Weight - People that ever were obese (%)
Weight - People trying to lose weight (%)
25,835 47.4% Hispanic 16,703 30.6% White alone 5,247 9.6% Black alone 4,366 8.0% Asian alone 1,796 3.3% Two or more races 448 0.8% Other race alone 93 0.2% American Indian alone 17 0.03% Native Hawaiian and Other
According to our research of California and other state lists, there were 55 registered sex offenders living in Beaumont, California as of April 30, 2024 . The ratio of all residents to sex offenders in Beaumont is 788 to 1.The ratio of registered sex offenders to all residents in this city is near the state average.
The City-Data.com crime index weighs serious crimes and violent crimes more heavily. Higher means more crime, U.S. average is 246.1. It adjusts for the number of visitors and daily workers commuting into cities.
- means the value is smaller than the state average.
- means the value is about the same as the state average.
- means the value is bigger than the state average.
- means the value is much bigger than the state average.
Crime rate in Beaumont detailed stats: murders, rapes, robberies, assaults, burglaries, thefts, arson Officers per 1,000 residents here:
0.90California average:
2.30
Latest news from Beaumont, CA collected exclusively by city-data.com from local newspapers, TV, and radio stations
Ancestries: English (4.6%), Irish (4.3%), American (3.9%), German (2.4%), European (1.6%), Italian (1.4%).
Current Local Time:
Land area: 27.2 square miles.
Population density: 2,074 people per square mile (low).
9,194 residents are foreign born (9.2% Latin America , 6.0% Asia ).
This city:
16.9%California:
26.5%
Median real estate property taxes paid for housing units with mortgages in 2022: $6,234 (1.2%)Median real estate property taxes paid for housing units with no mortgage in 2022: $6,052 (1.3%)
Nearest city with pop. 50,000+: San Gorgonio Pass, CA
Nearest city with pop. 200,000+: Riverside, CA
Nearest city with pop. 1,000,000+: San Diego, CA
Nearest cities:
Latitude: 33.92 N, Longitude: 116.97 W
Daytime population change due to commuting: -11,281 (-20.7%)Workers who live and work in this city: 5,436 (22.7%)
Area code commonly used in this area: 909
Single-family new house construction building permits:
2022: 790 buildings , average cost: $249,1002021: 442 buildings , average cost: $281,3002020: 271 buildings , average cost: $253,7002019: 535 buildings , average cost: $307,7002018: 684 buildings , average cost: $259,3002017: 741 buildings , average cost: $168,5002016: 450 buildings , average cost: $170,2002015: 485 buildings , average cost: $173,1002014: 454 buildings , average cost: $165,1002013: 500 buildings , average cost: $164,1002012: 273 buildings , average cost: $152,8002011: 169 buildings , average cost: $152,1002010: 333 buildings , average cost: $162,5002009: 350 buildings , average cost: $164,5002008: 300 buildings , average cost: $185,7002007: 1033 buildings , average cost: $180,8002006: 1454 buildings , average cost: $179,6002005: 2320 buildings , average cost: $178,7002004: 1213 buildings , average cost: $158,4002003: 1096 buildings , average cost: $159,5002002: 533 buildings , average cost: $144,2002001: 448 buildings , average cost: $95,9002000: 94 buildings , average cost: $131,8001999: 24 buildings , average cost: $110,8001998: 9 buildings , average cost: $114,5001997: 2 buildings , average cost: $100,000Unemployment in December 2023:
Population change in the 1990s: +841 (+8.0%).
Most common occupations in Beaumont, CA (%)
Both Males Females
Building and grounds cleaning and maintenance occupations (5.1%)
Retail sales workers, except cashiers (4.8%)
Cashiers (4.7%)
Metal workers and plastic workers (4.3%)
Other office and administrative support workers, including supervisors (3.7%)
Other production occupations, including supervisors (3.6%)
Material recording, scheduling, dispatching, and distributing workers (3.1%)
Metal workers and plastic workers (7.8%)
Building and grounds cleaning and maintenance occupations (7.3%)
Vehicle and mobile equipment mechanics, installers, and repairers (4.9%)
Other production occupations, including supervisors (4.5%)
Construction traders workers except carpenters, electricians, painters, plumbers, and construction laborers (4.2%)
Electrical equipment mechanics and other installation, maintenance, and repair workers, including supervisors (4.2%)
Driver/sales workers and truck drivers (4.2%)
Retail sales workers, except cashiers (7.2%)
Cashiers (6.9%)
Other office and administrative support workers, including supervisors (6.0%)
Preschool, kindergarten, elementary, and middle school teachers (4.8%)
Other teachers, instructors, education, training, and library occupations (4.8%)
Secretaries and administrative assistants (4.0%)
Laborers and material movers, hand (3.6%)
Earthquake activity:
Beaumont-area historical earthquake activity is significantly above California state average. It is 7219% greater than the overall U.S. average. On 6/28/1992 at 11:57:34, a magnitude 7.6 (6.2 MB, 7.6 MS, 7.3 MW, Depth: 0.7 mi, Class: Major, Intensity: VIII - XII) earthquake occurred 31.0 miles away from Beaumont center, causing 3 deaths ( 1 shaking deaths, 2 other deaths) and 400 injuries, causing $100,000,000 total damage and $40,000,000 insured lossesOn 10/16/1999 at 09:46:44, a magnitude 7.4 (6.3 MB, 7.4 MS, 7.2 MW, 7.3 ML) earthquake occurred 51.2 miles away from the city center On 7/21/1952 at 11:52:14, a magnitude 7.7 (7.7 UK) earthquake occurred 137.4 miles away from Beaumont center, causing $50,000,000 total damage On 5/19/1940 at 04:36:40, a magnitude 7.2 (7.2 UK) earthquake occurred 88.2 miles away from Beaumont center, causing $33,000,000 total damage On 6/28/1992 at 15:05:30, a magnitude 6.9 (6.3 MB, 6.7 MS, 6.5 MW, 6.9 ME, Depth: 3.1 mi, Class: Strong, Intensity: VII - IX) earthquake occurred 26.8 miles away from the city center On 4/21/1918 at 22:32:30, a magnitude 6.8 (6.8 UK) earthquake occurred 27.9 miles away from the city center Magnitude types: body-wave magnitude (MB), energy magnitude (ME), local magnitude (ML), surface-wave magnitude (MS), moment magnitude (MW) Natural disasters: The number of natural disasters in Riverside County (46) is a lot greater than the US average (15).Major Disasters (Presidential) Declared: 27Emergencies Declared: 1Fires: 22, Floods: 20, Storms: 8, Winter Storms: 8, Landslides: 6, Mudslides: 5, Heavy Rains: 2, Earthquake: 1, Flash Flood: 1, Freeze: 1, Hurricane: 1, Tornado: 1, Tropical Storm: 1, Other: 1 (Note: some incidents may be assigned to more than one category). Hospitals and medical centers in Beaumont: INDEPENDENT OPTIONS, INC /ORANGE HOUSE (1250 ORANGE STREET) INDEPENDENT OPTIONS, INC/DONNA (680 DONNA DRIVE) BEAUMONT CARE CENTER (1441 N MICHIGAN AVENUE)
PALM GROVE HEALTH CARE (1665 EAST EIGHTH STREET)
RAI-EAST SIXTH STREET-BEAUMONT (1536 E. 6TH STREET)
Amtrak station: BEAUMONT (550 BEAUMONT AVE.) - Bus Station
.
Services: fully wheelchair accessible, public restrooms, full-service food facilities, free short-term parking.
College/University in Beaumont: Beaumont Adult School Full-time enrollment: 107; Location: 1575 Cherry Ave; Public; Website: bas-beaumont-ca.schoolloop.com/)
Colleges/universities with over 2000 students nearest to Beaumont:
Mt San Jacinto Community College District (about 9 miles; San Jacinto, CA ; Full-time enrollment: 8,426)
Crafton Hills College (about 11 miles; Yucaipa, CA ; FT enrollment: 3,222)
Moreno Valley College (about 14 miles; Moreno Valley, CA ; FT enrollment: 4,650)
University of Redlands (about 15 miles; Redlands, CA ; FT enrollment: 4,854)
Loma Linda University (about 19 miles; Loma Linda, CA ; FT enrollment: 2,839)
The Art Institute of California-Argosy University Inland Empire (about 20 miles; San Bernardino, CA ; FT enrollment: 2,238)
University of California-Riverside (about 21 miles; Riverside, CA ; FT enrollment: 20,647)
Public high schools in Beaumont: BEAUMONT SENIOR HIGH Students: 1,633, Location: 39139 CHERRY VALLEY BLVD, Grades: 9-12)GLEN VIEW HIGH Students: 50, Location: 905 MICHIGAN AVE., Grades: 9-12)21ST CENTURY LEARNING INSTITUTE Location: 939 MICHIGAN AVE., Grades: KG-12)
Private high school in Beaumont: CHILDHELP SCHOOL Students: 99, Location: 14700 MANZANITA PARK RD, Grades: KG-12)
Public elementary/middle schools in Beaumont: MOUNTAIN VIEW MIDDLE Students: 882, Location: 200 COUGAR WAY, Grades: 6-8)SAN GORGONIO MIDDLE Students: 863, Location: 1591 CHERRY AVE, Grades: 6-8)THREE RINGS RANCH ELEMENTARY Students: 421, Location: 1040 CLAIBORNE AVE., Grades: KG-5)ANNA HAUSE ELEMENTARY Students: 406, Location: 1015 CARNATION LN., Grades: KG-5)BROOKSIDE ELEMENTARY Students: 372, Location: 38755 BROOKSIDE AVE., Grades: KG-5)TOURNAMENT HILLS ELEMENTARY Students: 280, Location: 36611 CHAMPIONS DR., Grades: KG-5)PALM ELEMENTARY Location: 751 PALM AVE., Grades: KG-5)
SUNDANCE ELEMENTARY Location: 1520 E. EIGHTH ST., Grades: KG-5)
HIGHLAND ACADEMY Location: 715 WELLWOOD AVE., Grades: KG-8, Charter school )
See full list of schools located in Beaumont Library in Beaumont: BEAUMONT LIBRARY DISTRICT Operating income: $1,529,175; Location: 125 E. EIGHTH ST.; 67,498 books ; 737 audio materials ; 5,407 video materials ; 4 local licensed databases ; 49 print serial subscriptions )
User-submitted facts and corrections:
By the way - Calvary Baptist Church of Beaumont no longer exists, however, most of the membership are now a part of "Family Fellowship Church of Beaumont" added by Paul
Notable locations in Beaumont: (A) , American Medical Response Beaumont (B) , Riverside County Fire Department Station 66 Beaumont City (C) , California Department of Forestry and Fire Protection Station 20 Beaumont (D) , Beaumont Library (E) , Beaumont City Hall (F) , Beaumont Chamber of Commerce (G) . Display/hide their locations on the map
Shopping Centers: (1) , Beaumont Plaza Shopping Center (2) . Display/hide their locations on the map
Churches in Beaumont include: (A) , Beaumont Presbyterian Church (B) , Beaumont Seventh Day Adventist Church (C) , Calvary Baptist Church of Beaumont (D) , First Assembly of God Church (E) , First Baptist Church (F) , First Christian Church (G) , First Southern Baptist Church (H) , Missionary Baptist Church of Beaumont (I) . Display/hide their locations on the map
Cemeteries: (1) , Mount View Cemetery (2) . Display/hide their locations on the map
Creeks: (A) , Little San Gorgonio Creek (B) . Display/hide their locations on the map
Parks in Beaumont include: (1) , Rangel Park (2) . Display/hide their locations on the map
Hotels: (1) , Best Western El Rancho Motor I (480 East 5th Street) (2) , Americas Best Value Inn (625 East 5th) (3) . Display/hide their approximate locations on the map
Riverside County has a predicted average indoor radon screening level between 2 and 4 pCi/L (pico curies per liter) - Moderate Potential Drinking water stations with addresses in Beaumont and their reported violations in the past:
BEAUMONT CHERRY VALLEY WD (Population served: 44,000, Groundwater):
Past monitoring violations:
Follow-up Or Routine LCR Tap M/R - In OCT-01-2009, Contaminant: Lead and Copper Rule. Follow-up actions: St Violation/Reminder Notice (JAN-19-2010), St Compliance achieved (JUL-01-2010)
Drinking water stations with addresses in Beaumont that have no violations reported:
DOWLING FRUIT ORCHARD (Population served: 50, Primary Water Source Type: Groundwater)
Average household size: This city:
3.1 peopleCalifornia:
2.9 people
Percentage of family households: This city:
78.9%Whole state:
68.7%
Percentage of households with unmarried partners: This city:
7.4%Whole state:
7.2%
Likely homosexual households (counted as self-reported same-sex unmarried-partner households)
Lesbian couples: 0.5% of all households Gay men: 0.4% of all households
People in group quarters in Beaumont in 2010:
189 people in other noninstitutional facilities
137 people in nursing facilities/skilled-nursing facilities
74 people in residential treatment centers for juveniles (non-correctional)
69 people in emergency and transitional shelters (with sleeping facilities) for people experiencing homelessness
4 people in group homes intended for adults
People in group quarters in Beaumont in 2000:
66 people in nursing homes
49 people in other group homes
30 people in homes or halfway houses for drug/alcohol abuse
10 people in other noninstitutional group quarters
Banks with branches in Beaumont (2011 data):
The Bank of Hemet: Beaumont Branch at 1540 E. 6th Street, Suite C, branch established on 2007/12/10. Info updated 2009/12/28: Bank assets: $439.8 mil, Deposits: $386.3 mil, headquarters in Riverside, CA, positive income , Commercial Lending Specialization, 6 total offices , Holding Company: Hemet Bancorp
U.S. Bank National Association: Beaumont Branch at 1410 Beaumont Avenue, Suite D-3, branch established on 2004/11/22. Info updated 2012/01/30: Bank assets: $330,470.8 mil, Deposits: $236,091.5 mil, headquarters in Cincinnati, OH, positive income , 3121 total offices , Holding Company: U.S. Bancorp
Wells Fargo Bank, National Association: Beaumont Branch at 499 East Sixth Street, branch established on 1981/10/19. Info updated 2011/04/05: Bank assets: $1,161,490.0 mil, Deposits: $905,653.0 mil, headquarters in Sioux Falls, SD, positive income , 6395 total offices , Holding Company: Wells Fargo & Company
Citibank, National Association: 777 Beaumont Avenue Branch at 777 Beaumont Avenue, branch established on 1890/01/01. Info updated 2012/01/10: Bank assets: $1,288,658.0 mil, Deposits: $882,541.0 mil, headquarters in Sioux Falls, SD, positive income , International Specialization, 1048 total offices , Holding Company: Citigroup Inc.
JPMorgan Chase Bank, National Association: Beaumont Highland Springs Branch at 1693 2nd St, branch established on 2009/07/07. Info updated 2011/11/10: Bank assets: $1,811,678.0 mil, Deposits: $1,190,738.0 mil, headquarters in Columbus, OH, positive income , International Specialization, 5577 total offices , Holding Company: Jpmorgan Chase & Co.
Bank of America, National Association: Beauont Branch at 1672 E 2nd St, branch established on 2008/08/27. Info updated 2009/11/18: Bank assets: $1,451,969.3 mil, Deposits: $1,077,176.8 mil, headquarters in Charlotte, NC, positive income , 5782 total offices , Holding Company: Bank Of America Corporation
For population 15 years and over in Beaumont:
Never married: 31.2%Now married: 54.2%Separated: 1.6%Widowed: 3.8%Divorced: 9.1% For population 25 years and over in Beaumont:
High school or higher: 89.5%Bachelor's degree or higher: 26.8%Graduate or professional degree: 10.8%Unemployed: 3.8%Mean travel time to work (commute): 31.4 minutes
Education Gini index (Inequality in education) Here:
11.6California average:
15.5
Religion statistics for Beaumont, CA (based on Riverside County data)
Religion Adherents Congregations Catholic 602,765 51 Evangelical Protestant 240,306 741 Other 77,581 194 Mainline Protestant 29,535 103 Black Protestant 19,170 40 Orthodox 3,647 11 None 1,216,637 -
Source: Clifford Grammich, Kirk Hadaway, Richard Houseal, Dale E.Jones, Alexei Krindatch, Richie Stanley and Richard H.Taylor. 2012. 2010 U.S.Religion Census: Religious Congregations & Membership Study. Association of Statisticians of American Religious Bodies. Jones, Dale E., et al. 2002. Congregations and Membership in the United States 2000. Nashville, TN: Glenmary Research Center. Graphs represent county-level data
Food Environment Statistics: Number of grocery stores : 330This county :
1.60 / 10,000 pop.State :
2.14 / 10,000 pop.
Number of supercenters and club stores : 11Riverside County :
0.05 / 10,000 pop.California :
0.04 / 10,000 pop.
Number of convenience stores (no gas) : 91Riverside County :
0.44 / 10,000 pop.State :
0.62 / 10,000 pop.
Number of convenience stores (with gas) : 311Riverside County :
1.51 / 10,000 pop.California :
1.49 / 10,000 pop.
Number of full-service restaurants : 1,125Here :
5.45 / 10,000 pop.California :
7.42 / 10,000 pop.
Low-income preschool obesity rate : Riverside County :
15.2%State :
17.9%
Health and Nutrition: Healthy diet rate : Beaumont:
49.0%State:
49.4%
Average overall health of teeth and gums : Beaumont:
48.2%California:
48.0%
Average BMI : This city:
28.6California:
28.1
People feeling badly about themselves : Beaumont:
20.2%State:
20.2%
People not drinking alcohol at all : Here:
10.6%California:
11.2%
Average hours sleeping at night : Beaumont:
6.8California:
6.8
Overweight people : Beaumont:
34.0%State:
31.5%
General health condition : This city:
56.7%California:
56.4%
Average condition of hearing : Beaumont:
80.8%California:
80.9%
More about Health and Nutrition of Beaumont, CA Residents
Local government employment and payroll (March 2022)
Function
Full-time employees
Monthly full-time payroll
Average yearly full-time wage
Part-time employees
Monthly part-time payroll
Police Protection - Officers
50 $564,615 $135,508 0 $0 Parks and Recreation
23 $144,217 $75,244 5 $6,452 Transit
20 $109,168 $65,501 2 $6,043 Financial Administration
17 $175,491 $123,876 0 $0 Police - Other
17 $117,256 $82,769 4 $6,521 Sewerage
13 $104,623 $96,575 0 $0 Other and Unallocable
8 $77,571 $116,357 0 $0 Housing and Community Development (Local)
8 $69,745 $104,618 0 $0 Streets and Highways
5 $30,219 $72,526 0 $0 Solid Waste Management
1 $7,588 $91,056 0 $0 Natural Resources
1 $7,295 $87,540 0 $0 Other Government Administration
0 $0 12 $2,688
Totals for Government
163 $1,407,787 $103,641 23 $21,705
Beaumont government finances - Expenditure in 2017 (per resident):
Construction - General - Other: $44,529,000 ($790.24)
Central Staff Services: $312,000 ($5.54)Current Operations - Central Staff Services: $12,891,000 ($228.77)
Police Protection: $9,438,000 ($167.49)Sewerage: $6,106,000 ($108.36)Transit Utilities: $4,799,000 ($85.17)Local Fire Protection: $2,484,000 ($44.08)Parks and Recreation: $2,396,000 ($42.52)Financial Administration: $2,029,000 ($36.01)Solid Waste Management: $1,678,000 ($29.78)Regular Highways: $1,225,000 ($21.74)Protective Inspection and Regulation - Other: $796,000 ($14.13)Health - Other: $557,000 ($9.88)General - Interest on Debt: $11,397,000 ($202.26)
Total Salaries and Wages: $1,254,000 ($22.25)
Beaumont government finances - Revenue in 2017 (per resident):
Charges - Other: $18,816,000 ($333.92)
Sewerage: $9,774,000 ($173.45)Solid Waste Management: $6,121,000 ($108.63)Regular Highways: $549,000 ($9.74)Parks and Recreation: $102,000 ($1.81)Federal Intergovernmental - Housing and Community Development: $497,000 ($8.82)
Other: $244,000 ($4.33)Local Intergovernmental - Transit Utilities: $4,338,000 ($76.98)
Miscellaneous - Special Assessments: $10,325,000 ($183.23)
Donations From Private Sources: $8,788,000 ($155.96)General Revenue - Other: $3,366,000 ($59.73)Fines and Forfeits: $277,000 ($4.92)Interest Earnings: $152,000 ($2.70)Rents: $146,000 ($2.59)Sale of Property: $42,000 ($0.75)Revenue - Transit Utilities: $439,000 ($7.79)
State Intergovernmental - Other: $423,000 ($7.51)
Tax - Property: $7,799,000 ($138.41)
General Sales and Gross Receipts: $4,698,000 ($83.37)Other License: $2,548,000 ($45.22)Public Utilities Sales: $2,394,000 ($42.49)Other Selective Sales: $326,000 ($5.79)Documentary and Stock Transfer: $272,000 ($4.83)Occupation and Business License - Other: $232,000 ($4.12)
Beaumont government finances - Debt in 2017 (per resident):
Long Term Debt - Beginning Outstanding - Unspecified Public Purpose: $222,294,000 ($3944.95)
Outstanding Unspecified Public Purpose: $216,629,000 ($3844.42)Retired Unspecified Public Purpose: $5,795,000 ($102.84)Issue, Unspecified Public Purpose: $130,000 ($2.31)
Beaumont government finances - Cash and Securities in 2017 (per resident):
Bond Funds - Cash and Securities: $47,486,000 ($842.71)
Other Funds - Cash and Securities: $21,652,000 ($384.25)
7.19% of this county's 2021 resident taxpayers lived in other counties in 2020 ($71,521 average adjusted gross income )
Here:
7.19%California average:
5.19%
0.03% of residents moved from foreign countries ($210 average AGI )Riverside County:
0.03%California average:
0.03%
Top counties from which taxpayers relocated into this county between 2020 and 2021:
6.28% of this county's 2020 resident taxpayers moved to other counties in 2021 ($64,593 average adjusted gross income )
Here:
6.28%California average:
6.14%
0.02% of residents moved to foreign countries ($200 average AGI )Riverside County:
0.02%California average:
0.02%
Top counties to which taxpayers relocated from this county between 2020 and 2021:
Businesses in Beaumont, CA
Name Count Name Count
Applebee's 1 McDonald's 2 AutoZone 1 Nike 1 Bed Bath & Beyond 1 Panda Express 1 Best Western 1 Popeyes 1 Blockbuster 1 Quiznos 1 Burger King 1 Rite Aid 1 Circle K 1 Staples 1 Dennys 1 Starbucks 2 El Pollo Loco 1 Subway 2 FedEx 1 T-Mobile 1 H&R Block 1 U-Haul 2 Holiday Inn 1 UPS 2 Home Depot 1 Verizon Wireless 2 Jack In The Box 1 Walgreens 1 Kohl's 1 Walmart 1 Kroger 1 Wendy's 1 MasterBrand Cabinets 4
Strongest AM radio stations in Beaumont:
KMET (1490 AM; 1 kW; BANNING, CA; Owner: SUNSET BROADCASTING, INC.)
KPLS (830 AM; 50 kW; ORANGE, CA; Owner: CRN LICENSES, LLC)
KHPY (1670 AM; 10 kW; MORENO VALLEY, CA; Owner: DELBERT L. VAN VOORHIS)
KLAC (570 AM; 50 kW; LOS ANGELES, CA; Owner: AMFM RADIO LICENSES, L.L.C.)
KFI (640 AM; 50 kW; LOS ANGELES, CA; Owner: CAPSTAR TX LIMITED PARTNERSHIP)
KTNQ (1020 AM; 50 kW; LOS ANGELES, CA; Owner: KTNQ-AM LICENSE CORP.)
KCAL (1410 AM; 5 kW; REDLANDS, CA; Owner: LAZER BROADCASTING CORPORATION)
KXTA (1150 AM; 50 kW; LOS ANGELES, CA; Owner: CITICASTERS LICENSES, L.P.)
KDIS (1110 AM; 50 kW; PASADENA, CA; Owner: ABC,INC.)
KFMB (760 AM; 50 kW; SAN DIEGO, CA; Owner: MIDWEST TELEVISION, INC.)
KNWQ (1140 AM; 10 kW; PALM SPRINGS, CA; Owner: MCC RADIO, LLC)
KFWB (980 AM; 50 kW; LOS ANGELES, CA; Owner: INFINITY BROADCASTING OPERATIONS, INC.)
KSPN (710 AM; 50 kW; LOS ANGELES, CA; Owner: KABC-AM RADIO, INC.)
Strongest FM radio stations in Beaumont:
KAEH (100.9 FM; BEAUMONT, CA; Owner: MOON BROADCASTING RIVERSIDE, LLC)
KLRD (90.1 FM; YUCAIPA, CA; Owner: EDUCATIONAL MEDIA FOUNDATION)
KWRP (96.1 FM; SAN JACINTO, CA; Owner: MAGIC BROADCASTING, INC.)
KPLM-FM2 (106.1 FM; SAN JACINTO, CA; Owner: RM BROADCASTING L.L.C.)
K201AR (88.1 FM; BANNING, CA; Owner: KSGN, INC.)
K232CX (94.3 FM; DESERT HOT SPRINGS, CA; Owner: MCC RADIO, LLC)
KUOR-FM (89.1 FM; REDLANDS, CA; Owner: UNIVERSITY OF REDLANDS)
KATY-FM (101.3 FM; IDYLLWILD, CA; Owner: ALL PRO BROADCASTING, INC.)
KCXX (103.9 FM; LAKE ARROWHEAD, CA; Owner: ALL-PRO BROADCASTING, INC.)
KOLA (99.9 FM; SAN BERNARDINO, CA; Owner: INLAND EMPIRE BROADCASTING CORP.)
KVCR (91.9 FM; SAN BERNARDINO, CA; Owner: SAN BERNARDINO COMMUNITY COLLEGE DISTRICT)
KUCR (88.3 FM; RIVERSIDE, CA; Owner: THE REGENTS OF THE UNIV. OF CA)
KRTM (88.9 FM; TEMECULA, CA; Owner: PENFOLD COMMUNICATIONS, INC.)
KGGI (99.1 FM; RIVERSIDE, CA; Owner: AMFM RADIO LICENSES, L.L.C.)
KLYY (97.5 FM; RIVERSIDE, CA; Owner: ENTRAVISION HOLDINGS, LLC)
K201CD (88.1 FM; VICTORVILLE, CA; Owner: SAN BERNARDINO COMMNTY COLLEGE DIST.)
KXSB (101.7 FM; BIG BEAR LAKE, CA; Owner: LAZER BROADCASTING CORPORATION)
KXRS (105.7 FM; HEMET, CA; Owner: LAZER BROADCASTING CORPORATION)
K295AI (106.9 FM; MUSCOY, CA; Owner: ASSOCIATION FOR COMMUNITY EDUCATION, INC.)
KWVE (107.9 FM; SAN CLEMENTE, CA; Owner: CALVARY CHAPEL OF COSTA MESA)
TV broadcast stations around Beaumont:
KTRO-LP (Channel 50; LANCASTER, CA; Owner: ROBERT D. ADELMAN)
KHIZ (Channel 64; BARSTOW, CA; Owner: SUNBELT TELEVISION, INC.)
KESQ-TV (Channel 42; PALM SPRINGS, CA; Owner: GULF-CALIFORNIA BROADCAST COMPANY)
KVCR-TV (Channel 24; SAN BERNARDINO, CA; Owner: SAN BERNARDINO COMMUNITY COLLEGE DISTRICT)
National Bridge Inventory (NBI) Statistics 33 Number of bridges335ft / 102m Total length1,377,111 Total average daily traffic147,597 Total average daily truck traffic
New bridges - historical statistics
1 1920-1929 4 1930-1939 1 1950-1959 18 1960-1969 3 1990-1999 2 2000-2009 4 2010-2019
See full National Bridge Inventory statistics for Beaumont, CA
Home Mortgage Disclosure Act Aggregated Statistics For Year 2009(Based on 2 full and 5 partial tracts) A) FHA, FSA/RHS & VA B) Conventional C) Refinancings D) Home Improvement Loans E) Loans on Dwellings For 5+ Families F) Non-occupant Loans on G) Loans On Manufactured Number Average Value Number Average Value Number Average Value Number Average Value Number Average Value Number Average Value Number Average Value
LOANS ORIGINATED 174 $185,320 79 $127,089 124 $187,681 5 $76,062 1 $1,590,550 34 $100,268 5 $151,996 APPLICATIONS APPROVED, NOT ACCEPTED 16 $199,866 9 $136,704 20 $200,692 2 $25,345 0 $0 6 $114,468 0 $0 APPLICATIONS DENIED 29 $192,501 18 $136,389 73 $184,249 11 $60,186 0 $0 7 $130,620 5 $71,618 APPLICATIONS WITHDRAWN 23 $201,674 15 $131,683 41 $198,197 4 $88,375 0 $0 8 $139,284 1 $57,940 FILES CLOSED FOR INCOMPLETENESS 5 $134,822 2 $172,660 10 $214,003 0 $0 0 $0 1 $322,130 0 $0
Aggregated Statistics For Year 2008(Based on 2 full and 5 partial tracts) A) FHA, FSA/RHS & VA B) Conventional C) Refinancings D) Home Improvement Loans F) Non-occupant Loans on G) Loans On Manufactured Number Average Value Number Average Value Number Average Value Number Average Value Number Average Value Number Average Value
LOANS ORIGINATED 158 $243,761 113 $195,331 92 $187,359 17 $96,318 35 $153,554 4 $120,938 APPLICATIONS APPROVED, NOT ACCEPTED 9 $282,067 26 $223,627 30 $216,008 5 $83,736 8 $190,962 4 $83,002 APPLICATIONS DENIED 39 $231,517 65 $229,263 170 $229,801 40 $88,259 27 $190,497 11 $105,373 APPLICATIONS WITHDRAWN 28 $217,421 28 $216,088 54 $238,647 10 $127,616 9 $204,320 0 $0 FILES CLOSED FOR INCOMPLETENESS 1 $266,570 4 $227,505 11 $200,868 2 $86,375 2 $234,715 0 $0
Aggregated Statistics For Year 2007(Based on 2 full and 5 partial tracts) A) FHA, FSA/RHS & VA B) Conventional C) Refinancings D) Home Improvement Loans E) Loans on Dwellings For 5+ Families F) Non-occupant Loans on G) Loans On Manufactured Number Average Value Number Average Value Number Average Value Number Average Value Number Average Value Number Average Value Number Average Value
LOANS ORIGINATED 32 $306,920 377 $233,903 320 $233,203 83 $118,354 3 $752,137 58 $227,447 10 $143,489 APPLICATIONS APPROVED, NOT ACCEPTED 1 $448,050 103 $228,202 98 $247,783 21 $95,820 0 $0 21 $232,915 7 $117,729 APPLICATIONS DENIED 9 $312,909 184 $247,216 354 $267,409 85 $139,295 2 $625,000 51 $231,006 19 $105,672 APPLICATIONS WITHDRAWN 3 $342,493 122 $221,044 140 $275,030 22 $157,809 0 $0 13 $247,868 1 $127,640 FILES CLOSED FOR INCOMPLETENESS 0 $0 18 $261,857 47 $292,110 8 $122,386 0 $0 6 $226,120 1 $68,690
Aggregated Statistics For Year 2006(Based on 2 full and 5 partial tracts) A) FHA, FSA/RHS & VA B) Conventional C) Refinancings D) Home Improvement Loans E) Loans on Dwellings For 5+ Families F) Non-occupant Loans on G) Loans On Manufactured Number Average Value Number Average Value Number Average Value Number Average Value Number Average Value Number Average Value Number Average Value
LOANS ORIGINATED 7 $351,580 893 $226,636 555 $224,527 120 $118,232 1 $517,440 136 $207,241 13 $123,578 APPLICATIONS APPROVED, NOT ACCEPTED 0 $0 192 $236,303 124 $236,097 25 $117,955 1 $250,000 27 $202,193 4 $102,315 APPLICATIONS DENIED 1 $241,950 309 $225,452 347 $251,151 114 $120,189 0 $0 51 $256,672 13 $102,197 APPLICATIONS WITHDRAWN 3 $272,533 205 $236,139 264 $232,359 33 $133,764 1 $320,000 38 $226,834 2 $143,695 FILES CLOSED FOR INCOMPLETENESS 0 $0 37 $215,374 53 $248,750 3 $173,680 0 $0 5 $242,088 0 $0
Aggregated Statistics For Year 2005(Based on 2 full and 5 partial tracts) A) FHA, FSA/RHS & VA B) Conventional C) Refinancings D) Home Improvement Loans F) Non-occupant Loans on G) Loans On Manufactured Number Average Value Number Average Value Number Average Value Number Average Value Number Average Value Number Average Value
LOANS ORIGINATED 6 $245,598 839 $222,523 626 $201,122 107 $122,727 157 $203,456 17 $139,342 APPLICATIONS APPROVED, NOT ACCEPTED 0 $0 205 $227,823 113 $203,363 24 $116,536 25 $194,927 8 $92,214 APPLICATIONS DENIED 3 $270,067 236 $215,318 262 $204,280 82 $97,729 41 $214,780 15 $88,149 APPLICATIONS WITHDRAWN 2 $219,460 221 $212,423 245 $205,527 45 $145,528 53 $181,558 8 $112,171 FILES CLOSED FOR INCOMPLETENESS 0 $0 37 $231,361 56 $192,696 3 $192,027 4 $226,352 0 $0
Aggregated Statistics For Year 2004(Based on 2 full and 5 partial tracts) A) FHA, FSA/RHS & VA B) Conventional C) Refinancings D) Home Improvement Loans E) Loans on Dwellings For 5+ Families F) Non-occupant Loans on G) Loans On Manufactured Number Average Value Number Average Value Number Average Value Number Average Value Number Average Value Number Average Value Number Average Value
LOANS ORIGINATED 20 $184,064 575 $179,983 666 $163,245 94 $96,078 3 $945,670 121 $161,844 10 $91,201 APPLICATIONS APPROVED, NOT ACCEPTED 4 $160,640 148 $170,200 133 $154,613 21 $78,246 0 $0 26 $174,747 7 $84,377 APPLICATIONS DENIED 2 $121,790 140 $179,385 264 $147,915 78 $70,867 0 $0 35 $168,363 10 $87,304 APPLICATIONS WITHDRAWN 2 $166,040 113 $166,723 230 $163,897 35 $87,811 0 $0 38 $140,311 3 $122,290 FILES CLOSED FOR INCOMPLETENESS 1 $290,720 21 $158,787 55 $164,173 7 $86,016 0 $0 5 $136,498 0 $0
Aggregated Statistics For Year 2003(Based on 2 full and 5 partial tracts) A) FHA, FSA/RHS & VA B) Conventional C) Refinancings D) Home Improvement Loans E) Loans on Dwellings For 5+ Families F) Non-occupant Loans on Number Average Value Number Average Value Number Average Value Number Average Value Number Average Value Number Average Value
LOANS ORIGINATED 80 $152,861 452 $139,218 583 $117,685 29 $39,013 4 $581,180 104 $116,535 APPLICATIONS APPROVED, NOT ACCEPTED 6 $148,282 70 $139,470 102 $124,879 4 $41,552 0 $0 18 $144,893 APPLICATIONS DENIED 13 $149,492 86 $131,600 195 $115,004 25 $46,540 0 $0 24 $105,527 APPLICATIONS WITHDRAWN 5 $177,814 75 $147,777 178 $124,638 14 $47,982 0 $0 19 $125,665 FILES CLOSED FOR INCOMPLETENESS 1 $208,550 9 $168,619 33 $117,513 5 $54,700 0 $0 0 $0
Aggregated Statistics For Year 2002(Based on 2 full and 2 partial tracts) A) FHA, FSA/RHS & VA B) Conventional C) Refinancings D) Home Improvement Loans F) Non-occupant Loans on Number Average Value Number Average Value Number Average Value Number Average Value Number Average Value
LOANS ORIGINATED 144 $145,242 210 $116,363 255 $93,402 6 $39,498 43 $111,327 APPLICATIONS APPROVED, NOT ACCEPTED 8 $141,484 35 $119,497 56 $92,700 3 $25,890 8 $76,538 APPLICATIONS DENIED 10 $142,611 31 $101,441 110 $93,011 33 $22,906 13 $70,974 APPLICATIONS WITHDRAWN 24 $158,530 44 $117,349 73 $98,132 3 $12,743 3 $84,983 FILES CLOSED FOR INCOMPLETENESS 0 $0 2 $105,810 25 $100,781 0 $0 0 $0
Aggregated Statistics For Year 2001(Based on 2 full and 2 partial tracts) A) FHA, FSA/RHS & VA B) Conventional C) Refinancings D) Home Improvement Loans E) Loans on Dwellings For 5+ Families F) Non-occupant Loans on Number Average Value Number Average Value Number Average Value Number Average Value Number Average Value Number Average Value
LOANS ORIGINATED 79 $103,915 96 $85,472 179 $83,393 9 $19,957 1 $164,640 27 $75,449 APPLICATIONS APPROVED, NOT ACCEPTED 4 $64,395 9 $101,912 40 $73,056 3 $38,787 0 $0 2 $62,565 APPLICATIONS DENIED 6 $111,867 28 $59,450 102 $75,065 22 $15,237 0 $0 8 $75,130 APPLICATIONS WITHDRAWN 7 $90,896 17 $131,887 78 $82,533 6 $12,185 0 $0 3 $61,507 FILES CLOSED FOR INCOMPLETENESS 0 $0 1 $79,330 23 $72,855 0 $0 0 $0 0 $0
Aggregated Statistics For Year 2000(Based on 2 full and 2 partial tracts) A) FHA, FSA/RHS & VA B) Conventional C) Refinancings D) Home Improvement Loans E) Loans on Dwellings For 5+ Families F) Non-occupant Loans on Number Average Value Number Average Value Number Average Value Number Average Value Number Average Value Number Average Value
LOANS ORIGINATED 63 $86,080 53 $74,786 45 $66,538 12 $30,643 3 $207,797 17 $64,404 APPLICATIONS APPROVED, NOT ACCEPTED 3 $67,617 11 $69,935 16 $58,362 14 $23,479 0 $0 3 $57,377 APPLICATIONS DENIED 7 $79,147 27 $63,946 63 $68,425 20 $24,572 2 $108,000 9 $65,843 APPLICATIONS WITHDRAWN 5 $78,506 11 $59,477 33 $50,838 1 $67,470 1 $577,980 1 $65,030 FILES CLOSED FOR INCOMPLETENESS 0 $0 2 $64,930 11 $82,841 0 $0 0 $0 2 $61,500
Aggregated Statistics For Year 1999(Based on 2 full and 3 partial tracts) A) FHA, FSA/RHS & VA B) Conventional C) Refinancings D) Home Improvement Loans E) Loans on Dwellings For 5+ Families F) Non-occupant Loans on Number Average Value Number Average Value Number Average Value Number Average Value Number Average Value Number Average Value
LOANS ORIGINATED 76 $81,712 44 $87,361 111 $73,289 15 $23,245 1 $581,700 16 $67,500 APPLICATIONS APPROVED, NOT ACCEPTED 6 $82,632 7 $69,624 27 $72,822 11 $21,220 0 $0 2 $71,355 APPLICATIONS DENIED 6 $108,613 24 $61,825 88 $74,733 28 $19,144 1 $604,010 9 $57,807 APPLICATIONS WITHDRAWN 6 $81,217 14 $79,240 46 $70,424 2 $43,945 1 $76,350 5 $43,116 FILES CLOSED FOR INCOMPLETENESS 4 $104,968 1 $85,870 21 $83,948 0 $0 0 $0 2 $85,655
Detailed HMDA statistics for the following Tracts:
0438.05
, 0438.06 , 0438.07 , 0438.08 , 0438.09 , 0439.00 , 0440.00
Private Mortgage Insurance Companies Aggregated Statistics For Year 2009(Based on 2 full and 4 partial tracts) A) Conventional B) Refinancings Number Average Value Number Average Value
LOANS ORIGINATED 6 $159,542 1 $120,000 APPLICATIONS APPROVED, NOT ACCEPTED 4 $205,370 1 $394,470 APPLICATIONS DENIED 2 $136,650 1 $349,700 APPLICATIONS WITHDRAWN 1 $185,990 0 $0 FILES CLOSED FOR INCOMPLETENESS 1 $257,090 2 $281,330
Aggregated Statistics For Year 2008(Based on 2 full and 5 partial tracts) A) Conventional B) Refinancings C) Non-occupant Loans on Number Average Value Number Average Value Number Average Value
LOANS ORIGINATED 33 $251,711 6 $281,695 1 $274,250 APPLICATIONS APPROVED, NOT ACCEPTED 18 $285,089 13 $292,184 1 $366,130 APPLICATIONS DENIED 1 $370,030 2 $208,160 1 $125,350 APPLICATIONS WITHDRAWN 1 $228,420 1 $184,080 0 $0 FILES CLOSED FOR INCOMPLETENESS 1 $167,180 1 $209,680 0 $0
Aggregated Statistics For Year 2007(Based on 2 full and 5 partial tracts) A) Conventional B) Refinancings C) Non-occupant Loans on D) Loans On Manufactured Number Average Value Number Average Value Number Average Value Number Average Value
LOANS ORIGINATED 37 $312,371 20 $331,350 3 $262,027 1 $167,450 APPLICATIONS APPROVED, NOT ACCEPTED 9 $352,678 4 $390,305 0 $0 0 $0 APPLICATIONS DENIED 2 $277,145 3 $404,547 2 $182,010 0 $0 APPLICATIONS WITHDRAWN 2 $416,940 3 $307,277 0 $0 0 $0 FILES CLOSED FOR INCOMPLETENESS 0 $0 0 $0 0 $0 0 $0
Aggregated Statistics For Year 2006(Based on 2 full and 5 partial tracts) A) Conventional B) Refinancings C) Non-occupant Loans on Number Average Value Number Average Value Number Average Value
LOANS ORIGINATED 11 $272,677 10 $334,465 1 $402,300 APPLICATIONS APPROVED, NOT ACCEPTED 4 $281,825 2 $306,715 0 $0 APPLICATIONS DENIED 0 $0 0 $0 0 $0 APPLICATIONS WITHDRAWN 2 $286,625 0 $0 1 $219,000 FILES CLOSED FOR INCOMPLETENESS 0 $0 0 $0 0 $0
Aggregated Statistics For Year 2005(Based on 2 full and 5 partial tracts) A) Conventional B) Refinancings C) Non-occupant Loans on Number Average Value Number Average Value Number Average Value
LOANS ORIGINATED 23 $251,256 15 $231,457 7 $194,304 APPLICATIONS APPROVED, NOT ACCEPTED 2 $288,890 3 $236,980 0 $0 APPLICATIONS DENIED 0 $0 1 $205,000 0 $0 APPLICATIONS WITHDRAWN 2 $147,110 0 $0 1 $106,940 FILES CLOSED FOR INCOMPLETENESS 0 $0 0 $0 0 $0
Aggregated Statistics For Year 2004(Based on 2 full and 5 partial tracts) A) Conventional B) Refinancings C) Non-occupant Loans on Number Average Value Number Average Value Number Average Value
LOANS ORIGINATED 66 $230,209 18 $173,150 9 $178,778 APPLICATIONS APPROVED, NOT ACCEPTED 31 $216,559 10 $180,784 3 $184,417 APPLICATIONS DENIED 0 $0 0 $0 0 $0 APPLICATIONS WITHDRAWN 16 $246,362 0 $0 0 $0 FILES CLOSED FOR INCOMPLETENESS 6 $235,403 1 $256,410 0 $0
Aggregated Statistics For Year 2003(Based on 2 full and 5 partial tracts) A) Conventional B) Refinancings C) Non-occupant Loans on Number Average Value Number Average Value Number Average Value
LOANS ORIGINATED 70 $166,858 41 $147,955 10 $150,575 APPLICATIONS APPROVED, NOT ACCEPTED 5 $156,174 5 $154,916 1 $135,470 APPLICATIONS DENIED 0 $0 2 $155,425 0 $0 APPLICATIONS WITHDRAWN 2 $165,725 0 $0 1 $144,740 FILES CLOSED FOR INCOMPLETENESS 0 $0 0 $0 0 $0
Aggregated Statistics For Year 2002(Based on 2 full and 2 partial tracts) A) Conventional B) Refinancings C) Non-occupant Loans on Number Average Value Number Average Value Number Average Value
LOANS ORIGINATED 34 $123,381 18 $120,950 6 $110,952 APPLICATIONS APPROVED, NOT ACCEPTED 2 $159,830 4 $116,388 0 $0 APPLICATIONS DENIED 1 $112,680 0 $0 0 $0 APPLICATIONS WITHDRAWN 0 $0 1 $156,770 0 $0 FILES CLOSED FOR INCOMPLETENESS 0 $0 0 $0 0 $0
Aggregated Statistics For Year 2001(Based on 2 full and 2 partial tracts) A) Conventional B) Refinancings C) Non-occupant Loans on Number Average Value Number Average Value Number Average Value
LOANS ORIGINATED 20 $78,270 11 $97,221 4 $74,698 APPLICATIONS APPROVED, NOT ACCEPTED 3 $89,847 0 $0 0 $0 APPLICATIONS DENIED 0 $0 0 $0 0 $0 APPLICATIONS WITHDRAWN 0 $0 0 $0 0 $0 FILES CLOSED FOR INCOMPLETENESS 0 $0 0 $0 0 $0
Aggregated Statistics For Year 2000(Based on 1 full and 2 partial tracts) A) Conventional B) Refinancings C) Non-occupant Loans on Number Average Value Number Average Value Number Average Value
LOANS ORIGINATED 6 $89,960 2 $93,915 3 $55,307 APPLICATIONS APPROVED, NOT ACCEPTED 0 $0 0 $0 0 $0 APPLICATIONS DENIED 0 $0 1 $91,310 0 $0 APPLICATIONS WITHDRAWN 0 $0 0 $0 0 $0 FILES CLOSED FOR INCOMPLETENESS 0 $0 0 $0 0 $0
Aggregated Statistics For Year 1999(Based on 2 full and 3 partial tracts) A) Conventional B) Refinancings C) Non-occupant Loans on Number Average Value Number Average Value Number Average Value
LOANS ORIGINATED 9 $101,019 6 $112,618 1 $95,570 APPLICATIONS APPROVED, NOT ACCEPTED 2 $100,950 6 $89,157 1 $78,880 APPLICATIONS DENIED 1 $93,490 0 $0 0 $0 APPLICATIONS WITHDRAWN 0 $0 0 $0 0 $0 FILES CLOSED FOR INCOMPLETENESS 0 $0 0 $0 0 $0
Detailed PMIC statistics for the following Tracts:
0438.05
, 0438.06 , 0438.07 , 0438.08 , 0438.09 , 0439.00 , 0440.00 Fire-safe hotels and motels in Beaumont, California:
Holiday Inn Express Hotel & Suites Beaumont Ca, 1864 Oak Vly Village Cir, Beaumont, California 92223 Phone: (951) 769-3600, Fax: (951) 845-0248
Rodeway Inn Beaumont CA, 1265 E 6th St, Beaumont, California 92223 Phone: (951) 845-1436, Fax: (951) 845-1795
All 2 fire-safe hotels and motels in Beaumont, California Beaumont compared to California state average:
Unemployed percentage significantly below state average. Black race population percentage significantly above state average. Hispanic race population percentage significantly above state average. Foreign-born population percentage significantly above state average. Renting percentage below state average. Length of stay since moving in below state average. Number of rooms per house above state average. House age significantly below state average. Number of college students significantly above state average.
#9 on the list of "Top 101 cities with the largest percentage population increase from 2000 (population 5,000+)"
#85 on the list of "Top 100 fastest growing cities from 2000 to 2014 (pop. 5,000+)"
#95 on the list of "Top 101 cities with largest percentage of females in occupations: law enforcement workers including supervisors (population 5,000+)"
#100 on the list of "Top 101 cities with most building permits per 10,000 residents (population 5,000+)"
#3 on the list of "Top 101 counties with the highest lead air pollution readings in 2012 (µg/m3 )"
#4 on the list of "Top 101 counties with the highest ground withdrawal of fresh water for public supply"
#11 on the list of "Top 101 counties with the most Catholic adherents"
#11 on the list of "Top 101 counties with the highest total withdrawal of fresh water for public supply"
#12 on the list of "Top 101 counties with the highest carbon monoxide air pollution readings in 2012 (ppm)"
Top Patent Applicants
Steve Williams (16)
Richard Jeff Garcia (7)
Lindsay A. Riehle (4)
Thomas Lueken (3)
Isaac Kinde (2)
Joseph Raymond Renteria (2)
Jamie Tooley (2)
Isaac A. Kinde (2)
Ken Colclesser (2)
Arthur Hendey, Sr. (2)
Total of 67 patent applications in 2008-2024.
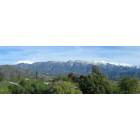
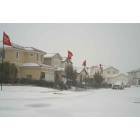

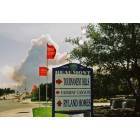
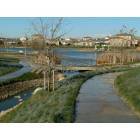
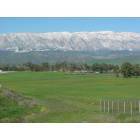
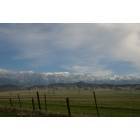


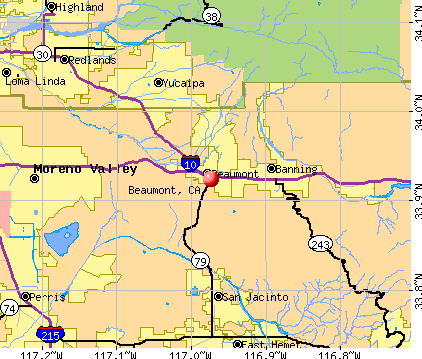


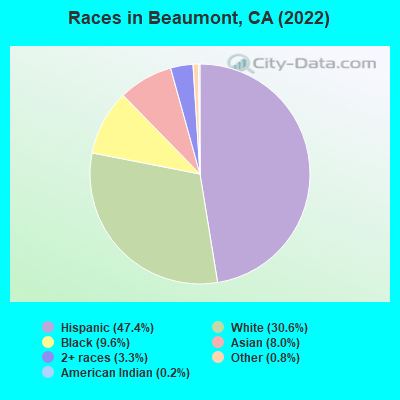
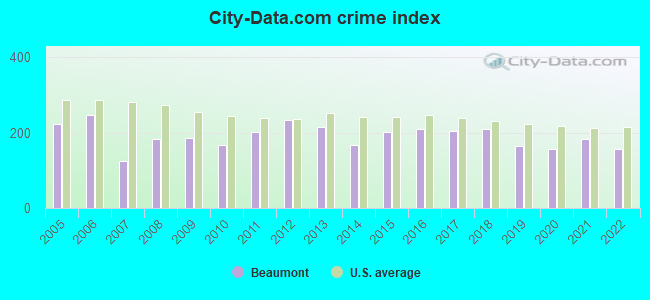
 Recent articles from our blog. Our writers, many of them Ph.D. graduates or candidates, create easy-to-read articles on a wide variety of topics.

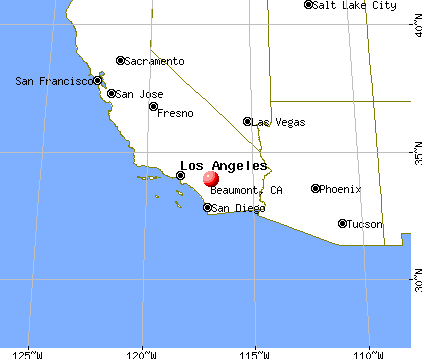
 (3.6 miles
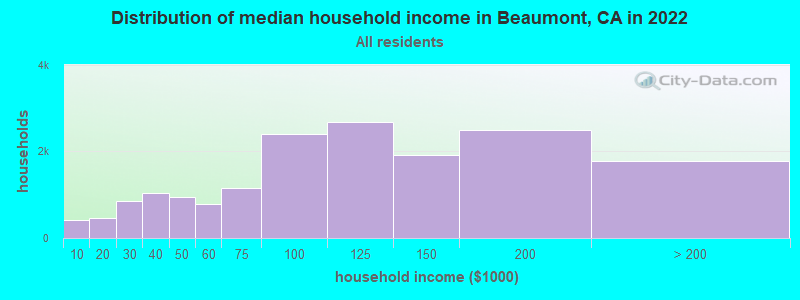
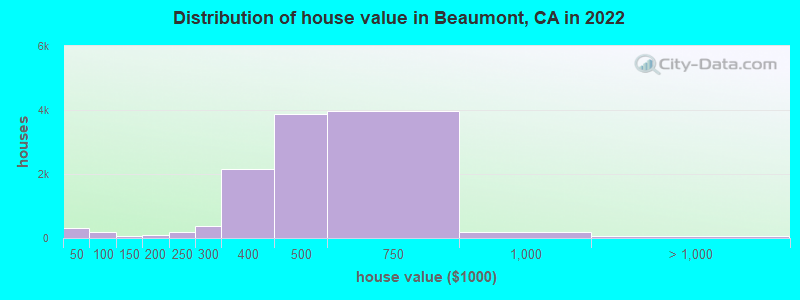

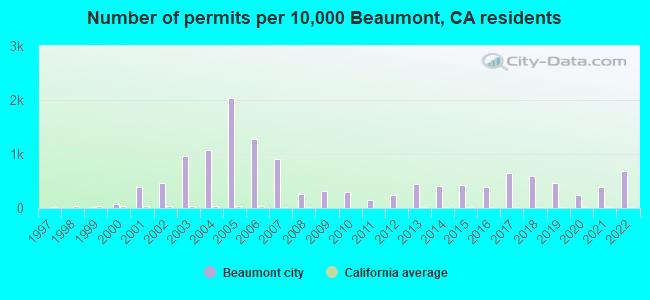
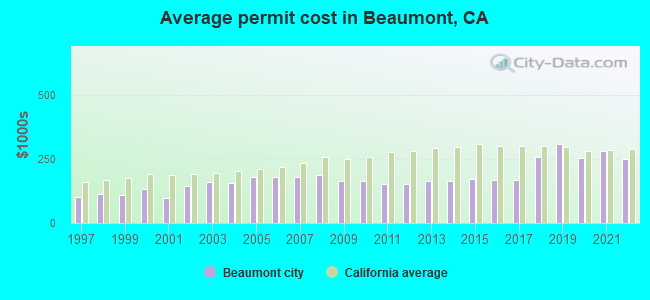
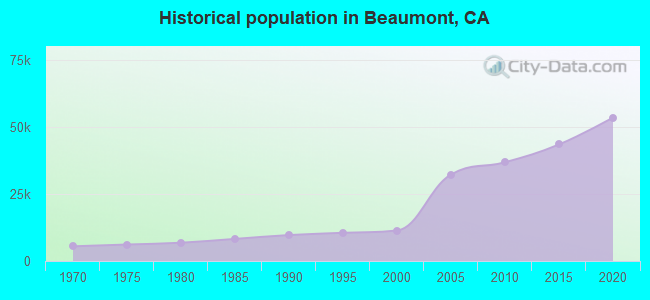
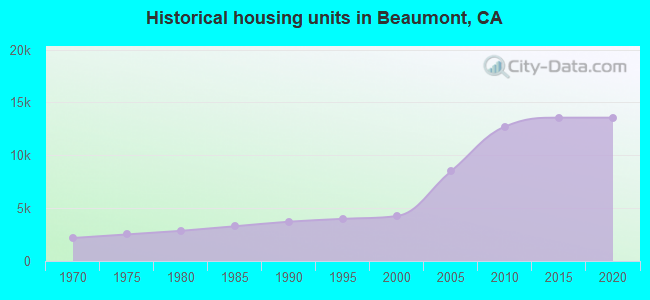
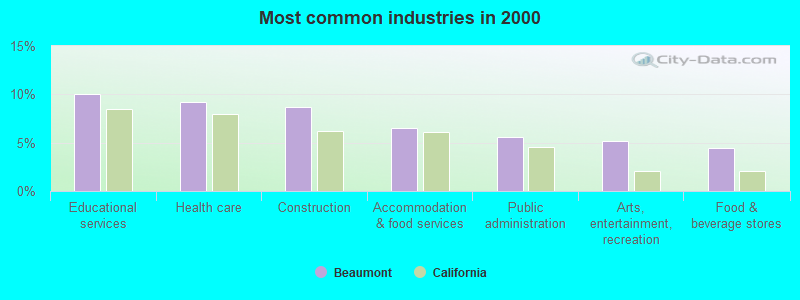
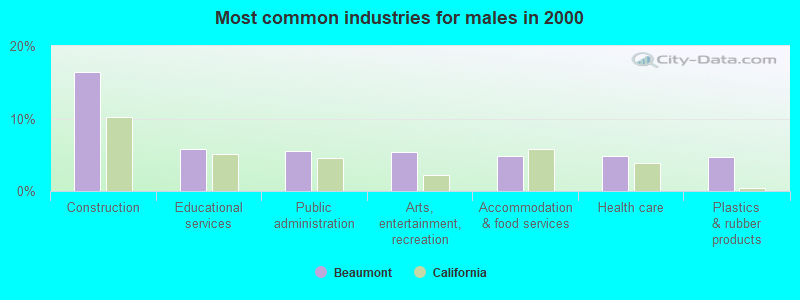
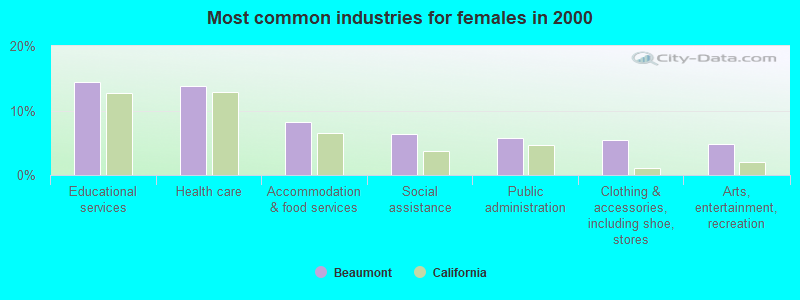
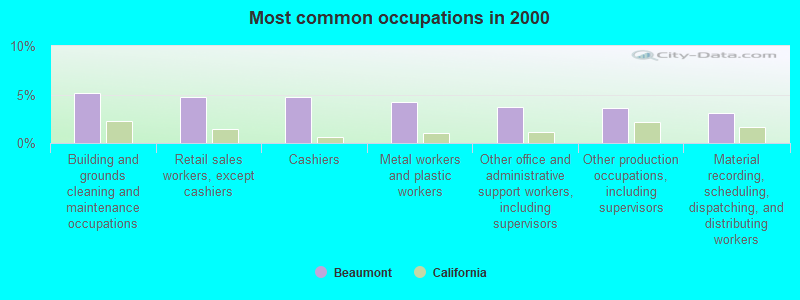
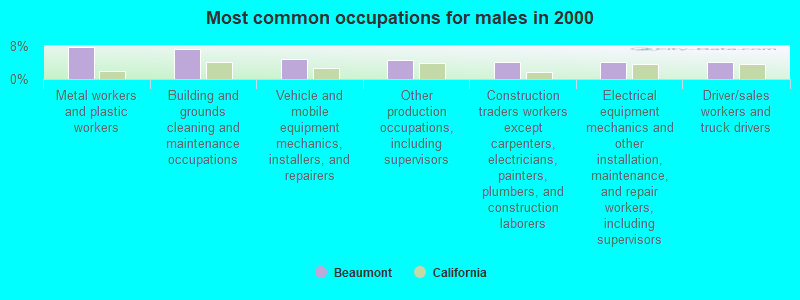
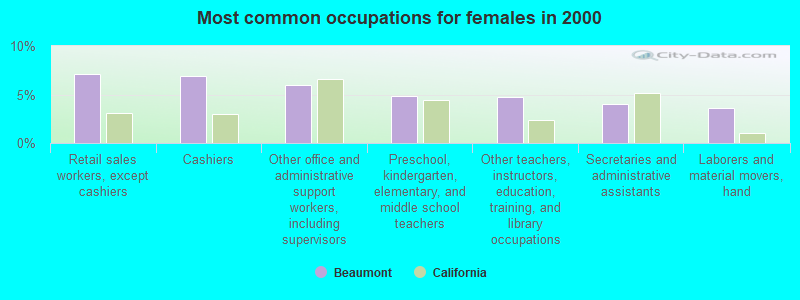
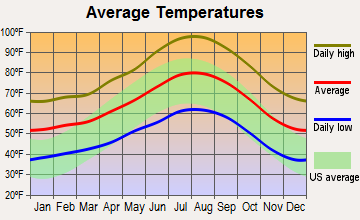
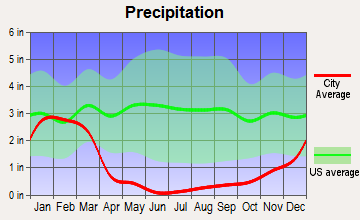

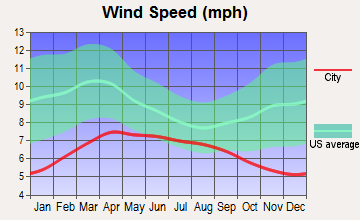
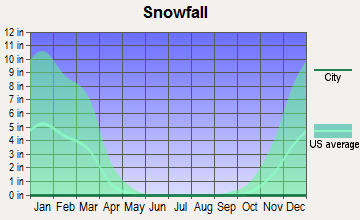
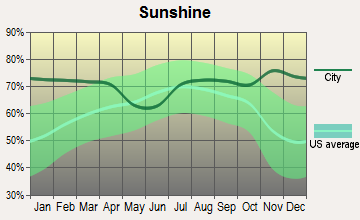

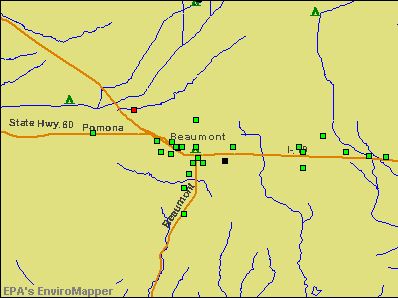

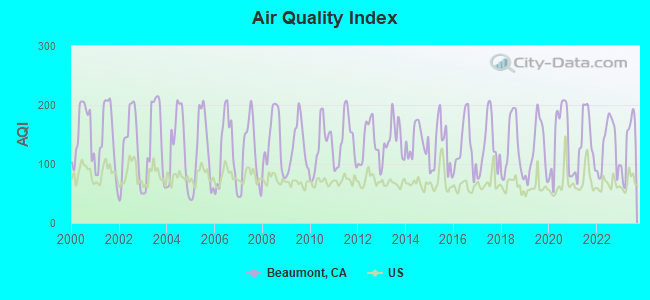
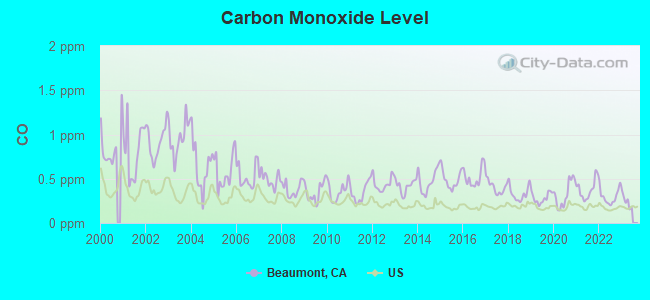
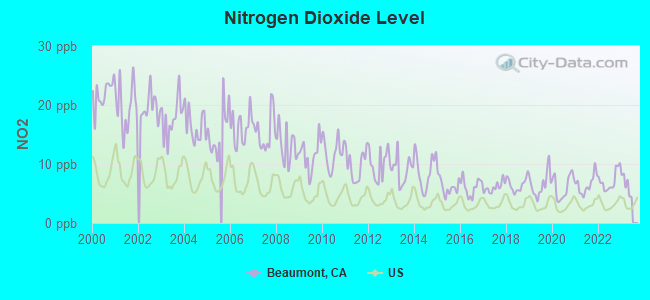
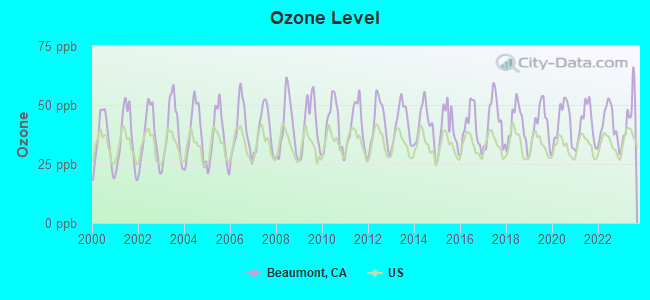
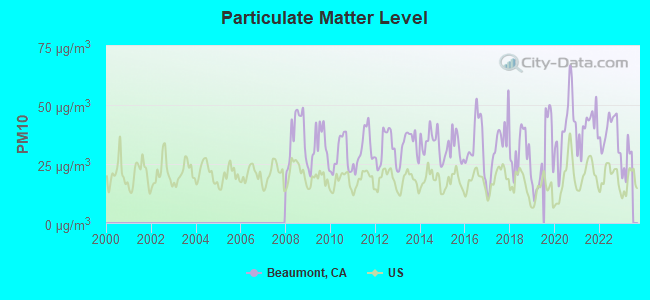
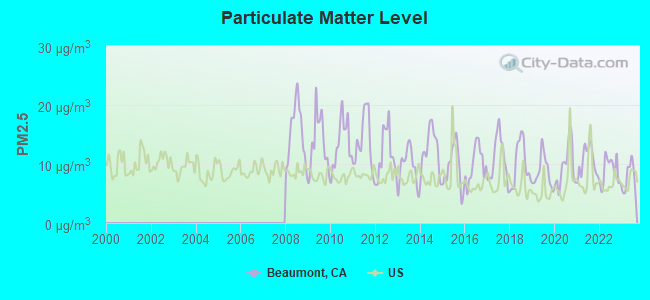
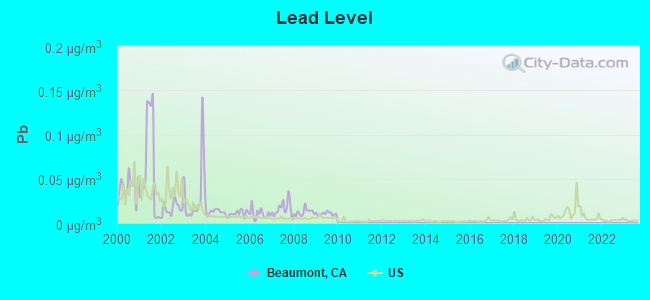
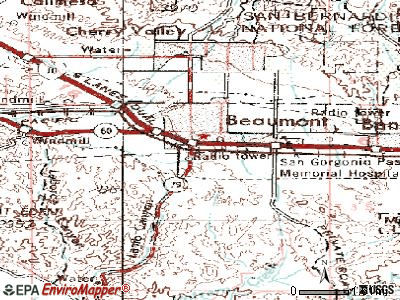
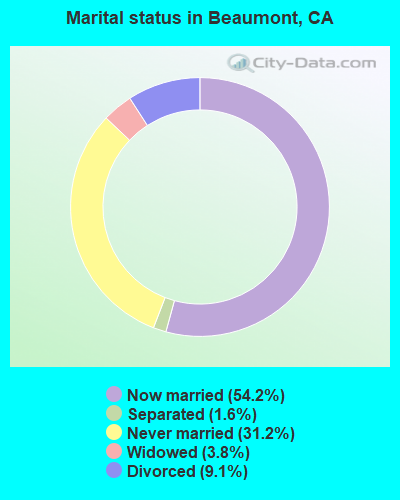
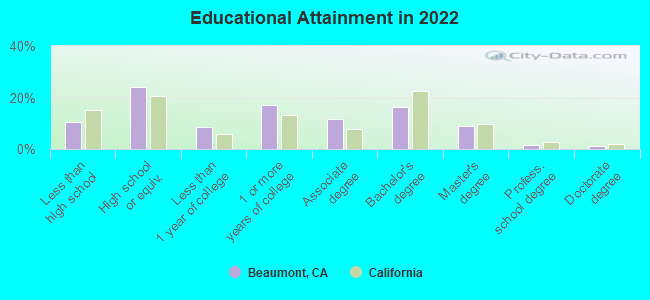
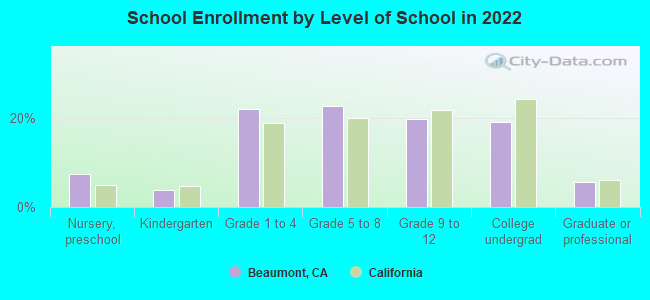
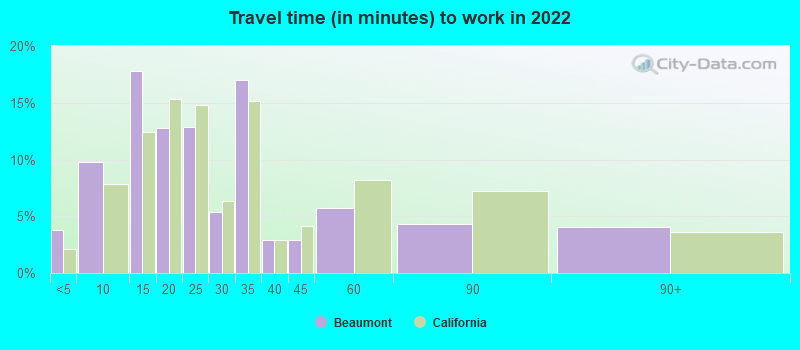
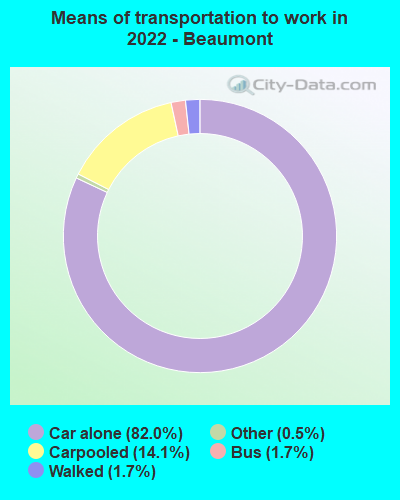


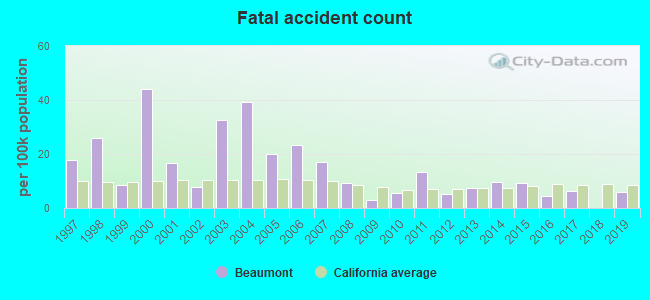
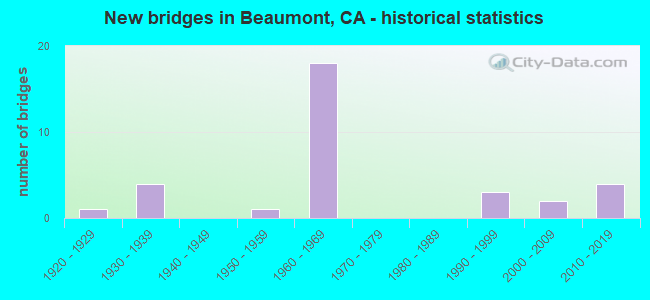
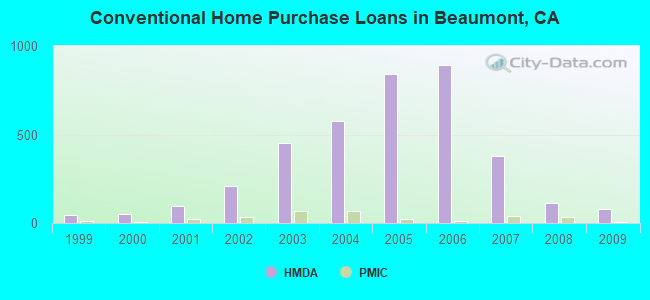
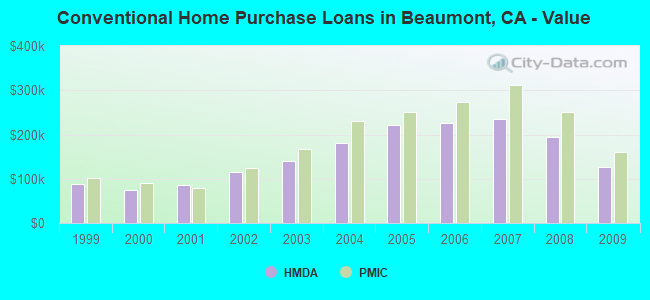
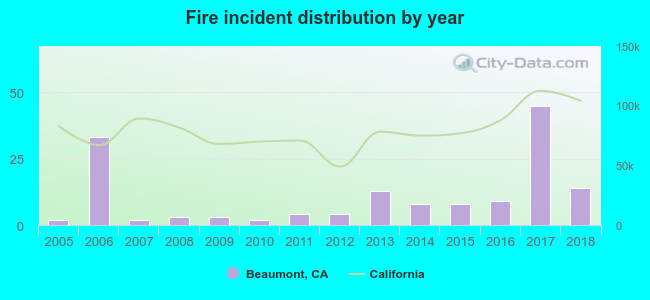 Based on the data from the years 2005 - 2018 the average number of fire incidents per year is 11. The highest number of reported fires - 45 took place in 2017, and the least - 2 in 2005. The data has an increasing trend.
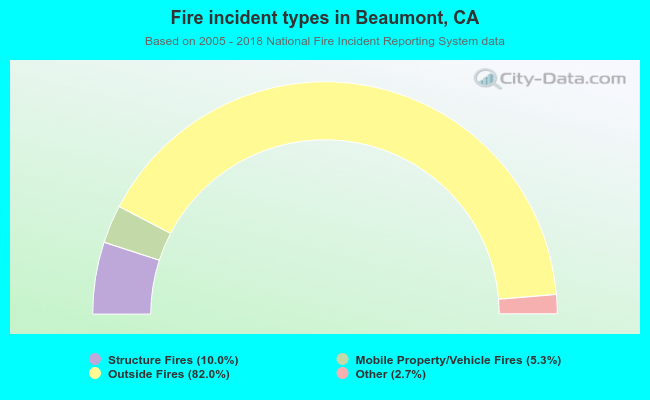 When looking into fire subcategories, the most reports belonged to: Outside Fires (82.0%), and Structure Fires (10.0%).