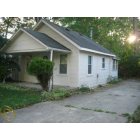
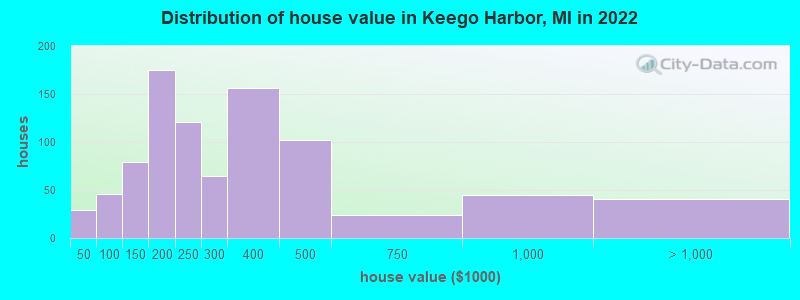
Estimated median house or condo value in 2022: $247,554 (it was $107,000 in 2000)
Keego Harbor:
$247,554
MI:
$224,400
Mean prices in 2022:all housing units: $282,252; detached houses: $290,068; townhouses or other attached units: $315,829; in 3-to-4-unit structures: $108,834; mobile homes: $275,723
Median gross rent in 2022: $1,072.
March 2022 cost of living index in Keego Harbor: 96.9 (near average, U.S. average is 100)
According to our research of Michigan and other state lists, there were 5 registered sex offenders living in Keego Harbor, Michigan as of April 28, 2024. The ratio of all residents to sex offenders in Keego Harbor is 609 to 1. The ratio of registered sex offenders to all residents in this city is lower than the state average.
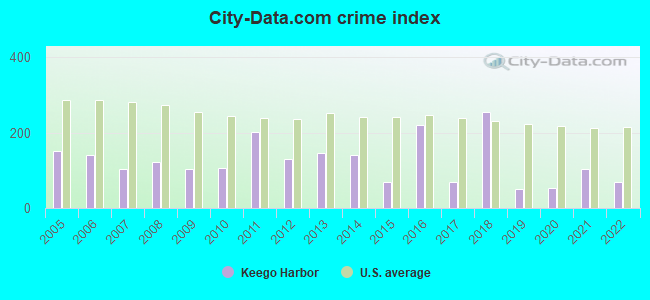
Crime rates in Keego Harbor by year
Type
2009
2010
2011
2012
2013
2014
2015
2016
2017
2018
2019
2020
2021
2022
Murders (per 100,000)
0 (0.0)
0 (0.0)
0 (0.0)
0 (0.0)
0 (0.0)
0 (0.0)
0 (0.0)
0 (0.0)
0 (0.0)
3 (86.6)
0 (0.0)
0 (0.0)
0 (0.0)
0 (0.0)
Rapes (per 100,000)
1 (35.1)
0 (0.0)
0 (0.0)
1 (33.4)
1 (33.2)
0 (0.0)
0 (0.0)
4 (131.6)
0 (0.0)
0 (0.0)
1 (28.9)
0 (0.0)
0 (0.0)
0 (0.0)
Robberies (per 100,000)
0 (0.0)
0 (0.0)
1 (33.7)
0 (0.0)
0 (0.0)
2 (65.9)
0 (0.0)
1 (32.9)
0 (0.0)
1 (28.9)
0 (0.0)
0 (0.0)
1 (29.4)
0 (0.0)
Assaults (per 100,000)
2 (70.3)
5 (168.4)
17 (572.8)
3 (100.3)
4 (132.8)
10 (329.6)
4 (131.6)
9 (296.1)
1 (33.0)
5 (144.3)
0 (0.0)
6 (174.9)
13 (382.8)
4 (145.9)
Burglaries (per 100,000)
9 (316.2)
12 (404.0)
13 (438.0)
8 (267.4)
13 (431.5)
7 (230.7)
8 (263.2)
2 (65.8)
5 (165.0)
3 (86.6)
2 (57.8)
3 (87.4)
0 (0.0)
6 (218.9)
Thefts (per 100,000)
24 (843.3)
32 (1,077)
28 (943.4)
42 (1,404)
42 (1,394)
29 (955.8)
19 (625.0)
30 (986.8)
34 (1,122)
29 (836.9)
18 (519.9)
10 (291.5)
11 (323.9)
15 (547.2)
Auto thefts (per 100,000)
2 (70.3)
0 (0.0)
3 (101.1)
3 (100.3)
3 (99.6)
0 (0.0)
0 (0.0)
1 (32.9)
2 (66.0)
2 (57.7)
1 (28.9)
0 (0.0)
2 (58.9)
1 (36.5)
Arson (per 100,000)
0 (0.0)
0 (0.0)
0 (0.0)
0 (0.0)
0 (0.0)
0 (0.0)
0 (0.0)
0 (0.0)
0 (0.0)
0 (0.0)
0 (0.0)
0 (0.0)
0 (0.0)
0 (0.0)
City-Data.com crime index
103.7
105.1
201.1
129.7
147.0
140.1
69.7
221.1
68.3
254.8
50.3
52.8
103.1
69.3
The City-Data.com crime index weighs serious crimes and violent crimes more heavily. Higher means more crime, U.S. average is 246.1. It adjusts for the number of visitors and daily workers commuting into cities.
Latest news from Keego Harbor, MI collected exclusively by city-data.com from local newspapers, TV, and radio stations
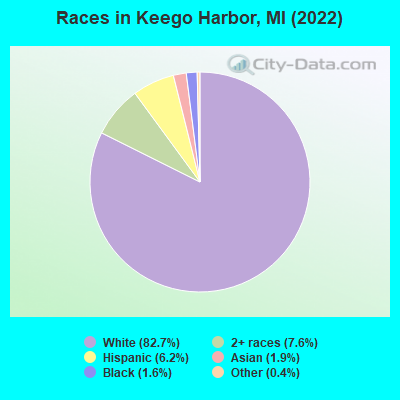
Ancestries: German (15.3%), Irish (8.9%), American (8.4%), Polish (7.5%), Welsh (6.6%), Assyrian (6.3%).
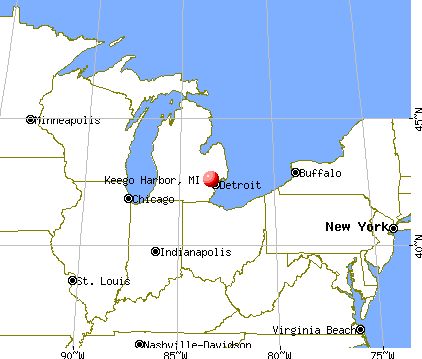
Current Local Time: EST time zone
Elevation: 940 feet
Land area: 0.51 square miles.
Population density: 5,317 people per square mile (average).
242 residents are foreign born (3.2% Europe, 1.8% Asia, 1.4% North America, 1.4% Latin America).
This city:
8.8%
Michigan:
6.9%
Median real estate property taxes paid for housing units with mortgages in 2022: $2,999 (1.2%) Median real estate property taxes paid for housing units with no mortgage in 2022: $4,196 (1.9%)
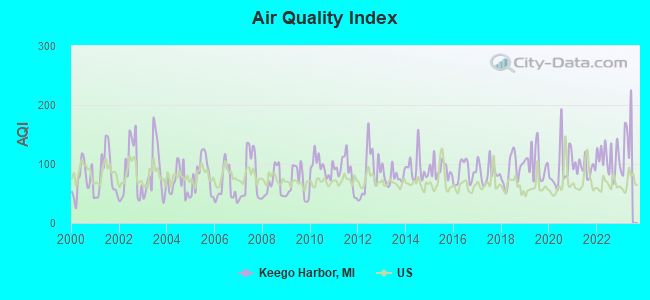
Air Quality Index (AQI) level in 2022 was 110. This is significantly worse than average.
City:
110
U.S.:
73
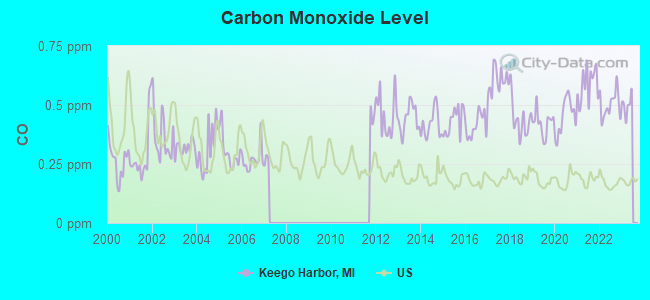
Carbon Monoxide (CO) [ppm] level in 2022 was 0.501. This is significantly worse than average.Closest monitor was 12.4 miles away from the city center.
City:
0.501
U.S.:
0.251
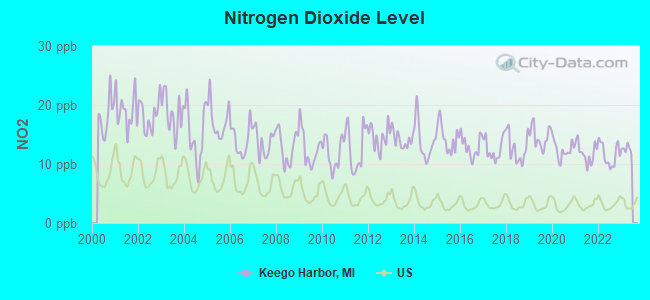
Nitrogen Dioxide (NO2) [ppb] level in 2022 was 11.6. This is significantly worse than average.Closest monitor was 5.0 miles away from the city center.
City:
11.6
U.S.:
5.1
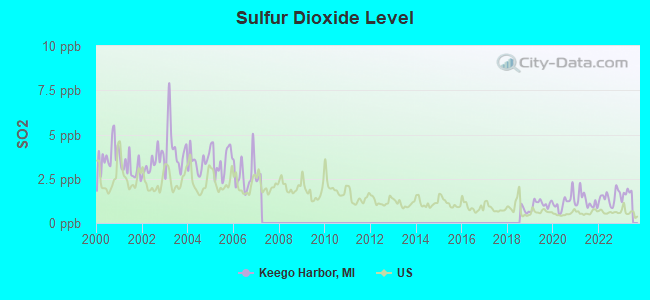
Sulfur Dioxide (SO2) [ppb] level in 2022 was 1.46. This is about average.Closest monitor was 5.0 miles away from the city center.
City:
1.46
U.S.:
1.51
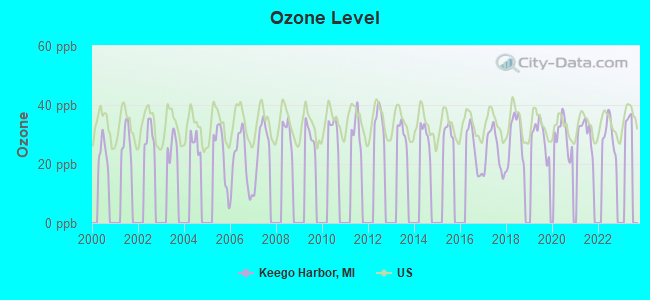
Ozone [ppb] level in 2022 was 30.1. This is about average.Closest monitor was 11.2 miles away from the city center.
City:
30.1
U.S.:
33.3
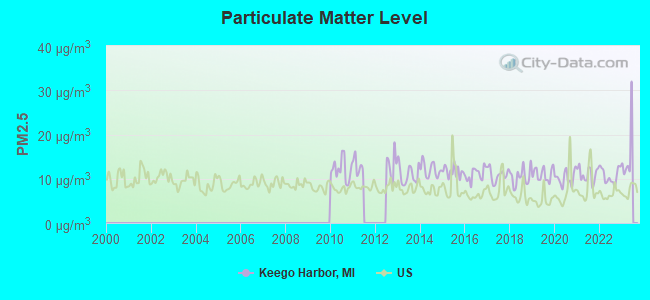
Particulate Matter (PM2.5) [µg/m3] level in 2022 was 10.7. This is worse than average.Closest monitor was 12.9 miles away from the city center.
City:
10.7
U.S.:
8.1
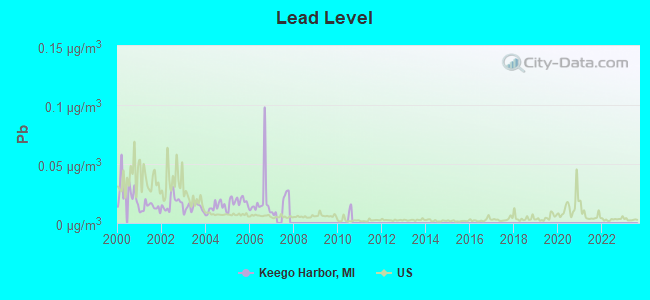
Lead (Pb) [µg/m3] level in 2007 was 0.0173. This is significantly worse than average.Closest monitor was 5.0 miles away from the city center.
City:
0.0173
U.S.:
0.0093
Tornado activity:
Keego Harbor-area historical tornado activity is above Michigan state average. It is 44% greater than the overall U.S. average.
On 3/20/1976, a category F4 (max. wind speeds 207-260 mph) tornado 4.1 miles away from the Keego Harbor city center killed one personand injured 55 peopleand causedbetween $5,000,000 and $50,000,000 in damages.
On 7/4/1957, a category F4 tornado 12.9 miles away from the city center injured 6 peopleand causedbetween $50,000 and $500,000 in damages.
Earthquake activity:
Keego Harbor-area historical earthquake activity is significantly above Michigan state average. It is 47% smaller than the overall U.S. average.
On 9/25/1998 at 19:52:52, a magnitude 5.2 (4.8 MB, 4.3 MS, 5.2 LG, 4.5 MW, Depth: 3.1 mi, Class: Moderate, Intensity: VI - VII) earthquake occurred 169.9 miles away from the city center On 1/31/1986 at 16:46:43, a magnitude 5.0 (5.0 MB) earthquake occurred 131.9 miles away from the city center On 7/12/1986 at 08:19:37, a magnitude 4.5 (4.5 MB, Class: Light, Intensity: IV - V) earthquake occurred 152.8 miles away from Keego Harbor center On 5/2/2015 at 16:23:07, a magnitude 4.2 (4.2 MW, Depth: 2.8 mi) earthquake occurred 109.6 miles away from Keego Harbor center On 7/27/1980 at 18:52:21, a magnitude 5.2 (5.1 MB, 4.7 MS, 5.0 UK, 5.2 UK) earthquake occurred 306.2 miles away from the city center On 8/23/2011 at 17:51:04, a magnitude 5.8 (5.8 MW, Depth: 3.7 mi) earthquake occurred 432.3 miles away from the city center Magnitude types: regional Lg-wave magnitude (LG), body-wave magnitude (MB), surface-wave magnitude (MS), moment magnitude (MW)
Natural disasters:
The number of natural disasters in Oakland County (12) is smaller than the US average (15). Major Disasters (Presidential) Declared: 6 Emergencies Declared: 5
Causes of natural disasters: Storms: 6, Floods: 5, Tornadoes: 3, Winter Storms: 2, Blizzard: 1, Hurricane: 1, Power Outage: 1, Snowstorm: 1, Wind: 1, Other: 1 (Note: some incidents may be assigned to more than one category).
Hospitals and medical centers near Keego Harbor:
GREATER OAKLAND VNA (Home Health Center, about 3 miles away; WATERFORD, MI)
ORCHARD HILLS-A MERCY LIVING CENTER AF (Nursing Home, about 3 miles away; PONTIAC, MI)
ALLIED NURSING CARE INC (Home Health Center, about 3 miles away; WATERFORD, MI)
ADVANCED PROFESSIONAL HOME HEALTH CARE (Home Health Center, about 3 miles away; PONTIAC, MI)
DOCTORS' HOSPITAL OF MICHIGAN Acute Care Hospitals (about 3 miles away; PONTIAC, MI)
NORTH OAKLAND KIDNEY CENTER OF DAVITA (Dialysis Facility, about 3 miles away; PONTIAC, MI)
CLINTON VALLEY CENTER (Hospital, about 3 miles away; PONTIAC, MI)
Amtrak stations near Keego Harbor:
4 miles: PONTIAC (1600 WIDE TRACK DR.) . Services: partially wheelchair accessible, enclosed waiting area, public payphones, vending machines, free short-term parking, free long-term parking, call for taxi service, intercity bus service, public transit connection.
9 miles: BIRMINGHAM (449 S. ETON ST.) . Services: public payphones, free short-term parking, free long-term parking, call for taxi service, public transit connection.
13 miles: ROYAL OAK (201 S. SHERMAN DR.) . Services: enclosed waiting area, public payphones, vending machines, paid short-term parking, taxi stand, intercity bus service, public transit connection.
Colleges/universities with over 2000 students nearest to Keego Harbor:
Oakland Community College (about 5 miles; Bloomfield Hills, MI; Full-time enrollment: 18,956)
Baker College of Auburn Hills (about 6 miles; Auburn Hills, MI; FT enrollment: 2,284)
Oakland University (about 8 miles; Rochester Hills, MI; FT enrollment: 16,449)
Lawrence Technological University (about 11 miles; Southfield, MI; FT enrollment: 2,430)
Schoolcraft College (about 14 miles; Livonia, MI; FT enrollment: 10,867)
Madonna University (about 16 miles; Livonia, MI; FT enrollment: 3,212)
University of Detroit Mercy (about 17 miles; Detroit, MI; FT enrollment: 3,406)
Oakland County has a predicted average indoor radon screening level between 2 and 4 pCi/L (pico curies per liter) - Moderate Potential
Average household size:
This city:
2.3 people
Michigan:
2.5 people
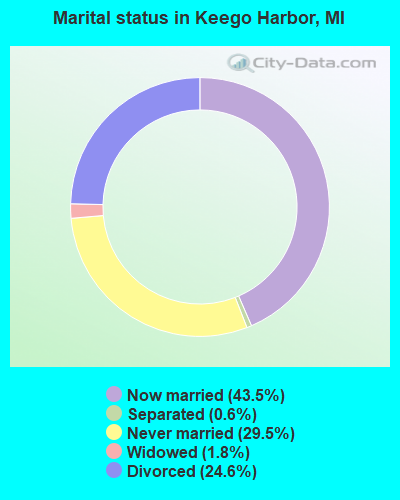
Percentage of family households:
This city:
55.8%
Whole state:
66.0%
Percentage of households with unmarried partners:
This city:
6.7%
Whole state:
6.4%
Likely homosexual households (counted as self-reported same-sex unmarried-partner households)
Lesbian couples: 0.1% of all households
Gay men: 0.2% of all households
Banks with branches in Keego Harbor (2011 data):
PNC Bank, National Association: Keego Harbor Branch at 2907 Orchard Lake, branch established on 1941/10/10. Info updated 2012/03/20: Bank assets: $263,309.6 mil, Deposits: $197,343.0 mil, headquarters in Wilmington, DE, positive income, Commercial Lending Specialization, 3085 total offices, Holding Company: Pnc Financial Services Group, Inc., The
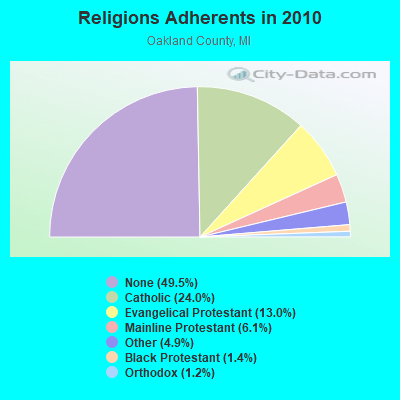
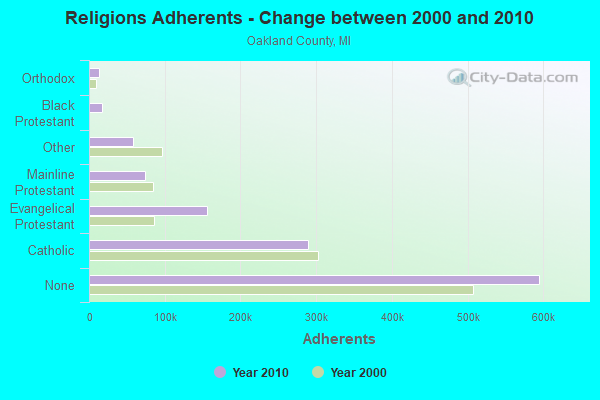
Religion statistics for Keego Harbor, MI (based on Oakland County data)
Religion
Adherents
Congregations
Catholic
289,116
64
Evangelical Protestant
155,826
319
Mainline Protestant
73,373
159
Other
58,590
117
Black Protestant
16,826
35
Orthodox
13,844
23
None
594,787
-
Source: Clifford Grammich, Kirk Hadaway, Richard Houseal, Dale E.Jones, Alexei Krindatch, Richie Stanley and Richard H.Taylor. 2012. 2010 U.S.Religion Census: Religious Congregations & Membership Study. Association of Statisticians of American Religious Bodies. Jones, Dale E., et al. 2002. Congregations and Membership in the United States 2000. Nashville, TN: Glenmary Research Center. Graphs represent county-level data
Call Sign: W8ATO, Previous Call Sign: N0QJU, Licensee ID: L00419805, Grant Date: 07/06/2022, Expiration Date: 07/06/2032, Certifier: John M O'Shaughnessy, Registrant: John M Oshaughnessy, 3024 Summers, Keego Harbor, MI 48320
Call Sign: KD2FDM, Licensee ID: L01827134, Grant Date: 01/03/2024, Expiration Date: 01/03/2034, Certifier: Brian R Nutter, Registrant: Brian R Nutter, 2481 Willow Beach St, Keego Harbor, MI 48320
FAA Registered Aircraft:
1
Aircraft: PIPER J-3 (Category: Land, Seats: 2, Weight: Up to 12,499 Pounds, Speed: 56 mph), Engine: CONT MOTOR C85 SERIES (85 HP) (Reciprocating) N-Number: 98608, N98608, N-98608, Serial Number: 18832, Year manufactured: 1946, Airworthiness Date: 11/05/1955, Certificate Issue Date: 03/07/2016 Registrant (Individual): Angelo M Perez, 2021 Harbor Village Ave, Keego Harbor, MI 48320
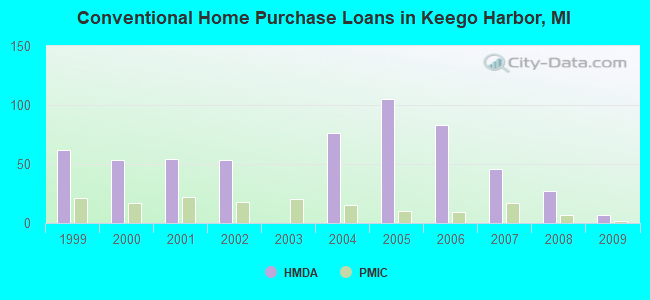
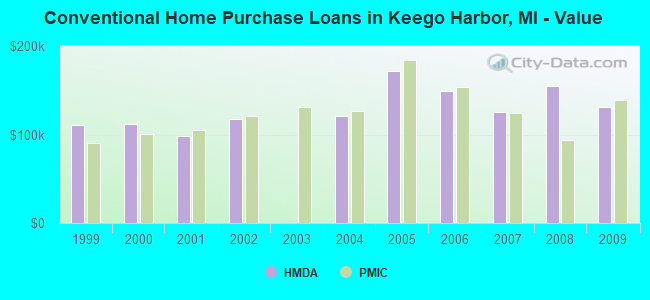
Home Mortgage Disclosure Act Aggregated Statistics For Year 2009 (Based on 1 full tract)
A) FHA, FSA/RHS & VA Home Purchase Loans
B) Conventional Home Purchase Loans
C) Refinancings
D) Home Improvement Loans
F) Non-occupant Loans on < 5 Family Dwellings (A B C & D)
Number
Average Value
Number
Average Value
Number
Average Value
Number
Average Value
Number
Average Value
LOANS ORIGINATED
13
$121,312
7
$130,551
25
$178,909
2
$29,260
3
$89,403
APPLICATIONS APPROVED, NOT ACCEPTED
5
$96,750
1
$132,640
5
$158,584
1
$2,930
0
$0
APPLICATIONS DENIED
4
$163,362
4
$59,738
32
$181,436
0
$0
7
$90,843
APPLICATIONS WITHDRAWN
0
$0
2
$155,560
8
$179,211
0
$0
5
$128,154
FILES CLOSED FOR INCOMPLETENESS
0
$0
0
$0
3
$128,413
0
$0
1
$30,230
Aggregated Statistics For Year 2008 (Based on 1 full tract)
A) FHA, FSA/RHS & VA Home Purchase Loans
B) Conventional Home Purchase Loans
C) Refinancings
D) Home Improvement Loans
F) Non-occupant Loans on < 5 Family Dwellings (A B C & D)
Number
Average Value
Number
Average Value
Number
Average Value
Number
Average Value
Number
Average Value
LOANS ORIGINATED
5
$151,952
27
$155,109
25
$162,641
4
$27,065
19
$97,684
APPLICATIONS APPROVED, NOT ACCEPTED
0
$0
1
$60,470
5
$332,578
1
$7,800
3
$248,700
APPLICATIONS DENIED
0
$0
10
$184,917
38
$158,076
4
$30,965
8
$151,538
APPLICATIONS WITHDRAWN
1
$108,260
3
$112,483
12
$229,277
2
$136,540
3
$98,180
FILES CLOSED FOR INCOMPLETENESS
0
$0
2
$46,325
3
$250,653
0
$0
3
$88,103
Aggregated Statistics For Year 2007 (Based on 1 full tract)
A) FHA, FSA/RHS & VA Home Purchase Loans
B) Conventional Home Purchase Loans
C) Refinancings
D) Home Improvement Loans
F) Non-occupant Loans on < 5 Family Dwellings (A B C & D)
G) Loans On Manufactured Home Dwelling (A B C & D)
Number
Average Value
Number
Average Value
Number
Average Value
Number
Average Value
Number
Average Value
Number
Average Value
LOANS ORIGINATED
3
$137,843
46
$125,135
66
$179,263
8
$86,924
23
$124,966
2
$9,265
APPLICATIONS APPROVED, NOT ACCEPTED
2
$121,915
15
$152,862
22
$206,099
0
$0
6
$88,752
0
$0
APPLICATIONS DENIED
1
$148,250
18
$176,963
81
$153,255
3
$52,017
12
$151,903
2
$15,605
APPLICATIONS WITHDRAWN
0
$0
4
$147,515
28
$111,637
3
$76,073
3
$73,473
0
$0
FILES CLOSED FOR INCOMPLETENESS
0
$0
3
$92,653
13
$113,810
0
$0
0
$0
0
$0
Aggregated Statistics For Year 2006 (Based on 1 full tract)
A) FHA, FSA/RHS & VA Home Purchase Loans
B) Conventional Home Purchase Loans
C) Refinancings
D) Home Improvement Loans
E) Loans on Dwellings For 5+ Families
F) Non-occupant Loans on < 5 Family Dwellings (A B C & D)
G) Loans On Manufactured Home Dwelling (A B C & D)
Number
Average Value
Number
Average Value
Number
Average Value
Number
Average Value
Number
Average Value
Number
Average Value
Number
Average Value
LOANS ORIGINATED
0
$0
83
$148,633
99
$153,831
4
$27,308
1
$183,360
35
$139,747
0
$0
APPLICATIONS APPROVED, NOT ACCEPTED
0
$0
23
$205,661
29
$165,667
4
$41,938
0
$0
13
$184,257
0
$0
APPLICATIONS DENIED
1
$223,340
29
$161,631
70
$144,748
7
$38,454
0
$0
13
$186,132
2
$28,770
APPLICATIONS WITHDRAWN
1
$158,000
9
$108,367
17
$132,813
3
$21,783
0
$0
6
$91,353
0
$0
FILES CLOSED FOR INCOMPLETENESS
0
$0
3
$189,860
12
$156,536
1
$121,910
0
$0
4
$150,195
0
$0
Aggregated Statistics For Year 2005 (Based on 1 full tract)
A) FHA, FSA/RHS & VA Home Purchase Loans
B) Conventional Home Purchase Loans
C) Refinancings
D) Home Improvement Loans
F) Non-occupant Loans on < 5 Family Dwellings (A B C & D)
G) Loans On Manufactured Home Dwelling (A B C & D)
Number
Average Value
Number
Average Value
Number
Average Value
Number
Average Value
Number
Average Value
Number
Average Value
LOANS ORIGINATED
2
$107,285
105
$171,263
123
$126,741
11
$73,325
33
$153,152
0
$0
APPLICATIONS APPROVED, NOT ACCEPTED
0
$0
14
$108,816
26
$146,408
2
$89,240
6
$92,003
0
$0
APPLICATIONS DENIED
2
$110,695
45
$188,016
68
$135,007
8
$42,304
19
$197,267
4
$20,970
APPLICATIONS WITHDRAWN
0
$0
20
$383,244
44
$126,368
4
$31,452
2
$140,930
0
$0
FILES CLOSED FOR INCOMPLETENESS
0
$0
6
$116,712
10
$136,444
0
$0
0
$0
0
$0
Aggregated Statistics For Year 2004 (Based on 1 full tract)
A) FHA, FSA/RHS & VA Home Purchase Loans
B) Conventional Home Purchase Loans
C) Refinancings
D) Home Improvement Loans
F) Non-occupant Loans on < 5 Family Dwellings (A B C & D)
G) Loans On Manufactured Home Dwelling (A B C & D)
Number
Average Value
Number
Average Value
Number
Average Value
Number
Average Value
Number
Average Value
Number
Average Value
LOANS ORIGINATED
3
$123,213
76
$121,040
116
$146,093
15
$118,597
22
$98,018
0
$0
APPLICATIONS APPROVED, NOT ACCEPTED
0
$0
13
$134,666
20
$153,268
1
$5,850
7
$129,854
1
$124,840
APPLICATIONS DENIED
3
$153,447
23
$137,433
72
$145,387
4
$27,065
8
$116,305
0
$0
APPLICATIONS WITHDRAWN
0
$0
6
$77,212
34
$135,624
2
$36,575
4
$98,992
0
$0
FILES CLOSED FOR INCOMPLETENESS
0
$0
1
$161,900
19
$121,810
0
$0
1
$102,410
0
$0
Aggregated Statistics For Year 2002 (Based on 1 full tract)
A) FHA, FSA/RHS & VA Home Purchase Loans
B) Conventional Home Purchase Loans
C) Refinancings
D) Home Improvement Loans
E) Loans on Dwellings For 5+ Families
F) Non-occupant Loans on < 5 Family Dwellings (A B C & D)
Number
Average Value
Number
Average Value
Number
Average Value
Number
Average Value
Number
Average Value
Number
Average Value
LOANS ORIGINATED
8
$131,178
53
$117,993
188
$138,347
13
$31,435
1
$1,170,360
20
$98,846
APPLICATIONS APPROVED, NOT ACCEPTED
0
$0
6
$106,958
30
$140,866
1
$6,830
0
$0
0
$0
APPLICATIONS DENIED
2
$138,980
7
$126,789
51
$131,838
8
$13,289
0
$0
3
$240,573
APPLICATIONS WITHDRAWN
5
$117,426
6
$205,463
46
$149,645
0
$0
0
$0
4
$122,158
FILES CLOSED FOR INCOMPLETENESS
0
$0
3
$137,843
4
$153,610
0
$0
0
$0
2
$177,505
Aggregated Statistics For Year 2001 (Based on 1 full tract)
A) FHA, FSA/RHS & VA Home Purchase Loans
B) Conventional Home Purchase Loans
C) Refinancings
D) Home Improvement Loans
F) Non-occupant Loans on < 5 Family Dwellings (A B C & D)
Number
Average Value
Number
Average Value
Number
Average Value
Number
Average Value
Number
Average Value
LOANS ORIGINATED
18
$119,528
54
$98,740
191
$126,095
11
$31,033
16
$83,083
APPLICATIONS APPROVED, NOT ACCEPTED
0
$0
5
$94,018
28
$129,854
3
$47,790
6
$81,275
APPLICATIONS DENIED
2
$172,140
17
$113,881
31
$101,243
18
$14,142
4
$80,950
APPLICATIONS WITHDRAWN
1
$156,050
4
$112,402
36
$120,016
1
$9,750
1
$115,090
FILES CLOSED FOR INCOMPLETENESS
1
$116,060
2
$125,815
15
$127,309
0
$0
2
$57,545
Aggregated Statistics For Year 2000 (Based on 1 full tract)
A) FHA, FSA/RHS & VA Home Purchase Loans
B) Conventional Home Purchase Loans
C) Refinancings
D) Home Improvement Loans
E) Loans on Dwellings For 5+ Families
F) Non-occupant Loans on < 5 Family Dwellings (A B C & D)
Number
Average Value
Number
Average Value
Number
Average Value
Number
Average Value
Number
Average Value
Number
Average Value
LOANS ORIGINATED
17
$102,406
53
$111,589
71
$86,582
15
$27,633
0
$0
24
$82,088
APPLICATIONS APPROVED, NOT ACCEPTED
0
$0
7
$103,243
20
$90,362
5
$20,482
0
$0
4
$77,538
APPLICATIONS DENIED
2
$110,210
12
$44,945
28
$60,712
6
$27,308
0
$0
4
$39,500
APPLICATIONS WITHDRAWN
1
$77,050
5
$139,468
24
$83,347
1
$58,520
1
$31,210
2
$91,680
FILES CLOSED FOR INCOMPLETENESS
1
$146,300
2
$132,155
7
$104,357
0
$0
0
$0
2
$98,505
Aggregated Statistics For Year 1999 (Based on 1 partial tract)
A) FHA, FSA/RHS & VA Home Purchase Loans
B) Conventional Home Purchase Loans
C) Refinancings
D) Home Improvement Loans
E) Loans on Dwellings For 5+ Families
F) Non-occupant Loans on < 5 Family Dwellings (A B C & D)
Detailed PMIC statistics for the following Tracts:1542.00
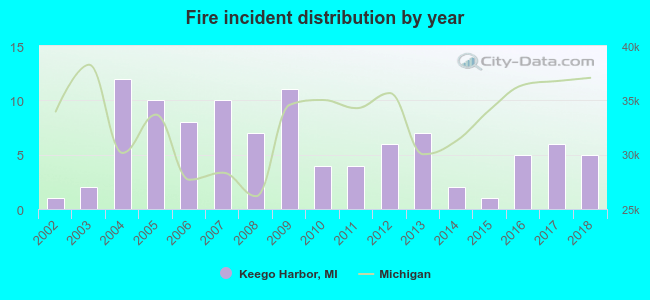
2002 - 2018 National Fire Incident Reporting System (NFIRS) incidents
Based on the data from the years 2002 - 2018 the average number of fires per year is 6. The highest number of fire incidents - 12 took place in 2004, and the least - 1 in 2002. The data has a growing trend.
When looking into fire subcategories, the most reports belonged to: Structure Fires (56.4%), and Outside Fires (32.7%).
Fire incident types reported to NFIRS in Keego Harbor, MI


 Recent articles from our blog. Our writers, many of them Ph.D. graduates or candidates, create easy-to-read articles on a wide variety of topics.

 (3.4 miles
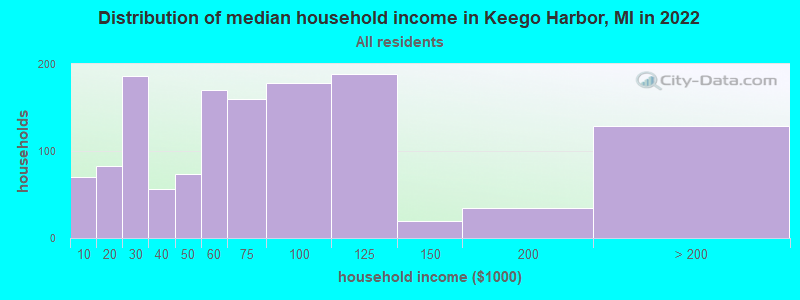


 Based on the data from the years 2002 - 2018 the average number of fires per year is 6. The highest number of fire incidents - 12 took place in 2004, and the least - 1 in 2002. The data has a growing trend.
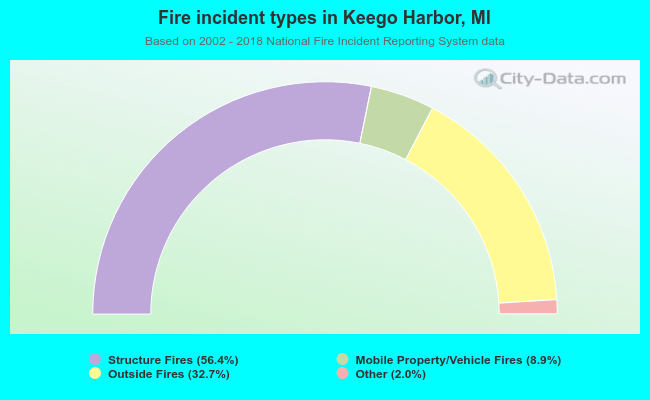 When looking into fire subcategories, the most reports belonged to: Structure Fires (56.4%), and Outside Fires (32.7%).