Lyndon, Kentucky Submit your own pictures of this city and show them to the world
OSM Map
General Map
Google Map
MSN Map
OSM Map
General Map
Google Map
MSN Map
OSM Map
General Map
Google Map
MSN Map
OSM Map
General Map
Google Map
MSN Map
Please wait while loading the map...
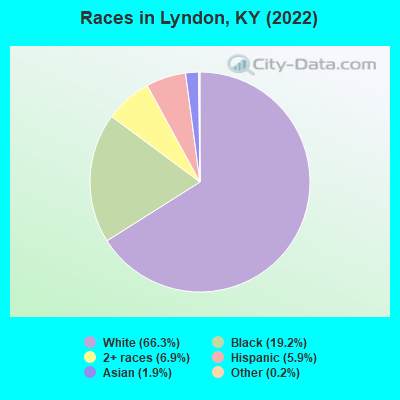
Population in 2022: 10,917 (100% urban, 0% rural). Population change since 2000: +16.5%Males: 5,027 Females: 5,890
March 2022 cost of living index in Lyndon: 89.7 (less than average, U.S. average is 100) Percentage of residents living in poverty in 2022: 9.6%for White Non-Hispanic residents , 28.3% for Black residents , 2.7% for Hispanic or Latino residents , 3.6% for two or more races residents )
Profiles of local businesses
Business Search - 14 Million verified businesses
Data:
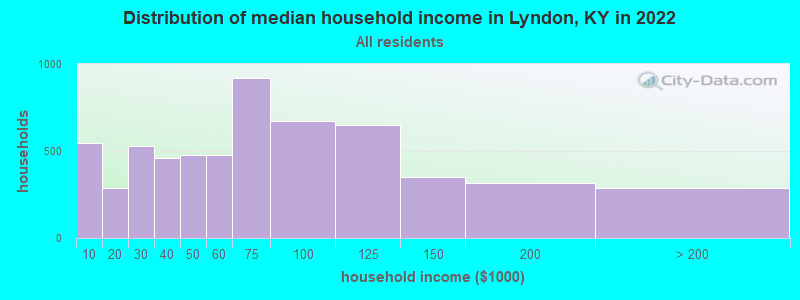
Median household income ($)
Median household income (% change since 2000)
Household income diversity
Ratio of average income to average house value (%)
Ratio of average income to average rent
Median household income ($) - White
Median household income ($) - Black or African American
Median household income ($) - Asian
Median household income ($) - Hispanic or Latino
Median household income ($) - American Indian and Alaska Native
Median household income ($) - Multirace
Median household income ($) - Other Race
Median household income for houses/condos with a mortgage ($)
Median household income for apartments without a mortgage ($)
Races - White alone (%)
Races - White alone (% change since 2000)
Races - Black alone (%)
Races - Black alone (% change since 2000)
Races - American Indian alone (%)
Races - American Indian alone (% change since 2000)
Races - Asian alone (%)
Races - Asian alone (% change since 2000)
Races - Hispanic (%)
Races - Hispanic (% change since 2000)
Races - Native Hawaiian and Other Pacific Islander alone (%)
Races - Native Hawaiian and Other Pacific Islander alone (% change since 2000)
Races - Two or more races (%)
Races - Two or more races (% change since 2000)
Races - Other race alone (%)
Races - Other race alone (% change since 2000)
Racial diversity
Unemployment (%)
Unemployment (% change since 2000)
Unemployment (%) - White
Unemployment (%) - Black or African American
Unemployment (%) - Asian
Unemployment (%) - Hispanic or Latino
Unemployment (%) - American Indian and Alaska Native
Unemployment (%) - Multirace
Unemployment (%) - Other Race
Population density (people per square mile)
Population - Males (%)
Population - Females (%)
Population - Males (%) - White
Population - Males (%) - Black or African American
Population - Males (%) - Asian
Population - Males (%) - Hispanic or Latino
Population - Males (%) - American Indian and Alaska Native
Population - Males (%) - Multirace
Population - Males (%) - Other Race
Population - Females (%) - White
Population - Females (%) - Black or African American
Population - Females (%) - Asian
Population - Females (%) - Hispanic or Latino
Population - Females (%) - American Indian and Alaska Native
Population - Females (%) - Multirace
Population - Females (%) - Other Race
Coronavirus confirmed cases (May 01, 2024)
Deaths caused by coronavirus (May 01, 2024)
Coronavirus confirmed cases (per 100k population) (May 01, 2024)
Deaths caused by coronavirus (per 100k population) (May 01, 2024)
Daily increase in number of cases (May 01, 2024)
Weekly increase in number of cases (May 01, 2024)
Cases doubled (in days) (May 01, 2024)
Hospitalized patients (Apr 18, 2022)
Negative test results (Apr 18, 2022)
Total test results (Apr 18, 2022)
COVID Vaccine doses distributed (per 100k population) (Sep 19, 2023)
COVID Vaccine doses administered (per 100k population) (Sep 19, 2023)
COVID Vaccine doses distributed (Sep 19, 2023)
COVID Vaccine doses administered (Sep 19, 2023)
Likely homosexual households (%)
Likely homosexual households (% change since 2000)
Likely homosexual households - Lesbian couples (%)
Likely homosexual households - Lesbian couples (% change since 2000)
Likely homosexual households - Gay men (%)
Likely homosexual households - Gay men (% change since 2000)
Cost of living index
Median gross rent ($)
Median contract rent ($)
Median monthly housing costs ($)
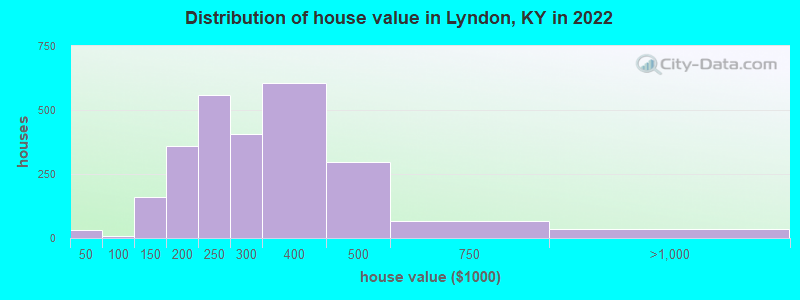
Median house or condo value ($)
Median house or condo value ($ change since 2000)
Mean house or condo value by units in structure - 1, detached ($)
Mean house or condo value by units in structure - 1, attached ($)
Mean house or condo value by units in structure - 2 ($)
Mean house or condo value by units in structure by units in structure - 3 or 4 ($)
Mean house or condo value by units in structure - 5 or more ($)
Mean house or condo value by units in structure - Boat, RV, van, etc. ($)
Mean house or condo value by units in structure - Mobile home ($)
Median house or condo value ($) - White
Median house or condo value ($) - Black or African American
Median house or condo value ($) - Asian
Median house or condo value ($) - Hispanic or Latino
Median house or condo value ($) - American Indian and Alaska Native
Median house or condo value ($) - Multirace
Median house or condo value ($) - Other Race
Median resident age
Resident age diversity
Median resident age - Males
Median resident age - Females
Median resident age - White
Median resident age - Black or African American
Median resident age - Asian
Median resident age - Hispanic or Latino
Median resident age - American Indian and Alaska Native
Median resident age - Multirace
Median resident age - Other Race
Median resident age - Males - White
Median resident age - Males - Black or African American
Median resident age - Males - Asian
Median resident age - Males - Hispanic or Latino
Median resident age - Males - American Indian and Alaska Native
Median resident age - Males - Multirace
Median resident age - Males - Other Race
Median resident age - Females - White
Median resident age - Females - Black or African American
Median resident age - Females - Asian
Median resident age - Females - Hispanic or Latino
Median resident age - Females - American Indian and Alaska Native
Median resident age - Females - Multirace
Median resident age - Females - Other Race
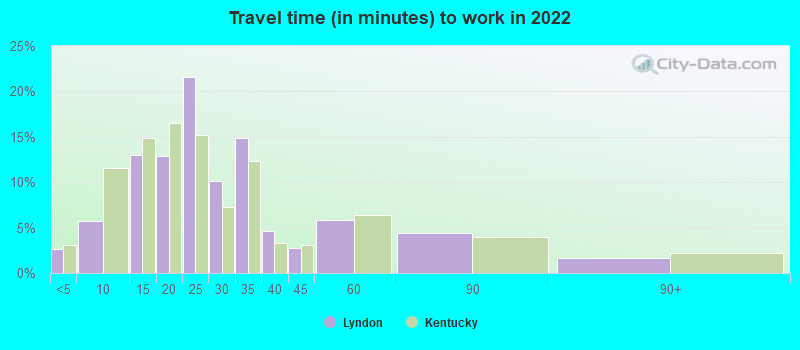
Commute - mean travel time to work (minutes)
Travel time to work - Less than 5 minutes (%)
Travel time to work - Less than 5 minutes (% change since 2000)
Travel time to work - 5 to 9 minutes (%)
Travel time to work - 5 to 9 minutes (% change since 2000)
Travel time to work - 10 to 19 minutes (%)
Travel time to work - 10 to 19 minutes (% change since 2000)
Travel time to work - 20 to 29 minutes (%)
Travel time to work - 20 to 29 minutes (% change since 2000)
Travel time to work - 30 to 39 minutes (%)
Travel time to work - 30 to 39 minutes (% change since 2000)
Travel time to work - 40 to 59 minutes (%)
Travel time to work - 40 to 59 minutes (% change since 2000)
Travel time to work - 60 to 89 minutes (%)
Travel time to work - 60 to 89 minutes (% change since 2000)
Travel time to work - 90 or more minutes (%)
Travel time to work - 90 or more minutes (% change since 2000)
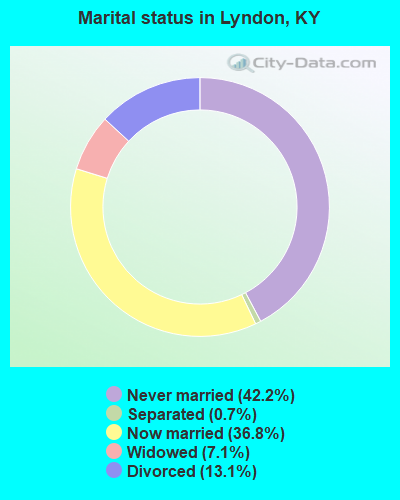
Marital status - Never married (%)
Marital status - Now married (%)
Marital status - Separated (%)
Marital status - Widowed (%)
Marital status - Divorced (%)
Median family income ($)
Median family income (% change since 2000)
Median non-family income ($)
Median non-family income (% change since 2000)
Median per capita income ($)
Median per capita income (% change since 2000)
Median family income ($) - White
Median family income ($) - Black or African American
Median family income ($) - Asian
Median family income ($) - Hispanic or Latino
Median family income ($) - American Indian and Alaska Native
Median family income ($) - Multirace
Median family income ($) - Other Race
Median year house/condo built
Median year apartment built
Year house built - Built 2005 or later (%)
Year house built - Built 2000 to 2004 (%)
Year house built - Built 1990 to 1999 (%)
Year house built - Built 1980 to 1989 (%)
Year house built - Built 1970 to 1979 (%)
Year house built - Built 1960 to 1969 (%)
Year house built - Built 1950 to 1959 (%)
Year house built - Built 1940 to 1949 (%)
Year house built - Built 1939 or earlier (%)
Average household size
Household density (households per square mile)
Average household size - White
Average household size - Black or African American
Average household size - Asian
Average household size - Hispanic or Latino
Average household size - American Indian and Alaska Native
Average household size - Multirace
Average household size - Other Race
Occupied housing units (%)
Vacant housing units (%)
Owner occupied housing units (%)
Renter occupied housing units (%)
Vacancy status - For rent (%)
Vacancy status - For sale only (%)
Vacancy status - Rented or sold, not occupied (%)
Vacancy status - For seasonal, recreational, or occasional use (%)
Vacancy status - For migrant workers (%)
Vacancy status - Other vacant (%)
Residents with income below the poverty level (%)
Residents with income below 50% of the poverty level (%)
Children below poverty level (%)
Poor families by family type - Married-couple family (%)
Poor families by family type - Male, no wife present (%)
Poor families by family type - Female, no husband present (%)
Poverty status for native-born residents (%)
Poverty status for foreign-born residents (%)
Poverty among high school graduates not in families (%)
Poverty among people who did not graduate high school not in families (%)
Residents with income below the poverty level (%) - White
Residents with income below the poverty level (%) - Black or African American
Residents with income below the poverty level (%) - Asian
Residents with income below the poverty level (%) - Hispanic or Latino
Residents with income below the poverty level (%) - American Indian and Alaska Native
Residents with income below the poverty level (%) - Multirace
Residents with income below the poverty level (%) - Other Race
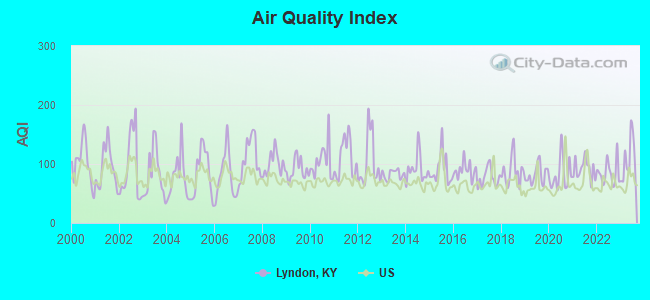
Air pollution - Air Quality Index (AQI)
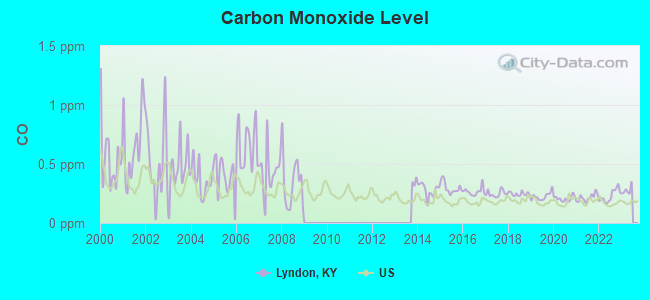
Air pollution - CO
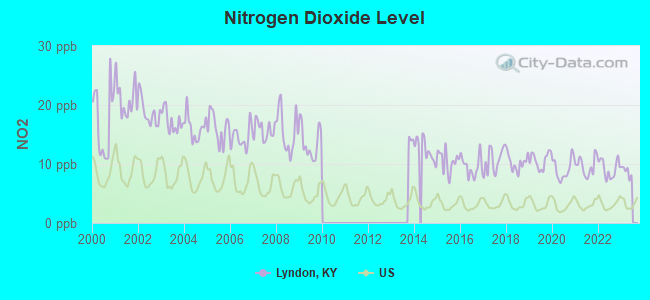
Air pollution - NO2
Air pollution - SO2
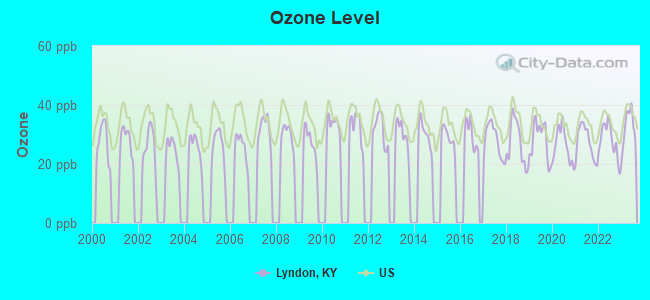
Air pollution - Ozone
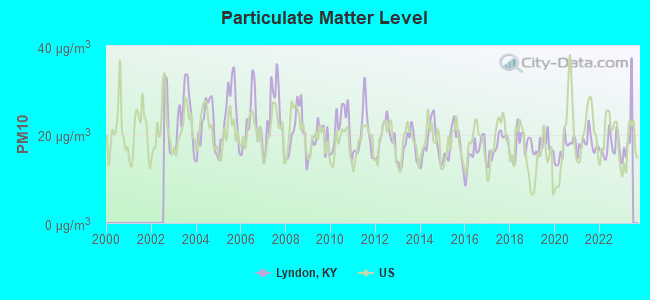
Air pollution - PM10
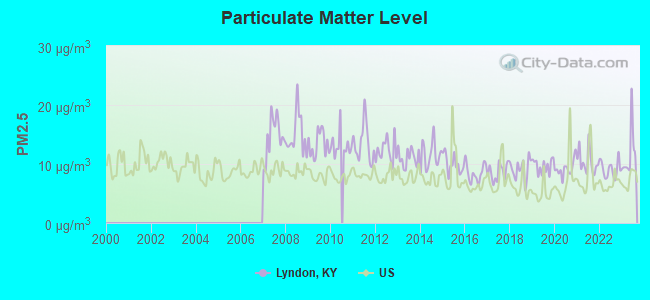
Air pollution - PM25
Air pollution - Pb
Crime - Murders per 100,000 population
Crime - Rapes per 100,000 population
Crime - Robberies per 100,000 population
Crime - Assaults per 100,000 population
Crime - Burglaries per 100,000 population
Crime - Thefts per 100,000 population
Crime - Auto thefts per 100,000 population
Crime - Arson per 100,000 population
Crime - City-data.com crime index
Crime - Violent crime index
Crime - Property crime index
Crime - Murders per 100,000 population (5 year average)
Crime - Rapes per 100,000 population (5 year average)
Crime - Robberies per 100,000 population (5 year average)
Crime - Assaults per 100,000 population (5 year average)
Crime - Burglaries per 100,000 population (5 year average)
Crime - Thefts per 100,000 population (5 year average)
Crime - Auto thefts per 100,000 population (5 year average)
Crime - Arson per 100,000 population (5 year average)
Crime - City-data.com crime index (5 year average)
Crime - Violent crime index (5 year average)
Crime - Property crime index (5 year average)
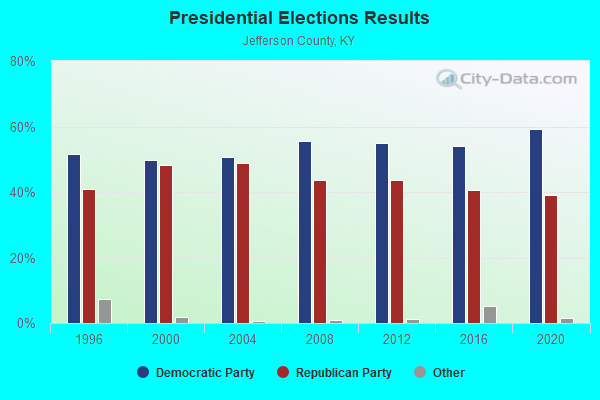
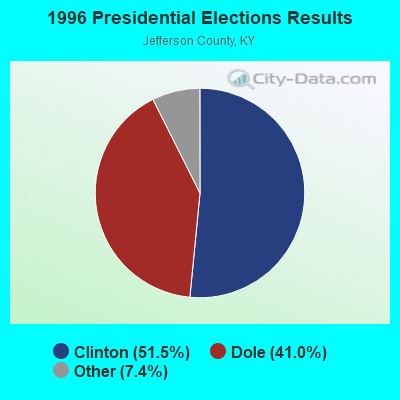
1996 Presidential Elections Results (%) - Democratic Party (Clinton)
1996 Presidential Elections Results (%) - Republican Party (Dole)
1996 Presidential Elections Results (%) - Other
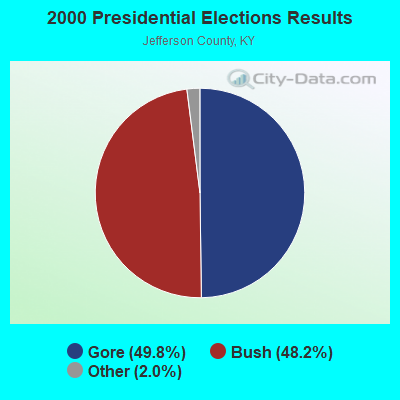
2000 Presidential Elections Results (%) - Democratic Party (Gore)
2000 Presidential Elections Results (%) - Republican Party (Bush)
2000 Presidential Elections Results (%) - Other
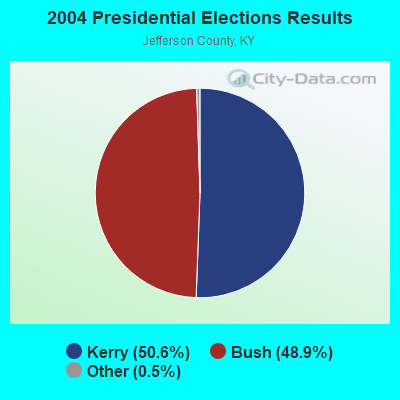
2004 Presidential Elections Results (%) - Democratic Party (Kerry)
2004 Presidential Elections Results (%) - Republican Party (Bush)
2004 Presidential Elections Results (%) - Other
2008 Presidential Elections Results (%) - Democratic Party (Obama)
2008 Presidential Elections Results (%) - Republican Party (McCain)
2008 Presidential Elections Results (%) - Other
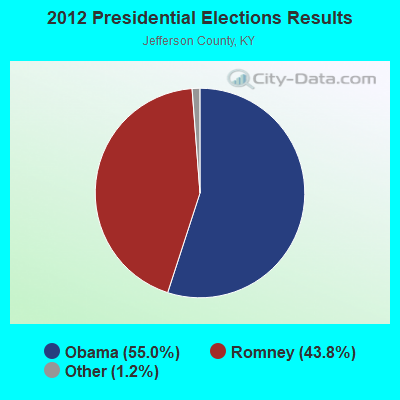
2012 Presidential Elections Results (%) - Democratic Party (Obama)
2012 Presidential Elections Results (%) - Republican Party (Romney)
2012 Presidential Elections Results (%) - Other
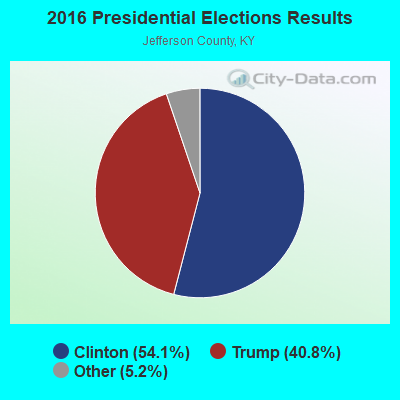
2016 Presidential Elections Results (%) - Democratic Party (Clinton)
2016 Presidential Elections Results (%) - Republican Party (Trump)
2016 Presidential Elections Results (%) - Other
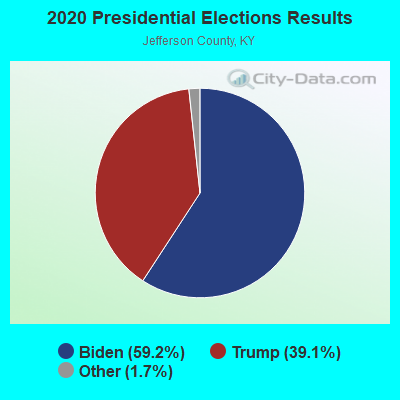
2020 Presidential Elections Results (%) - Democratic Party (Biden)
2020 Presidential Elections Results (%) - Republican Party (Trump)
2020 Presidential Elections Results (%) - Other
Ancestries Reported - Arab (%)
Ancestries Reported - Czech (%)
Ancestries Reported - Danish (%)
Ancestries Reported - Dutch (%)
Ancestries Reported - English (%)
Ancestries Reported - French (%)
Ancestries Reported - French Canadian (%)
Ancestries Reported - German (%)
Ancestries Reported - Greek (%)
Ancestries Reported - Hungarian (%)
Ancestries Reported - Irish (%)
Ancestries Reported - Italian (%)
Ancestries Reported - Lithuanian (%)
Ancestries Reported - Norwegian (%)
Ancestries Reported - Polish (%)
Ancestries Reported - Portuguese (%)
Ancestries Reported - Russian (%)
Ancestries Reported - Scotch-Irish (%)
Ancestries Reported - Scottish (%)
Ancestries Reported - Slovak (%)
Ancestries Reported - Subsaharan African (%)
Ancestries Reported - Swedish (%)
Ancestries Reported - Swiss (%)
Ancestries Reported - Ukrainian (%)
Ancestries Reported - United States (%)
Ancestries Reported - Welsh (%)
Ancestries Reported - West Indian (%)
Ancestries Reported - Other (%)
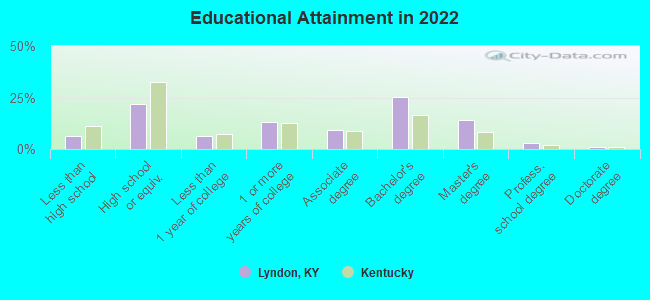
Educational Attainment - No schooling completed (%)
Educational Attainment - Less than high school (%)
Educational Attainment - High school or equivalent (%)
Educational Attainment - Less than 1 year of college (%)
Educational Attainment - 1 or more years of college (%)
Educational Attainment - Associate degree (%)
Educational Attainment - Bachelor's degree (%)
Educational Attainment - Master's degree (%)
Educational Attainment - Professional school degree (%)
Educational Attainment - Doctorate degree (%)
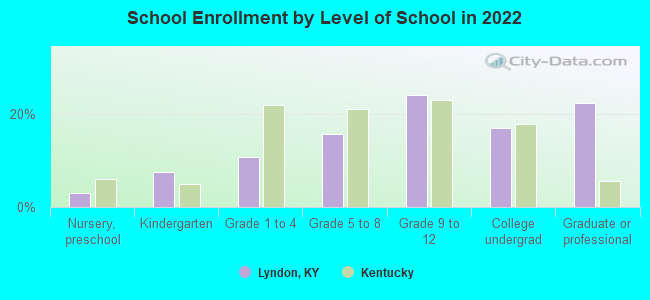
School Enrollment - Nursery, preschool (%)
School Enrollment - Kindergarten (%)
School Enrollment - Grade 1 to 4 (%)
School Enrollment - Grade 5 to 8 (%)
School Enrollment - Grade 9 to 12 (%)
School Enrollment - College undergrad (%)
School Enrollment - Graduate or professional (%)
School Enrollment - Not enrolled in school (%)
School enrollment - Public schools (%)
School enrollment - Private schools (%)
School enrollment - Not enrolled (%)
Median number of rooms in houses and condos
Median number of rooms in apartments
Housing units lacking complete plumbing facilities (%)
Housing units lacking complete kitchen facilities (%)
Density of houses
Urban houses (%)
Rural houses (%)
Households with people 60 years and over (%)
Households with people 65 years and over (%)
Households with people 75 years and over (%)
Households with one or more nonrelatives (%)
Households with no nonrelatives (%)
Population in households (%)
Family households (%)
Nonfamily households (%)
Population in families (%)
Family households with own children (%)
Median number of bedrooms in owner occupied houses
Mean number of bedrooms in owner occupied houses
Median number of bedrooms in renter occupied houses
Mean number of bedrooms in renter occupied houses
Median number of vehichles in owner occupied houses
Mean number of vehichles in owner occupied houses
Median number of vehichles in renter occupied houses
Mean number of vehichles in renter occupied houses
Mortgage status - with mortgage (%)
Mortgage status - with second mortgage (%)
Mortgage status - with home equity loan (%)
Mortgage status - with both second mortgage and home equity loan (%)
Mortgage status - without a mortgage (%)
Average family size
Average family size - White
Average family size - Black or African American
Average family size - Asian
Average family size - Hispanic or Latino
Average family size - American Indian and Alaska Native
Average family size - Multirace
Average family size - Other Race
Geographical mobility - Same house 1 year ago (%)
Geographical mobility - Moved within same county (%)
Geographical mobility - Moved from different county within same state (%)
Geographical mobility - Moved from different state (%)
Geographical mobility - Moved from abroad (%)
Place of birth - Born in state of residence (%)
Place of birth - Born in other state (%)
Place of birth - Native, outside of US (%)
Place of birth - Foreign born (%)
Housing units in structures - 1, detached (%)
Housing units in structures - 1, attached (%)
Housing units in structures - 2 (%)
Housing units in structures - 3 or 4 (%)
Housing units in structures - 5 to 9 (%)
Housing units in structures - 10 to 19 (%)
Housing units in structures - 20 to 49 (%)
Housing units in structures - 50 or more (%)
Housing units in structures - Mobile home (%)
Housing units in structures - Boat, RV, van, etc. (%)
House/condo owner moved in on average (years ago)
Renter moved in on average (years ago)
Year householder moved into unit - Moved in 1999 to March 2000 (%)
Year householder moved into unit - Moved in 1995 to 1998 (%)
Year householder moved into unit - Moved in 1990 to 1994 (%)
Year householder moved into unit - Moved in 1980 to 1989 (%)
Year householder moved into unit - Moved in 1970 to 1979 (%)
Year householder moved into unit - Moved in 1969 or earlier (%)
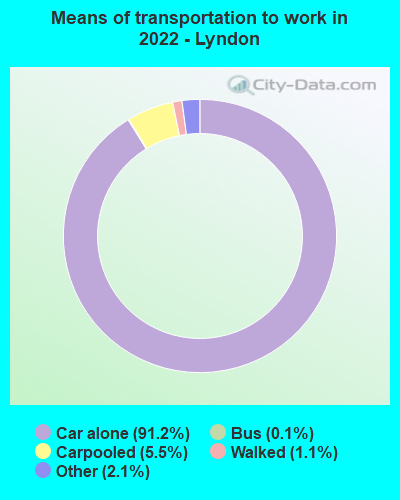
Means of transportation to work - Drove car alone (%)
Means of transportation to work - Carpooled (%)
Means of transportation to work - Public transportation (%)
Means of transportation to work - Bus or trolley bus (%)
Means of transportation to work - Streetcar or trolley car (%)
Means of transportation to work - Subway or elevated (%)
Means of transportation to work - Railroad (%)
Means of transportation to work - Ferryboat (%)
Means of transportation to work - Taxicab (%)
Means of transportation to work - Motorcycle (%)
Means of transportation to work - Bicycle (%)
Means of transportation to work - Walked (%)
Means of transportation to work - Other means (%)
Working at home (%)
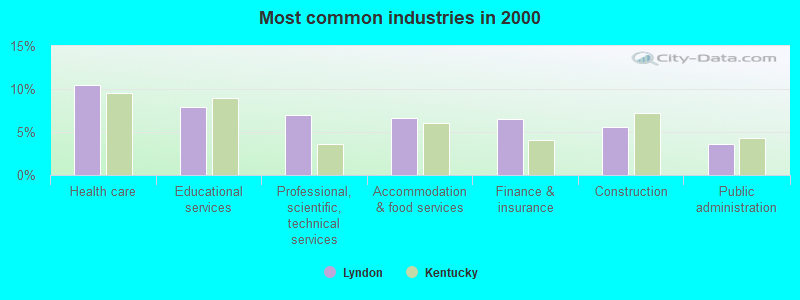
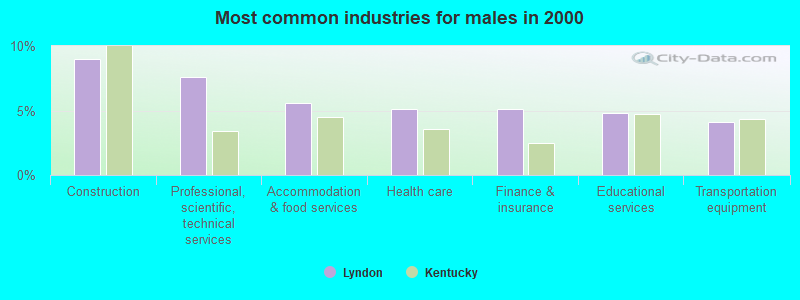
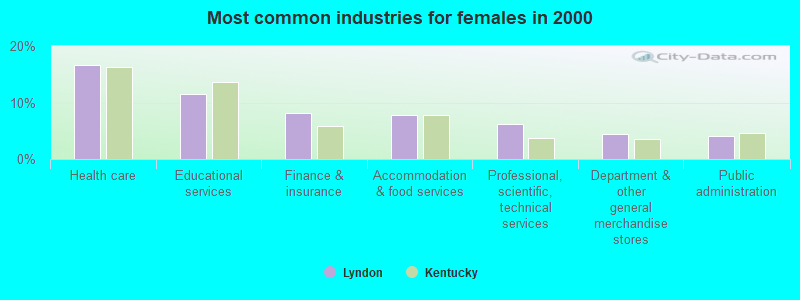
Industry diversity
Most Common Industries - Agriculture, forestry, fishing and hunting, and mining (%)
Most Common Industries - Agriculture, forestry, fishing and hunting (%)
Most Common Industries - Mining, quarrying, and oil and gas extraction (%)
Most Common Industries - Construction (%)
Most Common Industries - Manufacturing (%)
Most Common Industries - Wholesale trade (%)
Most Common Industries - Retail trade (%)
Most Common Industries - Transportation and warehousing, and utilities (%)
Most Common Industries - Transportation and warehousing (%)
Most Common Industries - Utilities (%)
Most Common Industries - Information (%)
Most Common Industries - Finance and insurance, and real estate and rental and leasing (%)
Most Common Industries - Finance and insurance (%)
Most Common Industries - Real estate and rental and leasing (%)
Most Common Industries - Professional, scientific, and management, and administrative and waste management services (%)
Most Common Industries - Professional, scientific, and technical services (%)
Most Common Industries - Management of companies and enterprises (%)
Most Common Industries - Administrative and support and waste management services (%)
Most Common Industries - Educational services, and health care and social assistance (%)
Most Common Industries - Educational services (%)
Most Common Industries - Health care and social assistance (%)
Most Common Industries - Arts, entertainment, and recreation, and accommodation and food services (%)
Most Common Industries - Arts, entertainment, and recreation (%)
Most Common Industries - Accommodation and food services (%)
Most Common Industries - Other services, except public administration (%)
Most Common Industries - Public administration (%)
Occupation diversity
Most Common Occupations - Management, business, science, and arts occupations (%)
Most Common Occupations - Management, business, and financial occupations (%)
Most Common Occupations - Management occupations (%)
Most Common Occupations - Business and financial operations occupations (%)
Most Common Occupations - Computer, engineering, and science occupations (%)
Most Common Occupations - Computer and mathematical occupations (%)
Most Common Occupations - Architecture and engineering occupations (%)
Most Common Occupations - Life, physical, and social science occupations (%)
Most Common Occupations - Education, legal, community service, arts, and media occupations (%)
Most Common Occupations - Community and social service occupations (%)
Most Common Occupations - Legal occupations (%)
Most Common Occupations - Education, training, and library occupations (%)
Most Common Occupations - Arts, design, entertainment, sports, and media occupations (%)
Most Common Occupations - Healthcare practitioners and technical occupations (%)
Most Common Occupations - Health diagnosing and treating practitioners and other technical occupations (%)
Most Common Occupations - Health technologists and technicians (%)
Most Common Occupations - Service occupations (%)
Most Common Occupations - Healthcare support occupations (%)
Most Common Occupations - Protective service occupations (%)
Most Common Occupations - Fire fighting and prevention, and other protective service workers including supervisors (%)
Most Common Occupations - Law enforcement workers including supervisors (%)
Most Common Occupations - Food preparation and serving related occupations (%)
Most Common Occupations - Building and grounds cleaning and maintenance occupations (%)
Most Common Occupations - Personal care and service occupations (%)
Most Common Occupations - Sales and office occupations (%)
Most Common Occupations - Sales and related occupations (%)
Most Common Occupations - Office and administrative support occupations (%)
Most Common Occupations - Natural resources, construction, and maintenance occupations (%)
Most Common Occupations - Farming, fishing, and forestry occupations (%)
Most Common Occupations - Construction and extraction occupations (%)
Most Common Occupations - Installation, maintenance, and repair occupations (%)
Most Common Occupations - Production, transportation, and material moving occupations (%)
Most Common Occupations - Production occupations (%)
Most Common Occupations - Transportation occupations (%)
Most Common Occupations - Material moving occupations (%)
People in Group quarters - Institutionalized population (%)
People in Group quarters - Correctional institutions (%)
People in Group quarters - Federal prisons and detention centers (%)
People in Group quarters - Halfway houses (%)
People in Group quarters - Local jails and other confinement facilities (including police lockups) (%)
People in Group quarters - Military disciplinary barracks (%)
People in Group quarters - State prisons (%)
People in Group quarters - Other types of correctional institutions (%)
People in Group quarters - Nursing homes (%)
People in Group quarters - Hospitals/wards, hospices, and schools for the handicapped (%)
People in Group quarters - Hospitals/wards and hospices for chronically ill (%)
People in Group quarters - Hospices or homes for chronically ill (%)
People in Group quarters - Military hospitals or wards for chronically ill (%)
People in Group quarters - Other hospitals or wards for chronically ill (%)
People in Group quarters - Hospitals or wards for drug/alcohol abuse (%)
People in Group quarters - Mental (Psychiatric) hospitals or wards (%)
People in Group quarters - Schools, hospitals, or wards for the mentally retarded (%)
People in Group quarters - Schools, hospitals, or wards for the physically handicapped (%)
People in Group quarters - Institutions for the deaf (%)
People in Group quarters - Institutions for the blind (%)
People in Group quarters - Orthopedic wards and institutions for the physically handicapped (%)
People in Group quarters - Wards in general hospitals for patients who have no usual home elsewhere (%)
People in Group quarters - Wards in military hospitals for patients who have no usual home elsewhere (%)
People in Group quarters - Juvenile institutions (%)
People in Group quarters - Long-term care (%)
People in Group quarters - Homes for abused, dependent, and neglected children (%)
People in Group quarters - Residential treatment centers for emotionally disturbed children (%)
People in Group quarters - Training schools for juvenile delinquents (%)
People in Group quarters - Short-term care, detention or diagnostic centers for delinquent children (%)
People in Group quarters - Type of juvenile institution unknown (%)
People in Group quarters - Noninstitutionalized population (%)
People in Group quarters - College dormitories (includes college quarters off campus) (%)
People in Group quarters - Military quarters (%)
People in Group quarters - On base (%)
People in Group quarters - Barracks, unaccompanied personnel housing (UPH), (Enlisted/Officer), ;and similar group living quarters for military personnel (%)
People in Group quarters - Transient quarters for temporary residents (%)
People in Group quarters - Military ships (%)
People in Group quarters - Group homes (%)
People in Group quarters - Homes or halfway houses for drug/alcohol abuse (%)
People in Group quarters - Homes for the mentally ill (%)
People in Group quarters - Homes for the mentally retarded (%)
People in Group quarters - Homes for the physically handicapped (%)
People in Group quarters - Other group homes (%)
People in Group quarters - Religious group quarters (%)
People in Group quarters - Dormitories (%)
People in Group quarters - Agriculture workers' dormitories on farms (%)
People in Group quarters - Job Corps and vocational training facilities (%)
People in Group quarters - Other workers' dormitories (%)
People in Group quarters - Crews of maritime vessels (%)
People in Group quarters - Other nonhousehold living situations (%)
People in Group quarters - Other noninstitutional group quarters (%)
Residents speaking English at home (%)
Residents speaking English at home - Born in the United States (%)
Residents speaking English at home - Native, born elsewhere (%)
Residents speaking English at home - Foreign born (%)
Residents speaking Spanish at home (%)
Residents speaking Spanish at home - Born in the United States (%)
Residents speaking Spanish at home - Native, born elsewhere (%)
Residents speaking Spanish at home - Foreign born (%)
Residents speaking other language at home (%)
Residents speaking other language at home - Born in the United States (%)
Residents speaking other language at home - Native, born elsewhere (%)
Residents speaking other language at home - Foreign born (%)
Class of Workers - Employee of private company (%)
Class of Workers - Self-employed in own incorporated business (%)
Class of Workers - Private not-for-profit wage and salary workers (%)
Class of Workers - Local government workers (%)
Class of Workers - State government workers (%)
Class of Workers - Federal government workers (%)
Class of Workers - Self-employed workers in own not incorporated business and Unpaid family workers (%)
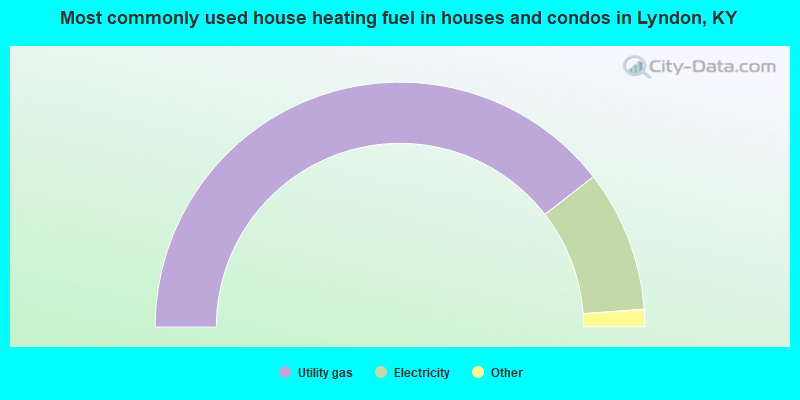
House heating fuel used in houses and condos - Utility gas (%)
House heating fuel used in houses and condos - Bottled, tank, or LP gas (%)
House heating fuel used in houses and condos - Electricity (%)
House heating fuel used in houses and condos - Fuel oil, kerosene, etc. (%)
House heating fuel used in houses and condos - Coal or coke (%)
House heating fuel used in houses and condos - Wood (%)
House heating fuel used in houses and condos - Solar energy (%)
House heating fuel used in houses and condos - Other fuel (%)
House heating fuel used in houses and condos - No fuel used (%)
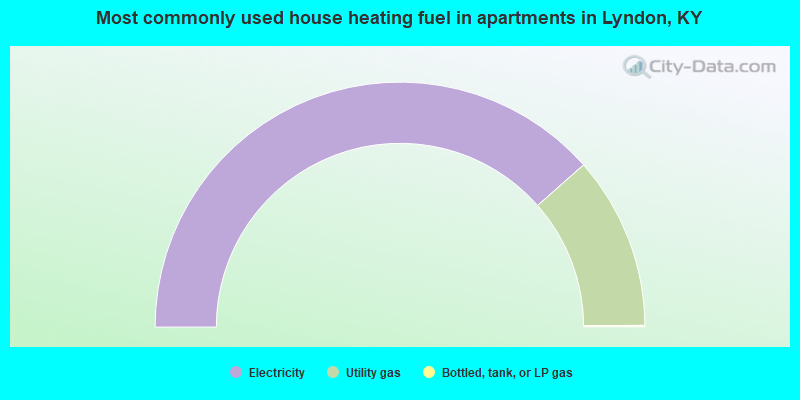
House heating fuel used in apartments - Utility gas (%)
House heating fuel used in apartments - Bottled, tank, or LP gas (%)
House heating fuel used in apartments - Electricity (%)
House heating fuel used in apartments - Fuel oil, kerosene, etc. (%)
House heating fuel used in apartments - Coal or coke (%)
House heating fuel used in apartments - Wood (%)
House heating fuel used in apartments - Solar energy (%)
House heating fuel used in apartments - Other fuel (%)
House heating fuel used in apartments - No fuel used (%)
Armed forces status - In Armed Forces (%)
Armed forces status - Civilian (%)
Armed forces status - Civilian - Veteran (%)
Armed forces status - Civilian - Nonveteran (%)
Fatal accidents locations in years 2005-2021
Fatal accidents locations in 2005
Fatal accidents locations in 2006
Fatal accidents locations in 2007
Fatal accidents locations in 2008
Fatal accidents locations in 2009
Fatal accidents locations in 2010
Fatal accidents locations in 2011
Fatal accidents locations in 2012
Fatal accidents locations in 2013
Fatal accidents locations in 2014
Fatal accidents locations in 2015
Fatal accidents locations in 2016
Fatal accidents locations in 2017
Fatal accidents locations in 2018
Fatal accidents locations in 2019
Fatal accidents locations in 2020
Fatal accidents locations in 2021
Alcohol use - People drinking some alcohol every month (%)
Alcohol use - People not drinking at all (%)
Alcohol use - Average days/month drinking alcohol
Alcohol use - Average drinks/week
Alcohol use - Average days/year people drink much
Audiometry - Average condition of hearing (%)
Audiometry - People that can hear a whisper from across a quiet room (%)
Audiometry - People that can hear normal voice from across a quiet room (%)
Audiometry - Ears ringing, roaring, buzzing (%)
Audiometry - Had a job exposure to loud noise (%)
Audiometry - Had off-work exposure to loud noise (%)
Blood Pressure & Cholesterol - Has high blood pressure (%)
Blood Pressure & Cholesterol - Checking blood pressure at home (%)
Blood Pressure & Cholesterol - Frequently checking blood cholesterol (%)
Blood Pressure & Cholesterol - Has high cholesterol level (%)
Consumer Behavior - Money monthly spent on food at supermarket/grocery store
Consumer Behavior - Money monthly spent on food at other stores
Consumer Behavior - Money monthly spent on eating out
Consumer Behavior - Money monthly spent on carryout/delivered foods
Consumer Behavior - Income spent on food at supermarket/grocery store (%)
Consumer Behavior - Income spent on food at other stores (%)
Consumer Behavior - Income spent on eating out (%)
Consumer Behavior - Income spent on carryout/delivered foods (%)
Current Health Status - General health condition (%)
Current Health Status - Blood donors (%)
Current Health Status - Has blood ever tested for HIV virus (%)
Current Health Status - Left-handed people (%)
Dermatology - People using sunscreen (%)
Diabetes - Diabetics (%)
Diabetes - Had a blood test for high blood sugar (%)
Diabetes - People taking insulin (%)
Diet Behavior & Nutrition - Diet health (%)
Diet Behavior & Nutrition - Milk product consumption (# of products/month)
Diet Behavior & Nutrition - Meals not home prepared (#/week)
Diet Behavior & Nutrition - Meals from fast food or pizza place (#/week)
Diet Behavior & Nutrition - Ready-to-eat foods (#/month)
Diet Behavior & Nutrition - Frozen meals/pizza (#/month)
Drug Use - People that ever used marijuana or hashish (%)
Drug Use - Ever used hard drugs (%)
Drug Use - Ever used any form of cocaine (%)
Drug Use - Ever used heroin (%)
Drug Use - Ever used methamphetamine (%)
Health Insurance - People covered by health insurance (%)
Kidney Conditions-Urology - Avg. # of times urinating at night
Medical Conditions - People with asthma (%)
Medical Conditions - People with anemia (%)
Medical Conditions - People with psoriasis (%)
Medical Conditions - People with overweight (%)
Medical Conditions - Elderly people having difficulties in thinking or remembering (%)
Medical Conditions - People who ever received blood transfusion (%)
Medical Conditions - People having trouble seeing even with glass/contacts (%)
Medical Conditions - People with arthritis (%)
Medical Conditions - People with gout (%)
Medical Conditions - People with congestive heart failure (%)
Medical Conditions - People with coronary heart disease (%)
Medical Conditions - People with angina pectoris (%)
Medical Conditions - People who ever had heart attack (%)
Medical Conditions - People who ever had stroke (%)
Medical Conditions - People with emphysema (%)
Medical Conditions - People with thyroid problem (%)
Medical Conditions - People with chronic bronchitis (%)
Medical Conditions - People with any liver condition (%)
Medical Conditions - People who ever had cancer or malignancy (%)
Mental Health - People who have little interest in doing things (%)
Mental Health - People feeling down, depressed, or hopeless (%)
Mental Health - People who have trouble sleeping or sleeping too much (%)
Mental Health - People feeling tired or having little energy (%)
Mental Health - People with poor appetite or overeating (%)
Mental Health - People feeling bad about themself (%)
Mental Health - People who have trouble concentrating on things (%)
Mental Health - People moving or speaking slowly or too fast (%)
Mental Health - People having thoughts they would be better off dead (%)
Oral Health - Average years since last visit a dentist
Oral Health - People embarrassed because of mouth (%)
Oral Health - People with gum disease (%)
Oral Health - General health of teeth and gums (%)
Oral Health - Average days a week using dental floss/device
Oral Health - Average days a week using mouthwash for dental problem
Oral Health - Average number of teeth
Pesticide Use - Households using pesticides to control insects (%)
Pesticide Use - Households using pesticides to kill weeds (%)
Physical Activity - People doing vigorous-intensity work activities (%)
Physical Activity - People doing moderate-intensity work activities (%)
Physical Activity - People walking or bicycling (%)
Physical Activity - People doing vigorous-intensity recreational activities (%)
Physical Activity - People doing moderate-intensity recreational activities (%)
Physical Activity - Average hours a day doing sedentary activities
Physical Activity - Average hours a day watching TV or videos
Physical Activity - Average hours a day using computer
Physical Functioning - People having limitations keeping them from working (%)
Physical Functioning - People limited in amount of work they can do (%)
Physical Functioning - People that need special equipment to walk (%)
Physical Functioning - People experiencing confusion/memory problems (%)
Physical Functioning - People requiring special healthcare equipment (%)
Prescription Medications - Average number of prescription medicines taking
Preventive Aspirin Use - Adults 40+ taking low-dose aspirin (%)
Reproductive Health - Vaginal deliveries (%)
Reproductive Health - Cesarean deliveries (%)
Reproductive Health - Deliveries resulted in a live birth (%)
Reproductive Health - Pregnancies resulted in a delivery (%)
Reproductive Health - Women breastfeeding newborns (%)
Reproductive Health - Women that had a hysterectomy (%)
Reproductive Health - Women that had both ovaries removed (%)
Reproductive Health - Women that have ever taken birth control pills (%)
Reproductive Health - Women taking birth control pills (%)
Reproductive Health - Women that have ever used Depo-Provera or injectables (%)
Reproductive Health - Women that have ever used female hormones (%)
Sexual Behavior - People 18+ that ever had sex (vaginal, anal, or oral) (%)
Sexual Behavior - Males 18+ that ever had vaginal sex with a woman (%)
Sexual Behavior - Males 18+ that ever performed oral sex on a woman (%)
Sexual Behavior - Males 18+ that ever had anal sex with a woman (%)
Sexual Behavior - Males 18+ that ever had any sex with a man (%)
Sexual Behavior - Females 18+ that ever had vaginal sex with a man (%)
Sexual Behavior - Females 18+ that ever performed oral sex on a man (%)
Sexual Behavior - Females 18+ that ever had anal sex with a man (%)
Sexual Behavior - Females 18+ that ever had any kind of sex with a woman (%)
Sexual Behavior - Average age people first had sex
Sexual Behavior - Average number of female sex partners in lifetime (males 18+)
Sexual Behavior - Average number of female vaginal sex partners in lifetime (males 18+)
Sexual Behavior - Average age people first performed oral sex on a woman (18+)
Sexual Behavior - Average number of woman performed oral sex on in lifetime (18+)
Sexual Behavior - Average number of male sex partners in lifetime (males 18+)
Sexual Behavior - Average number of male anal sex partners in lifetime (males 18+)
Sexual Behavior - Average age people first performed oral sex on a man (18+)
Sexual Behavior - Average number of male oral sex partners in lifetime (18+)
Sexual Behavior - People using protection when performing oral sex (%)
Sexual Behavior - Average number of times people have vaginal or anal sex a year
Sexual Behavior - People having sex without condom (%)
Sexual Behavior - Average number of male sex partners in lifetime (females 18+)
Sexual Behavior - Average number of male vaginal sex partners in lifetime (females 18+)
Sexual Behavior - Average number of female sex partners in lifetime (females 18+)
Sexual Behavior - Circumcised males 18+ (%)
Sleep Disorders - Average hours sleeping at night
Sleep Disorders - People that has trouble sleeping (%)
Smoking-Cigarette Use - People smoking cigarettes (%)
Taste & Smell - People 40+ having problems with smell (%)
Taste & Smell - People 40+ having problems with taste (%)
Taste & Smell - People 40+ that ever had wisdom teeth removed (%)
Taste & Smell - People 40+ that ever had tonsils teeth removed (%)
Taste & Smell - People 40+ that ever had a loss of consciousness because of a head injury (%)
Taste & Smell - People 40+ that ever had a broken nose or other serious injury to face or skull (%)
Taste & Smell - People 40+ that ever had two or more sinus infections (%)
Weight - Average height (inches)
Weight - Average weight (pounds)
Weight - Average BMI
Weight - People that are obese (%)
Weight - People that ever were obese (%)
Weight - People trying to lose weight (%)
Latest news from Lyndon, KY collected exclusively by city-data.com from local newspapers, TV, and radio stations
Ancestries: American (11.6%), German (10.7%), Irish (7.5%), English (7.4%), Ethiopian (3.0%), Scotch-Irish (1.9%).
Current Local Time:
Incorporated on 05/10/1965
Land area: 3.45 square miles.
Population density: 3,168 people per square mile (average).
980 residents are foreign born (3.8% Latin America , 2.2% Africa , 2.0% Asia ).
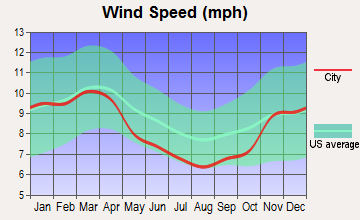
This city:
9.0%Kentucky:
4.1%
Median real estate property taxes paid for housing units with mortgages in 2022: $2,000 (0.7%)Median real estate property taxes paid for housing units with no mortgage in 2022: $2,233 (0.7%)
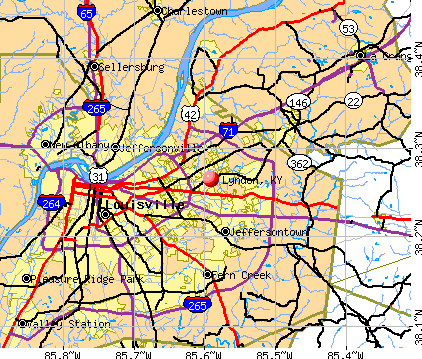
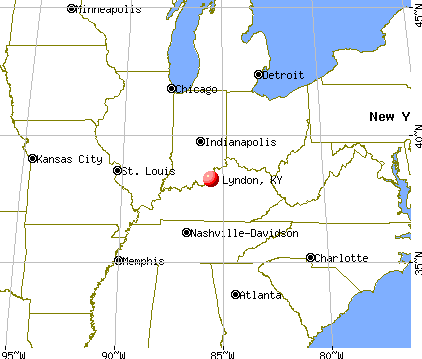
Nearest city with pop. 50,000+: Louisville, KY
Nearest city with pop. 1,000,000+: Chicago, IL
Nearest cities:
Meadowbrook Farm, KY (1.1 miles),
Latitude: 38.26 N, Longitude: 85.59 W
Daytime population change due to commuting: +5,755 (+52.7%)Workers who live and work in this city: 1,479 (22.9%)
Unemployment in December 2023:
Population change in the 1990s: +1,397 (+17.5%).
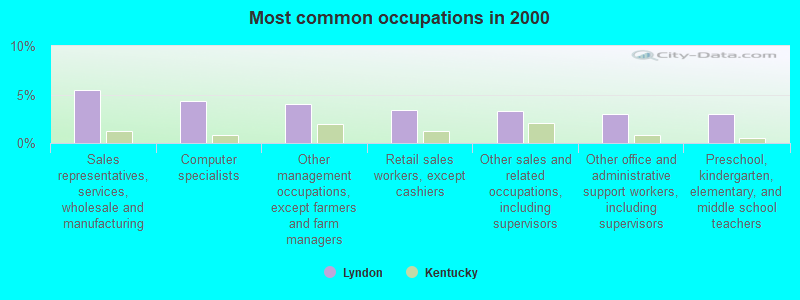
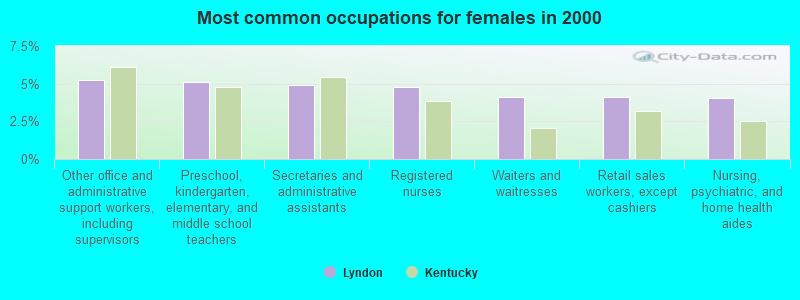
Most common occupations in Lyndon, KY (%)
Both Males Females
Sales representatives, services, wholesale and manufacturing (5.5%)
Computer specialists (4.3%)
Other management occupations, except farmers and farm managers (4.0%)
Retail sales workers, except cashiers (3.4%)
Other sales and related occupations, including supervisors (3.3%)
Other office and administrative support workers, including supervisors (3.0%)
Preschool, kindergarten, elementary, and middle school teachers (2.9%)
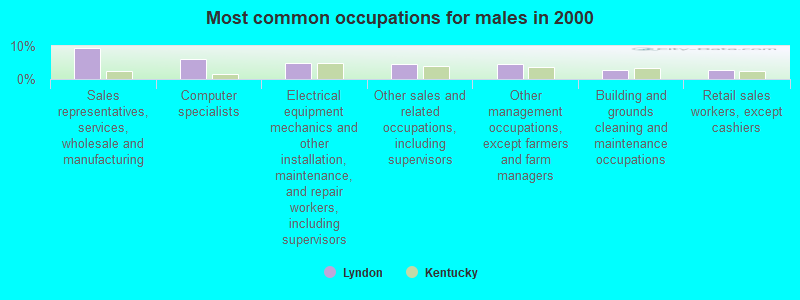
Sales representatives, services, wholesale and manufacturing (9.4%)
Computer specialists (6.0%)
Electrical equipment mechanics and other installation, maintenance, and repair workers, including supervisors (4.8%)
Other sales and related occupations, including supervisors (4.5%)
Other management occupations, except farmers and farm managers (4.4%)
Building and grounds cleaning and maintenance occupations (2.8%)
Retail sales workers, except cashiers (2.8%)
Other office and administrative support workers, including supervisors (5.2%)
Preschool, kindergarten, elementary, and middle school teachers (5.1%)
Secretaries and administrative assistants (4.9%)
Registered nurses (4.8%)
Waiters and waitresses (4.1%)
Retail sales workers, except cashiers (4.1%)
Nursing, psychiatric, and home health aides (4.0%)
Tornado activity:
Lyndon-area historical tornado activity is slightly above Kentucky state average. It is 65% greater than the overall U.S. average.
On 4/3/1974, a category F5 (max. wind speeds 261-318 mph) tornado 26.0 miles away from the Lyndon city center killed 6 people and injured 86 people and caused between $50,000,000 and $500,000,000 in damages.
On 4/3/1974, a category F4 (max. wind speeds 207-260 mph) tornado 9.5 miles away from the city center killed 3 people and injured 225 people .
Earthquake activity:
Lyndon-area historical earthquake activity is significantly above Kentucky state average. It is 106% greater than the overall U.S. average. On 4/18/2008 at 09:36:59, a magnitude 5.4 (5.1 MB, 4.8 MS, 5.4 MW, 5.2 MW, Class: Moderate, Intensity: VI - VII) earthquake occurred 125.1 miles away from Lyndon center On 7/27/1980 at 18:52:21, a magnitude 5.2 (5.1 MB, 4.7 MS, 5.0 UK, 5.2 UK) earthquake occurred 89.6 miles away from the city center On 4/18/2008 at 09:36:59, a magnitude 5.2 (5.2 MW, Depth: 8.9 mi) earthquake occurred 125.1 miles away from the city center On 6/10/1987 at 23:48:54, a magnitude 5.1 (4.9 MB, 4.4 MS, 4.6 MS, 5.1 LG) earthquake occurred 129.9 miles away from the city center On 6/18/2002 at 17:37:15, a magnitude 5.0 (4.3 MB, 4.6 MW, 5.0 LG) earthquake occurred 120.6 miles away from the city center On 4/18/2008 at 15:14:16, a magnitude 4.8 (4.5 MB, 4.8 MW, 4.6 MW, Class: Light, Intensity: IV - V) earthquake occurred 123.2 miles away from Lyndon center Magnitude types: regional Lg-wave magnitude (LG), body-wave magnitude (MB), surface-wave magnitude (MS), moment magnitude (MW) Natural disasters: The number of natural disasters in Jefferson County (17) is near the US average (15).Major Disasters (Presidential) Declared: 13Emergencies Declared: 2Floods: 10, Storms: 10, Tornadoes: 6, Mudslides: 3, Landslides: 2, Winds: 2, Winter Storms: 2, Blizzard: 1, Explosion: 1, Hurricane: 1, Tropical Depression: 1, Other: 1 (Note: some incidents may be assigned to more than one category). Hospitals and medical centers near Lyndon: TEN BROECK HOSP (Hospital, about 1 miles away; LOUISVILLE, KY)
SPRINGHURST HEALTH AND REHAB (Nursing Home, about 2 miles away; LOUISVILLE, KY)
MEADOWVIEW HEALTH AND REHABILITATION CENTER (Nursing Home, about 2 miles away; LOUISVILLE, KY)
GOLDEN LIVINGCENTER - CAMELOT (Nursing Home, about 2 miles away; LOUISVILLE, KY)
EPISCOPAL CHURCH HOME (Nursing Home, about 2 miles away; LOUISVILLE, KY)
AMEDISYS HOME HEALTH OF LOUISVILLE EAST (Home Health Center, about 2 miles away; LOUISVILLE, KY)
JEFFERSON MANOR (Nursing Home, about 2 miles away; LOUISVILLE, KY)
Amtrak station near Lyndon: 10 miles: LOUISVILLE/JEFFERSONVILLE (JEFFERSONVILLE, 500 WILLINGER LANE) Services: enclosed waiting area, public payphones, snack bar, taxi stand, intercity bus service.
Colleges/universities with over 2000 students nearest to Lyndon:
The Southern Baptist Theological Seminary (about 6 miles; Louisville, KY ; Full-time enrollment: 2,360)
Sullivan University (about 6 miles; Louisville, KY ; FT enrollment: 5,129)
Bellarmine University (about 7 miles; Louisville, KY ; FT enrollment: 3,180)
Jefferson Community and Technical College (about 9 miles; Louisville, KY ; FT enrollment: 7,950)
University of Louisville (about 10 miles; Louisville, KY ; FT enrollment: 16,640)
Indiana University-Southeast (about 14 miles; New Albany, IN ; FT enrollment: 5,050)
Kentucky State University (about 41 miles; Frankfort, KY ; FT enrollment: 2,112)
Jefferson County has a predicted average indoor radon screening level greater than 4 pCi/L (pico curies per liter) - Highest Potential Average household size: This city:
2.0 peopleKentucky:
2.5 people
Percentage of family households: This city:
48.1%Whole state:
66.9%
Percentage of households with unmarried partners: This city:
8.4%Whole state:
6.4%
Likely homosexual households (counted as self-reported same-sex unmarried-partner households)
Lesbian couples: 0.5% of all households Gay men: 0.4% of all households
People in group quarters in Lyndon in 2010:
90 people in hospitals with patients who have no usual home elsewhere
51 people in correctional facilities intended for juveniles
13 people in group homes intended for adults
People in group quarters in Lyndon in 2000:
97 people in nursing homes
84 people in mental (psychiatric) hospitals or wards
32 people in training schools for juvenile delinquents
15 people in short-term care, detention or diagnostic centers for delinquent children
8 people in other types of correctional institutions
Banks with branches in Lyndon (2011 data):
JPMorgan Chase Bank, National Association: Lyndon Branch at 533 Lyndon Lane, branch established on 1959/07/17. Info updated 2011/11/10: Bank assets: $1,811,678.0 mil, Deposits: $1,190,738.0 mil, headquarters in Columbus, OH, positive income , International Specialization, 5577 total offices , Holding Company: Jpmorgan Chase & Co.
For population 15 years and over in Lyndon:
Never married: 42.2%Now married: 36.8%Separated: 0.7%Widowed: 7.1%Divorced: 13.1% For population 25 years and over in Lyndon:
High school or higher: 93.4%Bachelor's degree or higher: 41.4%Graduate or professional degree: 16.3%Unemployed: 1.9%Mean travel time to work (commute): 15.1 minutes
Education Gini index (Inequality in education) Here:
11.5Kentucky average:
11.7
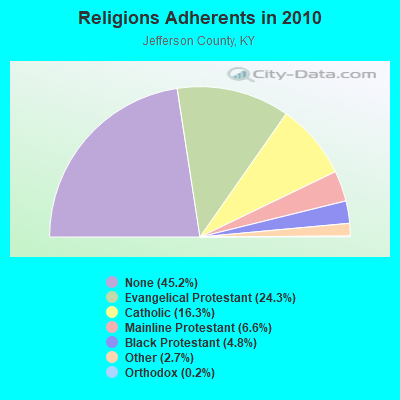
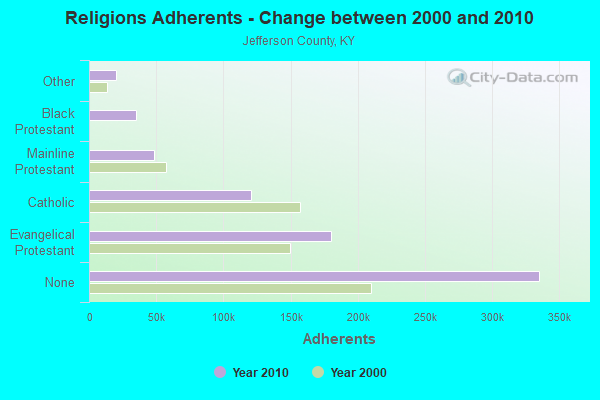
Religion statistics for Lyndon, KY (based on Jefferson County data)
Religion Adherents Congregations Evangelical Protestant 180,149 384 Catholic 120,620 60 Mainline Protestant 48,598 129 Black Protestant 35,305 70 Other 19,947 58 Orthodox 1,180 3 None 335,297 -
Source: Clifford Grammich, Kirk Hadaway, Richard Houseal, Dale E.Jones, Alexei Krindatch, Richie Stanley and Richard H.Taylor. 2012. 2010 U.S.Religion Census: Religious Congregations & Membership Study. Association of Statisticians of American Religious Bodies. Jones, Dale E., et al. 2002. Congregations and Membership in the United States 2000. Nashville, TN: Glenmary Research Center. Graphs represent county-level data
Food Environment Statistics: Number of grocery stores : 127Jefferson County :
1.79 / 10,000 pop.Kentucky :
2.19 / 10,000 pop.
Number of supercenters and club stores : 11Jefferson County :
0.16 / 10,000 pop.Kentucky :
0.25 / 10,000 pop.
Number of convenience stores (no gas) : 50This county :
0.71 / 10,000 pop.Kentucky :
0.74 / 10,000 pop.
Number of convenience stores (with gas) : 195Jefferson County :
2.75 / 10,000 pop.Kentucky :
4.36 / 10,000 pop.
Number of full-service restaurants : 486Here :
6.86 / 10,000 pop.Kentucky :
5.74 / 10,000 pop.
Adult diabetes rate : Jefferson County :
10.6%Kentucky :
11.0%
Adult obesity rate : Jefferson County :
27.6%State :
30.0%
Low-income preschool obesity rate : Jefferson County :
13.4%Kentucky :
15.9%
Health and Nutrition:
Average overall health of teeth and gums : People feeling badly about themselves : This city:
21.3%Kentucky:
21.0%
People not drinking alcohol at all : Average hours sleeping at night : Overweight people : This city:
29.6%Kentucky:
33.8%
General health condition : Lyndon:
55.4%Kentucky:
56.8%
Average condition of hearing : Lyndon:
79.8%Kentucky:
78.9%
More about Health and Nutrition of Lyndon, KY Residents
Local government employment and payroll (March 2022)
Function
Full-time employees
Monthly full-time payroll
Average yearly full-time wage
Part-time employees
Monthly part-time payroll
Other and Unallocable
1 $4,606 $55,272 2 $2,520 Financial Administration
1 $4,336 $52,032 0 $0 Other Government Administration
0 $0 9 $4,172
Totals for Government
2 $8,941 $53,646 11 $6,692
Lyndon government finances - Expenditure in 2021 (per resident):
Current Operations - Central Staff Services: $865,000 ($79.23)
Solid Waste Management: $596,000 ($54.59)Police Protection: $289,000 ($26.47)Regular Highways: $211,000 ($19.33)Parks and Recreation: $125,000 ($11.45)Public Welfare - Other: $59,000 ($5.40)General - Interest on Debt: $737,000 ($67.51)
Other Capital Outlay - Parks and Recreation: $37,000 ($3.39)
Central Staff Services: $4,000 ($0.37)Total Salaries and Wages: $237,000 ($21.71)
Lyndon government finances - Revenue in 2021 (per resident):
Charges - Other: $12,000 ($1.10)
Federal Intergovernmental - Other: $407,000 ($37.28)
Local Intergovernmental - Other: $4,000 ($0.37)
Miscellaneous - Interest Earnings: $17,000 ($1.56)
Rents: $7,000 ($0.64)State Intergovernmental - Highways: $214,000 ($19.60)
Tax - Property: $1,290,000 ($118.16)
Insurance Premiums Sales: $977,000 ($89.49)Public Utilities Sales: $76,000 ($6.96)Alcoholic Beverage License: $44,000 ($4.03)
Lyndon government finances - Debt in 2021 (per resident):
Long Term Debt - Outstanding Unspecified Public Purpose: $32,309,000 ($2959.51)
Beginning Outstanding - Unspecified Public Purpose: $18,422,000 ($1687.46)Retired Unspecified Public Purpose: $-13,887,000 ($-1272.05)
Lyndon government finances - Cash and Securities in 2021 (per resident):
Bond Funds - Cash and Securities: $13,846,000 ($1268.30)
Other Funds - Cash and Securities: $6,584,000 ($603.10)
5.00% of this county's 2021 resident taxpayers lived in other counties in 2020 ($58,554 average adjusted gross income )
Here:
5.00%Kentucky average:
7.04%
0.01% of residents moved from foreign countries ($178 average AGI )Jefferson County:
0.01%Kentucky average:
0.02%
Top counties from which taxpayers relocated into this county between 2020 and 2021:
5.72% of this county's 2020 resident taxpayers moved to other counties in 2021 ($72,642 average adjusted gross income )
Here:
5.72%Kentucky average:
6.89%
0.01% of residents moved to foreign countries ($55 average AGI )Jefferson County:
0.01%Kentucky average:
0.01%
Top counties to which taxpayers relocated from this county between 2020 and 2021: Businesses in Lyndon, KY
McDonald's: 1SONIC Drive-In: 1Walgreens: 1 Strongest AM radio stations in Lyndon:
WHAS (840 AM; 50 kW; LOUISVILLE, KY; Owner: CLEAR CHANNEL BROADCASTING LICENSES, INC.)
WXXA (790 AM; 5 kW; LOUISVILLE, KY)
WGTK (970 AM; 5 kW; LOUISVILLE, KY; Owner: SALEM MEDIA OF KENTUCKY, INC.)
WKJK (1080 AM; 10 kW; LOUISVILLE, KY; Owner: CLEAR CHANNEL BROADCASTING LICENSES, INC.)
WFIA (900 AM; 1 kW; LOUISVILLE, KY; Owner: SCA LICENSE CORPORATION)
WLLV (1240 AM; 1 kW; LOUISVILLE, KY; Owner: MORTENSON BROADCASTING COMPANY)
WTMT (620 AM; 0 kW; LOUISVILLE, KY; Owner: JEFFERSON B/CASTING CMPANY, INC.)
WLOU (1350 AM; 2 kW; LOUISVILLE, KY; Owner: MORTENSON BROADCASTING CO., INC.)
WAVG (1450 AM; 1 kW; JEFFERSONVILLE, IN; Owner: SUNNYSIDE COMMUNICATIONS, INC)
WDRD (680 AM; 1 kW; NEWBURG, KY; Owner: ABC, INC.)
WXLN (1570 AM; 2 kW; NEW ALBANY, IN; Owner: MORTENSON BROADCASTING COMPANY)
WLW (700 AM; 50 kW; CINCINNATI, OH; Owner: JACOR BROADCASTING CORPORATION)
WSAI (1530 AM; 50 kW; CINCINNATI, OH; Owner: JACOR BROADCASTING CORPORATION)
Strongest FM radio stations in Lyndon:
WMJM (101.3 FM; JEFFERSONTOWN, KY; Owner: BLUE CHIP BROADCASTING LICENSES II, LTD.)
WTFX-FM (100.5 FM; LOUISVILLE, KY; Owner: CLEAR CHANNEL BROADCASTING LICENSES, INC.)
WFPL (89.3 FM; LOUISVILLE, KY; Owner: KENTUCKY PUBLIC RADIO, INC.)
WRKA (103.1 FM; ST. MATTHEWS, KY; Owner: CXR HOLDINGS, INC.)
WPTI (103.9 FM; LOUISVILLE, KY; Owner: CXR HOLDINGS, INC.)
WFPK (91.9 FM; LOUISVILLE, KY; Owner: KENTUCKY PUBLIC RADIO, INC.)
WUOL-FM (90.5 FM; LOUISVILLE, KY; Owner: KENTUCKY PUBLIC RADIO, INC.)
WDJX (99.7 FM; LOUISVILLE, KY; Owner: BLUE CHIP BROADCASTING LICENSES II, LTD.)
WVEZ (106.9 FM; LOUISVILLE, KY; Owner: CXR HOLDINGS, INC.)
WAMZ (97.5 FM; LOUISVILLE, KY; Owner: CLEAR CHANNEL BROADCASTING LICENSES, INC.)
WXMA (102.3 FM; LOUISVILLE, KY; Owner: BLUE CHIP BROADCASTING LICENSES II, LTD.)
WRVI (105.9 FM; VALLEY STATION, KY; Owner: SALEM MEDIA OF KENTUCKY, INC.)
WJIE-FM (88.5 FM; OKOLONA, KY; Owner: EVANGEL SCHOOLS, INC.)
WSFR (107.7 FM; CORYDON, IN; Owner: CXR HOLDINGS, INC.)
WQMF (95.7 FM; JEFFERSONVILLE, IN; Owner: CLEAR CHANNEL BROADCASTING LICENSES, INC.)
W284AD (104.7 FM; NEW ALBANY, IN; Owner: LIFETALK RADIO, INC.)
WLRS (105.1 FM; SHEPHERDSVILLE, KY; Owner: BLUE CHIP BROADCASTING LICENSES II, LTD.)
WFIA-FM (94.7 FM; NEW ALBANY, IN; Owner: SALEM MEDIA OF KENTUCKY, INC.)
WJZL (93.1 FM; CLARKSVILLE, IN; Owner: CLEAR CHANNEL BROADCASTING LICENSES, INC.)
WBLO (104.3 FM; CHARLESTOWN, IN; Owner: NEW ALBANY BROADCASTING CO., INC.)
TV broadcast stations around Lyndon:
W24BW (Channel 24; LOUISVILLE, KY; Owner: GREATER LOUISVILLE COMMUNICATIONS)
WAVE (Channel 3; LOUISVILLE, KY; Owner: LIBCO, INC.)
WVHF-LP (Channel 5; JEFFERSONVILLE, ETC., IN; Owner: JOHN W. SMITH, JR.)
WHAS-TV (Channel 11; LOUISVILLE, KY; Owner: BELO KENTUCKY, INC.)
WBXV-CA (Channel 13; LOUISVILLE, KY; Owner: THE BOX WORLDWIDE LLC)
WDRB (Channel 41; LOUISVILLE, KY; Owner: INDEPENDENCE TELEVISION COMPANY)
WFTE (Channel 58; SALEM, IN; Owner: INDEPENDENCE TELEVISION COMPANY)
WLKY-TV (Channel 32; LOUISVILLE, KY; Owner: WLKY HEARST-ARGYLE TELEVISION, INC.)
WBKI-CA (Channel 28; LOUISVILLE, KY; Owner: LOUISVILLE COMMUNICATIONS, LLC)
WJYL-CA (Channel 45; CLARKSVILLE, IN; Owner: JOHN W. SMITH, JR.)
WKPC-TV (Channel 15; LOUISVILLE, KY; Owner: KENTUCKY AUTHORITY FOR EDUC'L. TV)
WKMJ-TV (Channel 68; LOUISVILLE, KY; Owner: KENTUCKY AUTHORITY FOR EDUCATIONAL TV)
WBNA (Channel 21; LOUISVILLE, KY; Owner: WORD BROADCASTING NETWORK, INC.)
W50CI (Channel 50; LOUISVILLE, KY; Owner: SOUTH CENTRAL COMMUNICATIONS CORP.)
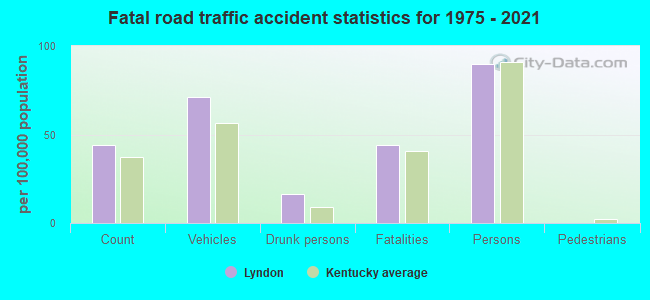
Lyndon fatal accident statistics for 1975 - 2021
Lyndon fatal accident list:
Nov 27, 2021 02:23 AM, Sr-1747 Ramp, Sr-146 La Grange Rd, Lat: 38.271008, Lon: -85.562317, Vehicles: 2, Persons: 4, Fatalities: 1Lat: 38.267747, Lon: -85.602586, Vehicles: 2, Persons: 2, Fatalities: 1Lat: 38.264578, Lon: -85.568017, Vehicles: 2, Persons: 2, Fatalities: 1Vehicles: 1, Persons: 1, Fatalities: 1, Drunk persons involved: 1
National Bridge Inventory (NBI) Statistics 7 Number of bridges49ft / 15.1m Total length66,666 Total average daily traffic11,761 Total average daily truck traffic
FCC Registered Microwave Towers: 1
Studio, Lat: 38.265556 Lon: -85.569444, Type: Building, Structure height: 17.3 m, Call Sign: WQJX476, Assigned Frequencies: 947.000 MHz, Grant Date: 02/03/2009, Expiration Date: 08/01/2028, Certifier: Christopher J Henderson, Registrant: Salem Communications, 4880 Santa Rosa Road, Camarillo, CA 93012, Phone: (805) 384-4502, Fax: (805) 384-4503, Email:
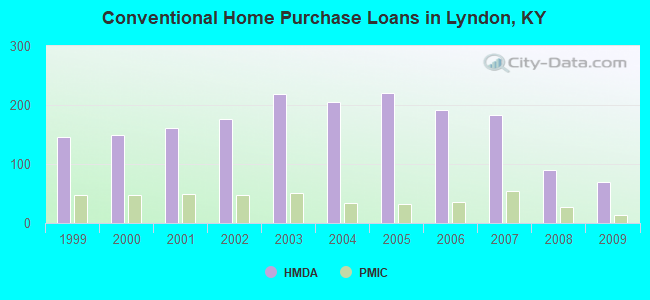
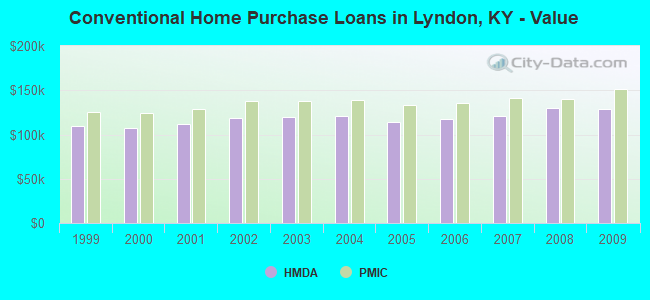
Home Mortgage Disclosure Act Aggregated Statistics For Year 2009(Based on 5 partial tracts) A) FHA, FSA/RHS & VA B) Conventional C) Refinancings D) Home Improvement Loans E) Loans on Dwellings For 5+ Families F) Non-occupant Loans on Number Average Value Number Average Value Number Average Value Number Average Value Number Average Value Number Average Value
LOANS ORIGINATED 67 $140,635 69 $129,289 297 $140,458 12 $55,258 1 $7,002,980 19 $96,024 APPLICATIONS APPROVED, NOT ACCEPTED 3 $118,200 3 $127,843 13 $124,907 1 $17,120 0 $0 0 $0 APPLICATIONS DENIED 15 $131,502 11 $117,424 102 $137,883 6 $63,455 0 $0 3 $105,100 APPLICATIONS WITHDRAWN 5 $158,628 6 $128,257 53 $151,758 1 $13,260 0 $0 1 $212,310 FILES CLOSED FOR INCOMPLETENESS 2 $84,705 2 $112,775 20 $136,620 1 $43,140 0 $0 1 $90,700
Aggregated Statistics For Year 2008(Based on 5 partial tracts) A) FHA, FSA/RHS & VA B) Conventional C) Refinancings D) Home Improvement Loans F) Non-occupant Loans on G) Loans On Manufactured Number Average Value Number Average Value Number Average Value Number Average Value Number Average Value Number Average Value
LOANS ORIGINATED 37 $139,488 89 $129,919 148 $138,138 18 $54,978 23 $113,572 1 $15,680 APPLICATIONS APPROVED, NOT ACCEPTED 2 $107,315 9 $170,959 21 $137,847 6 $27,685 1 $59,460 0 $0 APPLICATIONS DENIED 4 $144,112 11 $92,599 90 $125,938 14 $39,928 4 $100,550 1 $11,930 APPLICATIONS WITHDRAWN 4 $114,485 10 $169,026 37 $155,088 3 $90,207 1 $140,030 0 $0 FILES CLOSED FOR INCOMPLETENESS 1 $148,910 3 $114,450 5 $113,456 2 $82,330 2 $112,485 0 $0
Aggregated Statistics For Year 2007(Based on 5 partial tracts) A) FHA, FSA/RHS & VA B) Conventional C) Refinancings D) Home Improvement Loans E) Loans on Dwellings For 5+ Families F) Non-occupant Loans on G) Loans On Manufactured Number Average Value Number Average Value Number Average Value Number Average Value Number Average Value Number Average Value Number Average Value
LOANS ORIGINATED 14 $125,556 183 $121,128 143 $116,409 24 $43,125 3 $234,757 42 $103,973 1 $104,320 APPLICATIONS APPROVED, NOT ACCEPTED 2 $138,875 16 $123,778 30 $127,189 8 $29,338 0 $0 5 $63,374 1 $23,830 APPLICATIONS DENIED 3 $126,497 23 $135,147 83 $131,564 24 $37,362 0 $0 6 $124,695 1 $19,590 APPLICATIONS WITHDRAWN 1 $183,190 14 $143,082 42 $136,266 5 $68,928 0 $0 4 $102,302 0 $0 FILES CLOSED FOR INCOMPLETENESS 0 $0 7 $143,429 17 $159,588 0 $0 0 $0 1 $184,960 0 $0
Aggregated Statistics For Year 2006(Based on 5 partial tracts) A) FHA, FSA/RHS & VA B) Conventional C) Refinancings D) Home Improvement Loans E) Loans on Dwellings For 5+ Families F) Non-occupant Loans on G) Loans On Manufactured Number Average Value Number Average Value Number Average Value Number Average Value Number Average Value Number Average Value Number Average Value
LOANS ORIGINATED 15 $131,687 191 $117,608 169 $119,017 36 $38,635 1 $4,871,900 37 $114,818 0 $0 APPLICATIONS APPROVED, NOT ACCEPTED 0 $0 16 $137,544 29 $107,008 5 $44,816 0 $0 2 $107,820 0 $0 APPLICATIONS DENIED 4 $103,198 26 $100,362 90 $116,469 23 $31,993 0 $0 4 $92,430 1 $24,620 APPLICATIONS WITHDRAWN 1 $199,850 18 $121,938 48 $120,767 2 $43,940 0 $0 3 $130,430 0 $0 FILES CLOSED FOR INCOMPLETENESS 3 $121,033 6 $135,840 20 $131,828 1 $99,650 0 $0 0 $0 0 $0
Aggregated Statistics For Year 2005(Based on 5 partial tracts) A) FHA, FSA/RHS & VA B) Conventional C) Refinancings D) Home Improvement Loans E) Loans on Dwellings For 5+ Families F) Non-occupant Loans on G) Loans On Manufactured Number Average Value Number Average Value Number Average Value Number Average Value Number Average Value Number Average Value Number Average Value
LOANS ORIGINATED 30 $127,820 221 $114,317 233 $110,909 27 $48,450 1 $67,430 55 $96,754 0 $0 APPLICATIONS APPROVED, NOT ACCEPTED 2 $142,835 20 $98,108 43 $103,021 6 $34,172 0 $0 3 $62,097 0 $0 APPLICATIONS DENIED 1 $157,060 41 $94,983 123 $122,524 17 $26,662 0 $0 7 $100,526 2 $56,020 APPLICATIONS WITHDRAWN 2 $85,195 21 $147,131 50 $127,490 13 $103,175 0 $0 4 $135,865 0 $0 FILES CLOSED FOR INCOMPLETENESS 1 $90,800 12 $124,977 17 $149,094 1 $49,160 0 $0 1 $54,810 0 $0
Aggregated Statistics For Year 2004(Based on 5 partial tracts) A) FHA, FSA/RHS & VA B) Conventional C) Refinancings D) Home Improvement Loans E) Loans on Dwellings For 5+ Families F) Non-occupant Loans on G) Loans On Manufactured Number Average Value Number Average Value Number Average Value Number Average Value Number Average Value Number Average Value Number Average Value
LOANS ORIGINATED 32 $127,502 205 $120,953 274 $112,864 21 $39,034 1 $52,610 48 $96,818 1 $16,110 APPLICATIONS APPROVED, NOT ACCEPTED 0 $0 23 $122,113 36 $117,263 6 $42,110 0 $0 6 $96,298 1 $37,890 APPLICATIONS DENIED 2 $108,630 35 $112,739 107 $121,678 23 $26,458 0 $0 9 $81,540 2 $61,450 APPLICATIONS WITHDRAWN 1 $138,260 23 $109,452 84 $122,287 4 $50,272 0 $0 7 $112,451 1 $71,480 FILES CLOSED FOR INCOMPLETENESS 2 $106,265 6 $112,297 14 $154,308 2 $69,545 0 $0 0 $0 0 $0
Aggregated Statistics For Year 2003(Based on 5 partial tracts) A) FHA, FSA/RHS & VA B) Conventional C) Refinancings D) Home Improvement Loans E) Loans on Dwellings For 5+ Families F) Non-occupant Loans on Number Average Value Number Average Value Number Average Value Number Average Value Number Average Value Number Average Value
LOANS ORIGINATED 39 $123,655 218 $119,734 699 $111,289 25 $46,639 1 $9,840,140 70 $91,099 APPLICATIONS APPROVED, NOT ACCEPTED 2 $128,280 19 $116,733 70 $98,461 3 $32,143 0 $0 5 $97,312 APPLICATIONS DENIED 5 $139,864 28 $96,607 122 $107,580 15 $30,467 0 $0 5 $80,982 APPLICATIONS WITHDRAWN 1 $115,450 21 $151,537 98 $115,549 3 $11,017 0 $0 6 $87,192 FILES CLOSED FOR INCOMPLETENESS 0 $0 4 $118,240 19 $104,009 1 $179,770 0 $0 0 $0
Aggregated Statistics For Year 2002(Based on 5 partial tracts) A) FHA, FSA/RHS & VA B) Conventional C) Refinancings D) Home Improvement Loans E) Loans on Dwellings For 5+ Families F) Non-occupant Loans on Number Average Value Number Average Value Number Average Value Number Average Value Number Average Value Number Average Value
LOANS ORIGINATED 55 $111,075 177 $118,171 514 $107,510 28 $25,216 1 $7,068,380 60 $82,121 APPLICATIONS APPROVED, NOT ACCEPTED 1 $63,250 16 $100,298 57 $111,566 6 $35,500 0 $0 4 $110,122 APPLICATIONS DENIED 7 $139,246 19 $94,786 92 $98,779 14 $30,819 0 $0 3 $66,387 APPLICATIONS WITHDRAWN 2 $104,645 21 $136,874 70 $115,905 1 $26,790 0 $0 9 $97,791 FILES CLOSED FOR INCOMPLETENESS 2 $163,845 6 $82,288 20 $114,133 1 $13,720 0 $0 0 $0
Aggregated Statistics For Year 2001(Based on 5 partial tracts) A) FHA, FSA/RHS & VA B) Conventional C) Refinancings D) Home Improvement Loans F) Non-occupant Loans on Number Average Value Number Average Value Number Average Value Number Average Value Number Average Value
LOANS ORIGINATED 58 $114,423 161 $112,092 484 $97,987 43 $29,074 50 $85,131 APPLICATIONS APPROVED, NOT ACCEPTED 3 $114,143 10 $94,786 45 $78,335 11 $20,643 1 $73,330 APPLICATIONS DENIED 2 $143,485 21 $94,464 98 $77,048 24 $24,597 4 $110,282 APPLICATIONS WITHDRAWN 1 $115,830 15 $109,143 64 $105,664 2 $15,960 4 $133,222 FILES CLOSED FOR INCOMPLETENESS 0 $0 7 $74,476 14 $98,206 0 $0 0 $0
Aggregated Statistics For Year 2000(Based on 5 partial tracts) A) FHA, FSA/RHS & VA B) Conventional C) Refinancings D) Home Improvement Loans F) Non-occupant Loans on Number Average Value Number Average Value Number Average Value Number Average Value Number Average Value
LOANS ORIGINATED 45 $110,271 150 $107,187 132 $72,127 52 $19,027 30 $95,664 APPLICATIONS APPROVED, NOT ACCEPTED 1 $68,380 8 $94,705 26 $67,753 12 $17,952 1 $63,540 APPLICATIONS DENIED 7 $104,470 26 $70,855 58 $71,724 27 $16,721 5 $134,794 APPLICATIONS WITHDRAWN 1 $200,140 11 $126,259 32 $95,428 3 $38,053 3 $214,587 FILES CLOSED FOR INCOMPLETENESS 1 $94,870 2 $114,220 6 $89,073 1 $9,550 0 $0
Aggregated Statistics For Year 1999(Based on 5 partial tracts) A) FHA, FSA/RHS & VA B) Conventional C) Refinancings D) Home Improvement Loans F) Non-occupant Loans on Number Average Value Number Average Value Number Average Value Number Average Value Number Average Value
LOANS ORIGINATED 48 $100,251 146 $109,658 262 $75,831 64 $17,051 39 $63,437 APPLICATIONS APPROVED, NOT ACCEPTED 1 $81,580 12 $81,213 34 $63,515 18 $16,371 2 $49,915 APPLICATIONS DENIED 5 $104,378 27 $92,674 74 $67,904 23 $18,104 8 $53,386 APPLICATIONS WITHDRAWN 1 $130,130 17 $85,371 50 $81,626 3 $63,170 5 $72,194 FILES CLOSED FOR INCOMPLETENESS 1 $48,880 4 $114,568 13 $84,299 0 $0 2 $89,380
Detailed HMDA statistics for the following Tracts:
0100.04
, 0100.05 , 0100.06 , 0101.01 , 0101.02
Private Mortgage Insurance Companies Aggregated Statistics For Year 2009(Based on 5 partial tracts) A) Conventional B) Refinancings C) Non-occupant Loans on Number Average Value Number Average Value Number Average Value
LOANS ORIGINATED 14 $151,449 13 $156,721 1 $190,890 APPLICATIONS APPROVED, NOT ACCEPTED 1 $161,900 3 $147,223 0 $0 APPLICATIONS DENIED 1 $98,010 1 $334,560 0 $0 APPLICATIONS WITHDRAWN 1 $101,660 2 $157,595 1 $101,660 FILES CLOSED FOR INCOMPLETENESS 1 $62,060 0 $0 1 $62,060
Aggregated Statistics For Year 2008(Based on 5 partial tracts) A) Conventional B) Refinancings C) Non-occupant Loans on Number Average Value Number Average Value Number Average Value
LOANS ORIGINATED 27 $139,869 17 $164,746 3 $134,727 APPLICATIONS APPROVED, NOT ACCEPTED 7 $129,203 6 $188,305 1 $47,870 APPLICATIONS DENIED 0 $0 1 $119,920 1 $119,920 APPLICATIONS WITHDRAWN 3 $115,777 0 $0 0 $0 FILES CLOSED FOR INCOMPLETENESS 1 $105,620 0 $0 1 $105,620
Aggregated Statistics For Year 2007(Based on 5 partial tracts) A) Conventional B) Refinancings C) Non-occupant Loans on Number Average Value Number Average Value Number Average Value
LOANS ORIGINATED 54 $141,005 21 $140,360 2 $109,065 APPLICATIONS APPROVED, NOT ACCEPTED 9 $167,400 3 $143,757 1 $96,890 APPLICATIONS DENIED 0 $0 0 $0 0 $0 APPLICATIONS WITHDRAWN 1 $155,110 3 $97,263 0 $0 FILES CLOSED FOR INCOMPLETENESS 0 $0 0 $0 0 $0
Aggregated Statistics For Year 2006(Based on 5 partial tracts) A) Conventional B) Refinancings C) Non-occupant Loans on Number Average Value Number Average Value Number Average Value
LOANS ORIGINATED 36 $135,082 13 $179,646 3 $111,820 APPLICATIONS APPROVED, NOT ACCEPTED 4 $123,358 4 $158,508 1 $74,590 APPLICATIONS DENIED 0 $0 1 $100,070 1 $100,070 APPLICATIONS WITHDRAWN 3 $110,983 2 $95,630 0 $0 FILES CLOSED FOR INCOMPLETENESS 0 $0 0 $0 0 $0
Aggregated Statistics For Year 2005(Based on 5 partial tracts) A) Conventional B) Refinancings C) Non-occupant Loans on Number Average Value Number Average Value Number Average Value
LOANS ORIGINATED 33 $132,995 15 $123,173 5 $114,890 APPLICATIONS APPROVED, NOT ACCEPTED 3 $187,477 5 $131,996 0 $0 APPLICATIONS DENIED 0 $0 0 $0 0 $0 APPLICATIONS WITHDRAWN 3 $112,220 0 $0 1 $51,620 FILES CLOSED FOR INCOMPLETENESS 0 $0 0 $0 0 $0
Aggregated Statistics For Year 2004(Based on 5 partial tracts) A) Conventional B) Refinancings C) Non-occupant Loans on Number Average Value Number Average Value Number Average Value
LOANS ORIGINATED 34 $138,565 20 $143,444 3 $89,140 APPLICATIONS APPROVED, NOT ACCEPTED 12 $118,130 9 $134,498 1 $124,710 APPLICATIONS DENIED 0 $0 0 $0 0 $0 APPLICATIONS WITHDRAWN 4 $126,182 1 $89,150 1 $60,860 FILES CLOSED FOR INCOMPLETENESS 0 $0 0 $0 0 $0
Aggregated Statistics For Year 2003(Based on 5 partial tracts) A) Conventional B) Refinancings C) Non-occupant Loans on Number Average Value Number Average Value Number Average Value
LOANS ORIGINATED 51 $137,659 72 $130,341 4 $119,828 APPLICATIONS APPROVED, NOT ACCEPTED 4 $111,372 13 $123,390 2 $95,390 APPLICATIONS DENIED 0 $0 2 $97,245 0 $0 APPLICATIONS WITHDRAWN 0 $0 5 $104,110 0 $0 FILES CLOSED FOR INCOMPLETENESS 0 $0 0 $0 0 $0
Aggregated Statistics For Year 2002(Based on 5 partial tracts) A) Conventional B) Refinancings C) Non-occupant Loans on Number Average Value Number Average Value Number Average Value
LOANS ORIGINATED 47 $138,374 49 $127,029 3 $81,773 APPLICATIONS APPROVED, NOT ACCEPTED 6 $133,315 7 $123,691 0 $0 APPLICATIONS DENIED 0 $0 1 $137,140 0 $0 APPLICATIONS WITHDRAWN 1 $191,310 1 $174,910 0 $0 FILES CLOSED FOR INCOMPLETENESS 1 $57,180 0 $0 0 $0
Aggregated Statistics For Year 2001(Based on 5 partial tracts) A) Conventional B) Refinancings Number Average Value Number Average Value
LOANS ORIGINATED 49 $128,297 47 $123,007 APPLICATIONS APPROVED, NOT ACCEPTED 4 $131,092 5 $114,956 APPLICATIONS DENIED 1 $56,690 2 $94,195 APPLICATIONS WITHDRAWN 1 $66,440 3 $99,363 FILES CLOSED FOR INCOMPLETENESS 0 $0 0 $0
Aggregated Statistics For Year 2000(Based on 5 partial tracts) A) Conventional B) Refinancings C) Non-occupant Loans on Number Average Value Number Average Value Number Average Value
LOANS ORIGINATED 48 $124,777 6 $91,818 2 $99,190 APPLICATIONS APPROVED, NOT ACCEPTED 8 $172,271 2 $151,265 5 $195,598 APPLICATIONS DENIED 1 $45,950 0 $0 1 $45,950 APPLICATIONS WITHDRAWN 2 $65,135 0 $0 0 $0 FILES CLOSED FOR INCOMPLETENESS 0 $0 0 $0 0 $0
Aggregated Statistics For Year 1999(Based on 5 partial tracts) A) Conventional B) Refinancings C) Non-occupant Loans on Number Average Value Number Average Value Number Average Value
LOANS ORIGINATED 47 $125,607 18 $94,682 1 $113,440 APPLICATIONS APPROVED, NOT ACCEPTED 5 $102,278 6 $97,247 1 $48,280 APPLICATIONS DENIED 2 $85,025 1 $83,240 0 $0 APPLICATIONS WITHDRAWN 1 $158,010 0 $0 0 $0 FILES CLOSED FOR INCOMPLETENESS 1 $110,290 0 $0 0 $0
Detailed PMIC statistics for the following Tracts:
0100.04
, 0100.05 , 0100.06 , 0101.01 , 0101.02 Lyndon compared to Kentucky state average:
Unemployed percentage significantly below state average. Black race population percentage significantly above state average. Median age below state average. Foreign-born population percentage significantly above state average. Renting percentage above state average. Length of stay since moving in significantly above state average. Percentage of population with a bachelor's degree or higher above state average.
#76 on the list of "Top 101 cities with the largest percentage of people in mental (psychiatric) hospitals or wards (population 1,000+)"
#93 on the list of "Top 101 cities with the most residents born in Middle Africa (population 500+)"
#18 on the list of "Top 101 counties with the worst general health status score of residents (1-5), 3 years of data"
#22 on the list of "Top 101 counties with the highest average weight of females"
#23 on the list of "Top 101 counties with the highest Particulate Matter (PM2.5 ) Annual air pollution readings in 2012 (µg/m3 )"
#23 on the list of "Top 101 counties with the most Black Protestant adherents"
#31 on the list of "Top 101 counties with the lowest percentage of residents that exercised in the past month"
Top Patent Applicants
Gregory Bernard Landers (1)
Total of 1 patent application in 2008-2024.


 Recent articles from our blog. Our writers, many of them Ph.D. graduates or candidates, create easy-to-read articles on a wide variety of topics.

 (8.9 miles