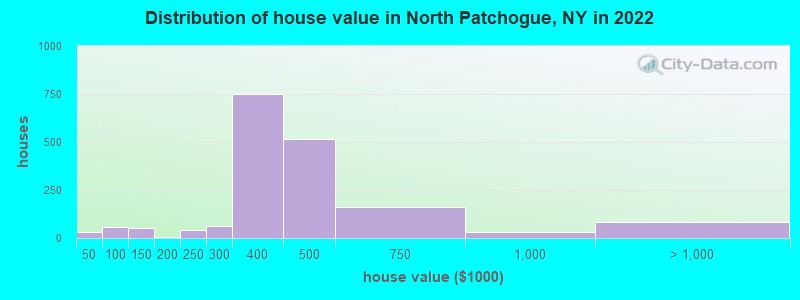
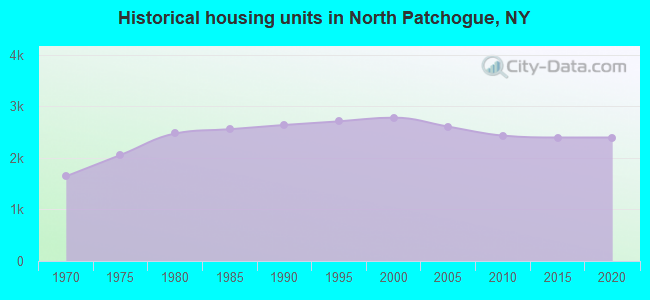
Estimated median house or condo value in 2022: $418,281 (it was $137,000 in 2000)
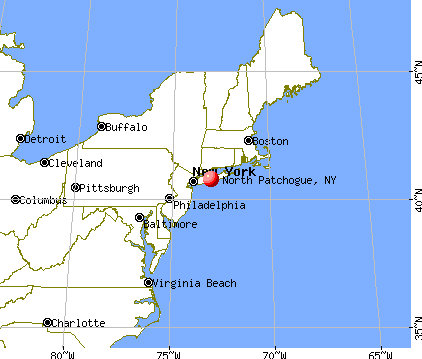
North Patchogue:
$418,281
NY:
$400,400
Mean prices in 2022:all housing units: $648,309; detached houses: $664,885; townhouses or other attached units: $541,828; in 2-unit structures: $735,387; in 3-to-4-unit structures: $523,799; in 5-or-more-unit structures: $413,065; mobile homes: $230,025
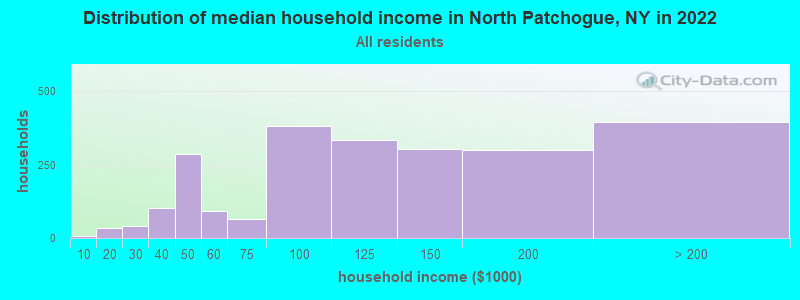
Median gross rent in 2022: $2,345.
March 2022 cost of living index in North Patchogue: 150.7 (very high, U.S. average is 100)
Percentage of residents living in poverty in 2022: 1.5%
(1.9% for White Non-Hispanic residents, 29.0% for Black residents, 0.9% for two or more races residents)
Latest news from North Patchogue, NY collected exclusively by city-data.com from local newspapers, TV, and radio stations
Ancestries: Irish (24.5%), Italian (19.3%), German (7.6%), American (4.8%), Polish (1.6%), Norwegian (1.1%).
Current Local Time: EST time zone
Elevation: 49 feet
Land area: 2.13 square miles.
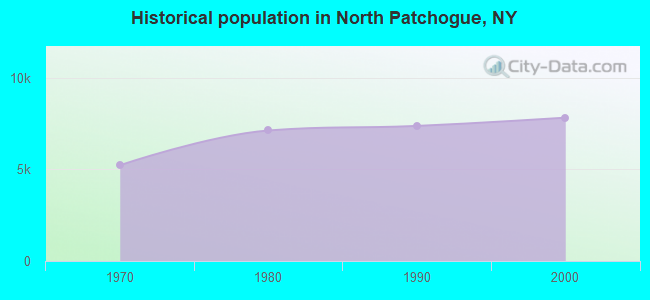
Population density: 3,398 people per square mile (average).
777 residents are foreign born (5.8% Latin America, 2.9% Asia).
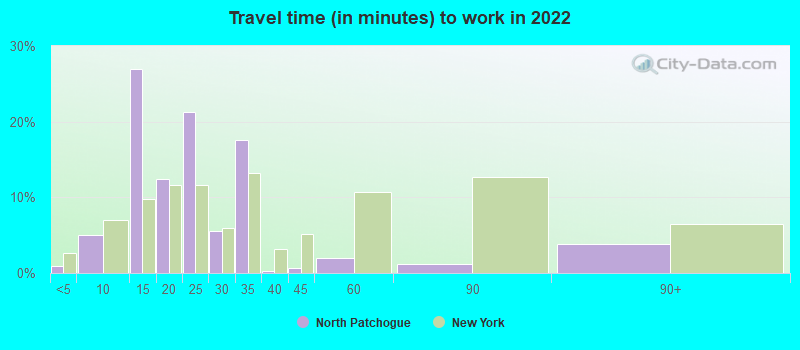
This place:
10.0%
New York:
22.6%
Median real estate property taxes paid for housing units with mortgages in 2022: $9,621 (2.2%) Median real estate property taxes paid for housing units with no mortgage in 2022: $8,019 (2.1%)
Nearest city with pop. 50,000+: Brentwood, NY (11.6 miles , pop. 53,917).
Nearest city with pop. 200,000+: North Hempstead, NY (33.7 miles , pop. 222,611).
Nearest city with pop. 1,000,000+: Queens, NY (42.1 miles , pop. 2,229,379).
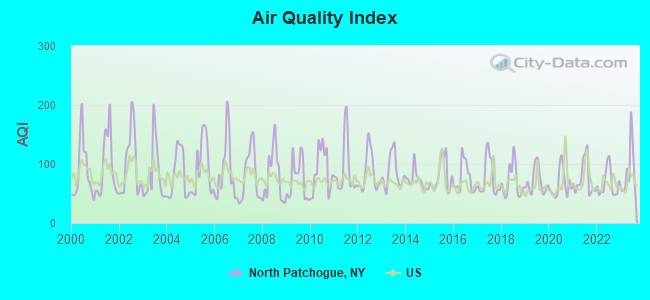
Air Quality Index (AQI) level in 2023 was 88.3. This is worse than average.
City:
88.3
U.S.:
72.6
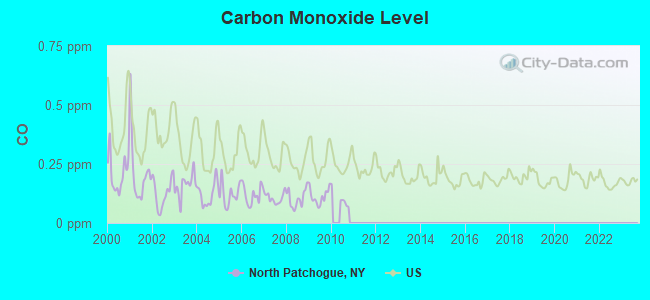
Carbon Monoxide (CO) [ppm] level in 2009 was 0.112. This is significantly better than average.Closest monitor was 3.5 miles away from the city center.
City:
0.112
U.S.:
0.251
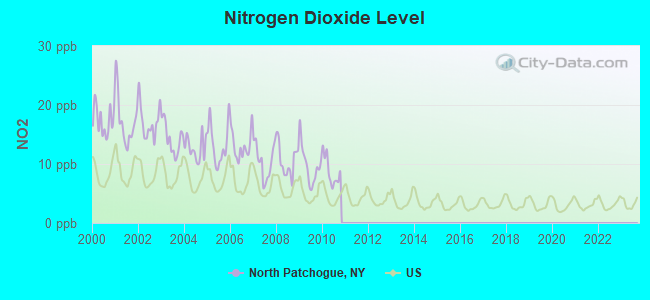
Nitrogen Dioxide (NO2) [ppb] level in 2010 was 8.78. This is significantly worse than average.Closest monitor was 3.5 miles away from the city center.
City:
8.78
U.S.:
5.11
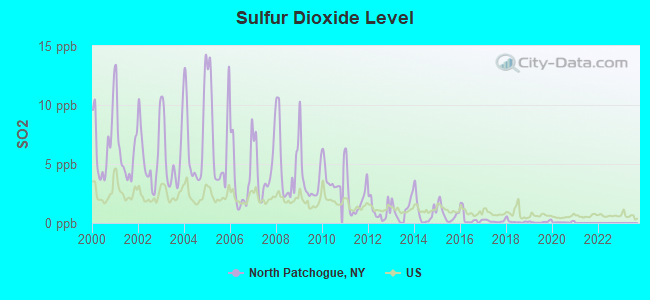
Sulfur Dioxide (SO2) [ppb] level in 2020 was 0.0629. This is significantly better than average.Closest monitor was 3.5 miles away from the city center.
City:
0.0629
U.S.:
1.5147
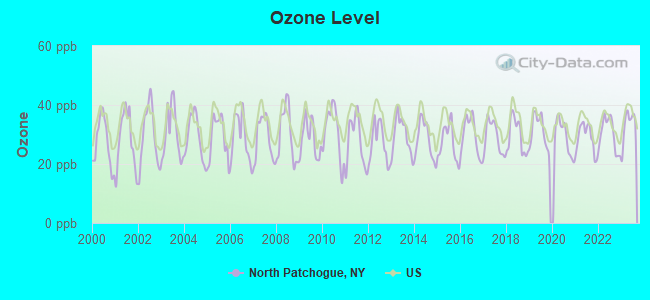
Ozone [ppb] level in 2023 was 33.3. This is about average.Closest monitor was 3.5 miles away from the city center.
City:
33.3
U.S.:
33.3
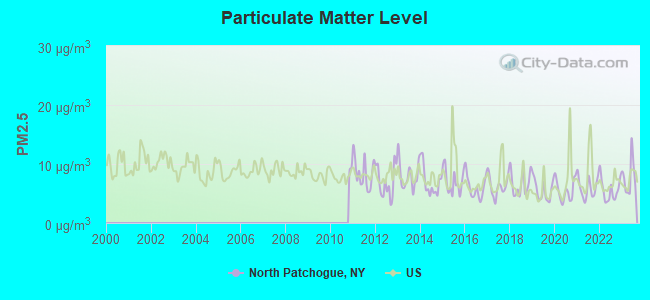
Particulate Matter (PM2.5) [µg/m3] level in 2023 was 7.79. This is about average.Closest monitor was 20.9 miles away from the city center.
City:
7.79
U.S.:
8.11
Tornado activity:
North Patchogue-area historical tornado activity is near New York state average. It is 62% smaller than the overall U.S. average.
On 7/10/1989, a category F4 (max. wind speeds 207-260 mph) tornado 37.4 miles away from the North Patchogue place center injured 40 peopleand causedbetween $50,000,000 and $500,000,000 in damages.
On 7/10/1989, a category F2 (max. wind speeds 113-157 mph) tornado 13.0 miles away from the place center injured one person.
Earthquake activity:
North Patchogue-area historical earthquake activity is significantly above New York state average. It is 72% smaller than the overall U.S. average.
On 10/7/1983 at 10:18:46, a magnitude 5.3 (5.1 MB, 5.3 LG, 5.1 ML, Class: Moderate, Intensity: VI - VII) earthquake occurred 229.3 miles away from the city center On 8/23/2011 at 17:51:04, a magnitude 5.8 (5.8 MW, Depth: 3.7 mi) earthquake occurred 329.4 miles away from the city center On 4/20/2002 at 10:50:47, a magnitude 5.3 (5.3 ML, Depth: 3.0 mi) earthquake occurred 260.1 miles away from the city center On 4/20/2002 at 10:50:47, a magnitude 5.2 (5.2 MB, 4.2 MS, 5.2 MW, 5.0 MW) earthquake occurred 258.5 miles away from the city center On 8/22/1992 at 12:20:32, a magnitude 4.8 (4.8 MB, 3.8 MS, 4.7 LG, Depth: 6.2 mi, Class: Light, Intensity: IV - V) earthquake occurred 184.5 miles away from the city center On 1/16/1994 at 01:49:16, a magnitude 4.6 (4.6 MB, 4.6 LG, Depth: 3.1 mi) earthquake occurred 161.5 miles away from North Patchogue center Magnitude types: regional Lg-wave magnitude (LG), body-wave magnitude (MB), local magnitude (ML), surface-wave magnitude (MS), moment magnitude (MW)
Natural disasters:
The number of natural disasters in Suffolk County (28) is a lot greater than the US average (15). Major Disasters (Presidential) Declared: 19 Emergencies Declared: 7
Causes of natural disasters: Hurricanes: 9, Floods: 7, Storms: 7, Snowstorms: 4, Winter Storms: 3, Blizzards: 2, Heavy Rain: 1, Power Outage: 1, Tropical Depression: 1, Tropical Storm: 1, Water Shortage: 1, Other: 3 (Note: some incidents may be assigned to more than one category).
Hospitals and medical centers near North Patchogue:
BROOKHAVEN MEMORIAL HOSP (Dialysis Facility, about 2 miles away; PATCHOGUE, NY)
BROOKHAVEN MEM HOSP MEDICAL CTR HOSPICE (Hospital, about 2 miles away; PATCHOGUE, NY)
BROOKHAVEN MEM HOSP CHHA (Home Health Center, about 2 miles away; PATCHOGUE, NY)
MARYHAVEN CENTER OF HOPE, INC (Hospital, about 2 miles away; MEDFORD, NY)
DEVELOPMENTAL DISABILITIES INSTITUTE (Hospital, about 2 miles away; MEDFORD, NY)
HUNTINGTON AKC- MEDFORD EXT. (Dialysis Facility, about 2 miles away; MEDFORD, NY)
MARYHAVEN CENTER OF HOPE, INC (Hospital, about 3 miles away; HOLTSVILLE, NY)
Colleges/universities with over 2000 students nearest to North Patchogue:
Suffolk County Community College (about 5 miles; Selden, NY; Full-time enrollment: 18,540)
Dowling College (about 8 miles; Oakdale, NY; FT enrollment: 2,598)
Stony Brook University (about 11 miles; Stony Brook, NY; FT enrollment: 22,071)
Farmingdale State College (about 22 miles; Farmingdale, NY; FT enrollment: 6,956)
Briarcliffe College (about 25 miles; Bethpage, NY; FT enrollment: 2,134)
Porter and Chester Institute of Stratford (about 28 miles; Stratford, CT; FT enrollment: 2,822)
University of Bridgeport (about 28 miles; Bridgeport, CT; FT enrollment: 3,708)
Notable locations in North Patchogue: Clare Rose Playhouse (A), John A Danzi Athletic Center (B), Callahan Library (C), O'Connor Hall (D), McPeak's Adult Home (E). Display/hide their locations on the map
Churches in North Patchogue include: First Church of Christ Scientist (A), Our Lady of Mount Carmel Church (B), Lutheran Church of Our Savior (C). Display/hide their locations on the map
Suffolk County has a predicted average indoor radon screening level less than 2 pCi/L (pico curies per liter) - Low Potential
Average household size:
This place:
3.1 people
New York:
2.6 people
Percentage of family households:
This place:
77.0%
Whole state:
63.5%
Percentage of households with unmarried partners:
This place:
6.0%
Whole state:
6.8%
Likely homosexual households (counted as self-reported same-sex unmarried-partner households)
Lesbian couples: 0.7% of all households
Gay men: 0.2% of all households
People in group quarters in North Patchogue in 2010:
84 people in other noninstitutional facilities
20 people in nursing facilities/skilled-nursing facilities
12 people in group homes intended for adults
People in group quarters in North Patchogue in 2000:
56 people in other noninstitutional group quarters
15 people in homes or halfway houses for drug/alcohol abuse
10 people in homes for the mentally retarded
6 people in religious group quarters
Banks with branches in North Patchogue (2011 data):
JPMorgan Chase Bank, National Association: North Patchogue Branch at 472 Medford Avenue, branch established on 1968/03/28; North Patchogue Branch at 444 Waverly Avenue, branch established on 1972/09/14. Info updated 2011/11/10: Bank assets: $1,811,678.0 mil, Deposits: $1,190,738.0 mil, headquarters in Columbus, OH, positive income, International Specialization, 5577 total offices, Holding Company: Jpmorgan Chase & Co.
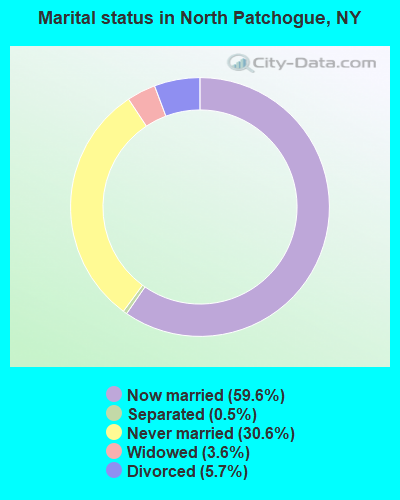
For population 15 years and over in North Patchogue:
Never married: 30.6%
Now married: 59.6%
Separated: 0.5%
Widowed: 3.6%
Divorced: 5.7%
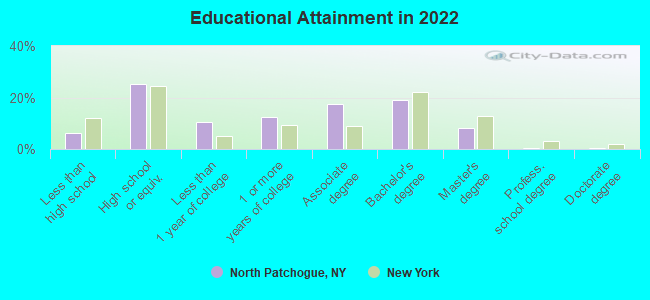
For population 25 years and over in North Patchogue:
Religion statistics for North Patchogue, NY (based on Suffolk County data)
Religion
Adherents
Congregations
Catholic
879,457
75
Mainline Protestant
69,205
182
Evangelical Protestant
58,909
264
Other
50,771
124
Orthodox
10,190
10
Black Protestant
8,298
49
None
416,520
-
Source: Clifford Grammich, Kirk Hadaway, Richard Houseal, Dale E.Jones, Alexei Krindatch, Richie Stanley and Richard H.Taylor. 2012. 2010 U.S.Religion Census: Religious Congregations & Membership Study. Association of Statisticians of American Religious Bodies. Jones, Dale E., et al. 2002. Congregations and Membership in the United States 2000. Nashville, TN: Glenmary Research Center. Graphs represent county-level data
Call Sign: KB2IFH, Grant Date: 07/03/1989, Expiration Date: 07/03/1999, Cancellation Date: 07/04/2001, Registrant: Linda M Barget, 54 Circle Dr N, North Patchogue, NY 11772
Call Sign: W2YHX, Grant Date: 10/13/1987, Expiration Date: 10/13/1997, Cancellation Date: 10/14/1999, Registrant: Carl Weintraub, 5 Valerie Ln, North Patchogue, NY 11772
Home Mortgage Disclosure Act Aggregated Statistics For Year 2009 (Based on 1 full tract)
A) FHA, FSA/RHS & VA Home Purchase Loans
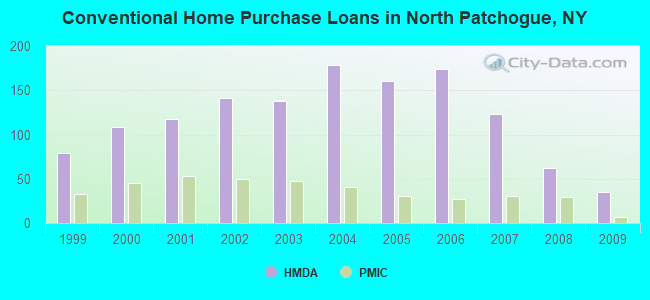
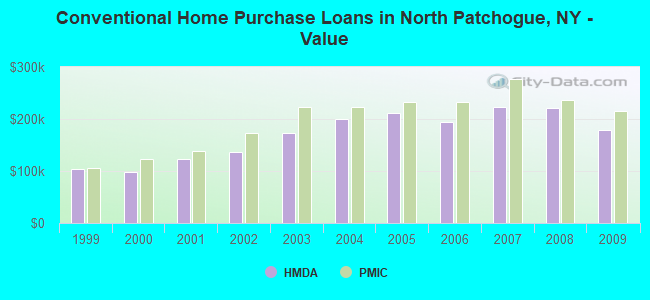
B) Conventional Home Purchase Loans
C) Refinancings
D) Home Improvement Loans
F) Non-occupant Loans on < 5 Family Dwellings (A B C & D)
Number
Average Value
Number
Average Value
Number
Average Value
Number
Average Value
Number
Average Value
LOANS ORIGINATED
40
$260,350
35
$178,429
93
$198,075
9
$175,778
2
$148,500
APPLICATIONS APPROVED, NOT ACCEPTED
3
$282,000
2
$228,500
14
$206,571
1
$6,000
1
$206,000
APPLICATIONS DENIED
7
$196,714
15
$195,933
45
$233,556
5
$66,400
2
$131,500
APPLICATIONS WITHDRAWN
4
$240,000
3
$184,667
36
$230,944
4
$185,750
2
$125,500
FILES CLOSED FOR INCOMPLETENESS
2
$236,000
1
$139,000
8
$198,125
2
$36,500
0
$0
Aggregated Statistics For Year 2008 (Based on 1 full tract)
A) FHA, FSA/RHS & VA Home Purchase Loans
B) Conventional Home Purchase Loans
C) Refinancings
D) Home Improvement Loans
F) Non-occupant Loans on < 5 Family Dwellings (A B C & D)
Number
Average Value
Number
Average Value
Number
Average Value
Number
Average Value
Number
Average Value
LOANS ORIGINATED
22
$284,000
62
$221,790
72
$195,125
21
$87,095
10
$235,000
APPLICATIONS APPROVED, NOT ACCEPTED
1
$196,000
15
$258,133
13
$253,846
3
$17,333
1
$228,000
APPLICATIONS DENIED
4
$254,750
15
$249,067
45
$258,689
24
$49,000
3
$104,667
APPLICATIONS WITHDRAWN
4
$244,500
11
$235,909
29
$219,138
2
$406,500
1
$169,000
FILES CLOSED FOR INCOMPLETENESS
0
$0
0
$0
3
$201,667
0
$0
0
$0
Aggregated Statistics For Year 2007 (Based on 1 full tract)
A) FHA, FSA/RHS & VA Home Purchase Loans
B) Conventional Home Purchase Loans
C) Refinancings
D) Home Improvement Loans
E) Loans on Dwellings For 5+ Families
F) Non-occupant Loans on < 5 Family Dwellings (A B C & D)
G) Loans On Manufactured Home Dwelling (A B C & D)
Number
Average Value
Number
Average Value
Number
Average Value
Number
Average Value
Number
Average Value
Number
Average Value
Number
Average Value
LOANS ORIGINATED
10
$313,000
123
$222,480
150
$197,687
42
$66,571
1
$15,500,000
10
$220,900
0
$0
APPLICATIONS APPROVED, NOT ACCEPTED
0
$0
21
$218,762
35
$238,714
11
$100,727
0
$0
2
$185,000
1
$74,000
APPLICATIONS DENIED
2
$288,000
51
$253,745
125
$245,936
27
$103,519
0
$0
12
$227,417
0
$0
APPLICATIONS WITHDRAWN
1
$334,000
18
$206,111
59
$236,831
8
$77,000
1
$590,000
5
$263,000
0
$0
FILES CLOSED FOR INCOMPLETENESS
0
$0
4
$279,250
21
$237,667
0
$0
0
$0
0
$0
0
$0
Aggregated Statistics For Year 2006 (Based on 1 full tract)
A) FHA, FSA/RHS & VA Home Purchase Loans
B) Conventional Home Purchase Loans
C) Refinancings
D) Home Improvement Loans
F) Non-occupant Loans on < 5 Family Dwellings (A B C & D)
Number
Average Value
Number
Average Value
Number
Average Value
Number
Average Value
Number
Average Value
LOANS ORIGINATED
2
$265,000
174
$194,759
213
$213,061
51
$80,353
12
$225,917
APPLICATIONS APPROVED, NOT ACCEPTED
0
$0
19
$219,842
43
$201,419
18
$82,611
2
$244,000
APPLICATIONS DENIED
1
$292,000
32
$217,000
117
$209,291
31
$81,355
2
$277,500
APPLICATIONS WITHDRAWN
0
$0
42
$233,357
84
$226,679
21
$165,905
4
$267,000
FILES CLOSED FOR INCOMPLETENESS
0
$0
7
$262,286
18
$253,556
1
$45,000
0
$0
Aggregated Statistics For Year 2005 (Based on 1 full tract)
A) FHA, FSA/RHS & VA Home Purchase Loans
B) Conventional Home Purchase Loans
C) Refinancings
D) Home Improvement Loans
F) Non-occupant Loans on < 5 Family Dwellings (A B C & D)
G) Loans On Manufactured Home Dwelling (A B C & D)
Number
Average Value
Number
Average Value
Number
Average Value
Number
Average Value
Number
Average Value
Number
Average Value
LOANS ORIGINATED
0
$0
161
$212,329
242
$191,950
39
$79,436
12
$265,000
0
$0
APPLICATIONS APPROVED, NOT ACCEPTED
0
$0
30
$173,700
46
$187,478
13
$37,538
7
$162,571
4
$74,000
APPLICATIONS DENIED
1
$243,000
53
$221,698
95
$225,221
32
$106,125
12
$309,167
2
$96,000
APPLICATIONS WITHDRAWN
2
$298,500
33
$224,152
94
$196,862
11
$166,000
3
$221,333
0
$0
FILES CLOSED FOR INCOMPLETENESS
0
$0
18
$198,278
58
$227,793
0
$0
3
$97,333
0
$0
Aggregated Statistics For Year 2004 (Based on 1 full tract)
A) FHA, FSA/RHS & VA Home Purchase Loans
B) Conventional Home Purchase Loans
C) Refinancings
D) Home Improvement Loans
F) Non-occupant Loans on < 5 Family Dwellings (A B C & D)
G) Loans On Manufactured Home Dwelling (A B C & D)
Number
Average Value
Number
Average Value
Number
Average Value
Number
Average Value
Number
Average Value
Number
Average Value
LOANS ORIGINATED
4
$237,000
178
$199,764
265
$173,913
52
$85,500
25
$218,320
3
$29,000
APPLICATIONS APPROVED, NOT ACCEPTED
1
$161,000
36
$196,750
43
$210,814
11
$59,091
7
$163,714
1
$11,000
APPLICATIONS DENIED
1
$220,000
24
$219,667
94
$174,234
47
$67,681
6
$247,000
0
$0
APPLICATIONS WITHDRAWN
1
$255,000
30
$208,267
104
$189,837
18
$107,500
6
$205,833
2
$150,000
FILES CLOSED FOR INCOMPLETENESS
1
$295,000
9
$202,333
38
$204,053
3
$42,667
2
$247,500
0
$0
Aggregated Statistics For Year 2003 (Based on 1 full tract)
A) FHA, FSA/RHS & VA Home Purchase Loans
B) Conventional Home Purchase Loans
C) Refinancings
D) Home Improvement Loans
F) Non-occupant Loans on < 5 Family Dwellings (A B C & D)
Number
Average Value
Number
Average Value
Number
Average Value
Number
Average Value
Number
Average Value
LOANS ORIGINATED
27
$228,037
138
$173,246
492
$148,665
44
$30,341
24
$154,000
APPLICATIONS APPROVED, NOT ACCEPTED
0
$0
20
$176,850
75
$133,240
13
$31,231
3
$186,333
APPLICATIONS DENIED
2
$213,000
24
$163,500
147
$147,687
35
$39,600
4
$147,000
APPLICATIONS WITHDRAWN
3
$236,667
18
$194,833
147
$160,469
12
$25,417
2
$124,000
FILES CLOSED FOR INCOMPLETENESS
0
$0
9
$148,111
26
$163,115
0
$0
2
$164,000
Aggregated Statistics For Year 2002 (Based on 1 full tract)
A) FHA, FSA/RHS & VA Home Purchase Loans
B) Conventional Home Purchase Loans
C) Refinancings
D) Home Improvement Loans
F) Non-occupant Loans on < 5 Family Dwellings (A B C & D)
Number
Average Value
Number
Average Value
Number
Average Value
Number
Average Value
Number
Average Value
LOANS ORIGINATED
20
$193,700
141
$135,972
338
$134,249
54
$38,148
16
$119,875
APPLICATIONS APPROVED, NOT ACCEPTED
0
$0
21
$128,905
47
$117,043
18
$34,111
1
$71,000
APPLICATIONS DENIED
3
$177,000
24
$125,500
119
$133,622
40
$24,250
8
$147,000
APPLICATIONS WITHDRAWN
1
$131,000
6
$205,333
125
$127,288
19
$46,000
0
$0
FILES CLOSED FOR INCOMPLETENESS
0
$0
2
$160,500
33
$132,000
1
$112,000
1
$25,000
Aggregated Statistics For Year 2001 (Based on 1 full tract)
A) FHA, FSA/RHS & VA Home Purchase Loans
B) Conventional Home Purchase Loans
C) Refinancings
D) Home Improvement Loans
F) Non-occupant Loans on < 5 Family Dwellings (A B C & D)
Number
Average Value
Number
Average Value
Number
Average Value
Number
Average Value
Number
Average Value
LOANS ORIGINATED
19
$161,895
118
$123,881
220
$124,136
57
$36,947
9
$191,222
APPLICATIONS APPROVED, NOT ACCEPTED
1
$132,000
16
$126,688
46
$99,978
9
$30,778
3
$58,667
APPLICATIONS DENIED
9
$159,556
23
$152,174
139
$108,856
37
$23,108
9
$103,111
APPLICATIONS WITHDRAWN
1
$131,000
14
$127,357
84
$110,726
19
$28,526
1
$50,000
FILES CLOSED FOR INCOMPLETENESS
1
$113,000
2
$108,500
15
$107,200
1
$30,000
0
$0
Aggregated Statistics For Year 2000 (Based on 1 full tract)
A) FHA, FSA/RHS & VA Home Purchase Loans
B) Conventional Home Purchase Loans
C) Refinancings
D) Home Improvement Loans
F) Non-occupant Loans on < 5 Family Dwellings (A B C & D)
Number
Average Value
Number
Average Value
Number
Average Value
Number
Average Value
Number
Average Value
LOANS ORIGINATED
23
$138,304
109
$97,211
87
$93,609
34
$20,118
8
$102,750
APPLICATIONS APPROVED, NOT ACCEPTED
0
$0
22
$126,455
29
$88,069
16
$38,875
0
$0
APPLICATIONS DENIED
4
$116,750
34
$125,588
54
$79,944
28
$26,821
6
$79,000
APPLICATIONS WITHDRAWN
6
$135,833
7
$119,571
75
$92,400
6
$40,333
1
$144,000
FILES CLOSED FOR INCOMPLETENESS
1
$78,000
3
$160,333
10
$112,400
4
$21,750
0
$0
Aggregated Statistics For Year 1999 (Based on 1 full tract)
A) FHA, FSA/RHS & VA Home Purchase Loans
B) Conventional Home Purchase Loans
C) Refinancings
D) Home Improvement Loans
F) Non-occupant Loans on < 5 Family Dwellings (A B C & D)


 Recent articles from our blog. Our writers, many of them Ph.D. graduates or candidates, create easy-to-read articles on a wide variety of topics.

 (11.6 miles