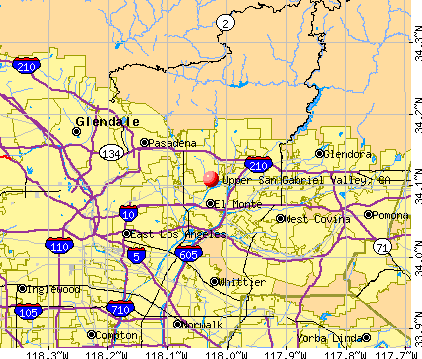
Upper San Gabriel Valley, California
Submit your own pictures of this place and show them to the world
- OSM Map
- General Map
- Google Map
- MSN Map
| Males: 160,140 | |
| Females: 167,291 |
| Median resident age: | 32.5 years |
| California median age: | 33.3 years |
Zip code: 91006
| Upper San Gabriel Valley: | $85,690 |
| CA: | $91,551 |
Estimated per capita income in 2022: $37,744 (it was $18,083 in 2000)
Upper San Gabriel Valley CCD income, earnings, and wages data
Estimated median house or condo value in 2022: $828,400 (it was $207,100 in 2000)
| Upper San Gabriel Valley: | $828,400 |
| CA: | $715,900 |
Mean prices in 2022: all housing units: over $1,000,000; detached houses: over $1,000,000; townhouses or other attached units: $750,854; in 2-unit structures: over $1,000,000; in 3-to-4-unit structures: $791,642; in 5-or-more-unit structures: $738,503; mobile homes: $205,184; occupied boats, rvs, vans, etc.: $276,239
Upper San Gabriel Valley, CA residents, houses, and apartments details
Detailed information about poverty and poor residents in Upper San Gabriel Valley, CA
Compare current foreclosures near Upper San Gabriel Valley, CA:


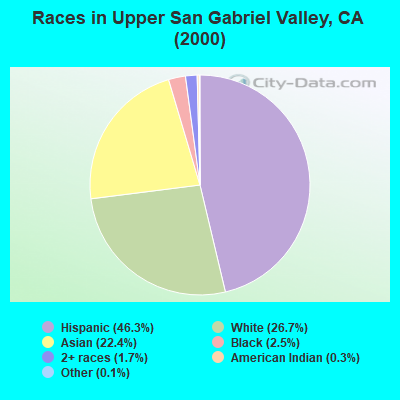
- 148,58646.3%Hispanic
- 85,58226.7%White alone
- 71,94222.4%Asian alone
- 7,8772.5%Black alone
- 5,4671.7%Two or more races
- 8080.3%American Indian alone
- 4720.1%Other race alone
- 2350.07%Native Hawaiian and Other
Pacific Islander alone
 Recent articles from our blog. Our writers, many of them Ph.D. graduates or candidates, create easy-to-read articles on a wide variety of topics.
Current Local Time: PST time zone
Land area: 49.4 square miles.
Population density: 6,624 people per square mile (high).

| Upper San Gabriel Valley CCD: | 0.8% ($1,625) |
| California: | 0.8% ($1,564) |
Nearest city with pop. 1,000,000+: Los Angeles, CA  (20.1 miles , pop. 3,694,820).
Nearest cities:
), ), )Latitude: 34.11 N, Longitude: 118.03 W
Area code commonly used in this area: 626

| Here: | 5.0% |
| California: | 5.1% |
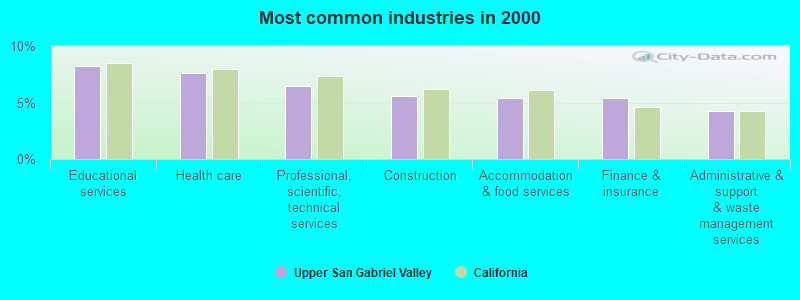
- Educational services (8.2%)
- Health care (7.6%)
- Professional, scientific, technical services (6.5%)
- Construction (5.6%)
- Accommodation & food services (5.4%)
- Finance & insurance (5.4%)
- Administrative & support & waste management services (4.3%)
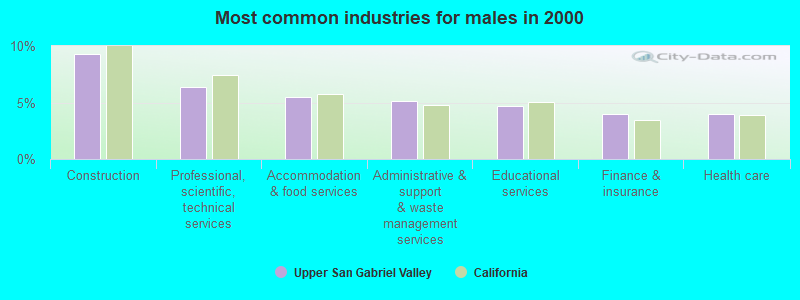
- Construction (9.3%)
- Professional, scientific, technical services (6.4%)
- Accommodation & food services (5.5%)
- Administrative & support & waste management services (5.1%)
- Educational services (4.7%)
- Finance & insurance (4.0%)
- Health care (4.0%)
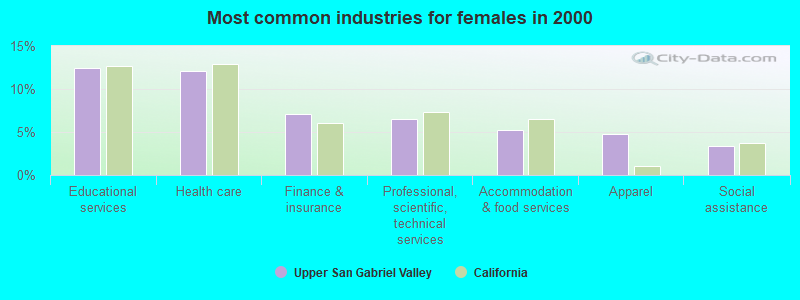
- Educational services (12.5%)
- Health care (12.0%)
- Finance & insurance (7.1%)
- Professional, scientific, technical services (6.6%)
- Accommodation & food services (5.3%)
- Apparel (4.8%)
- Social assistance (3.4%)
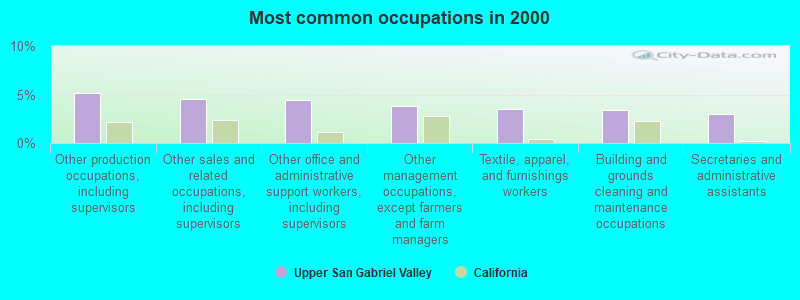
- Other production occupations, including supervisors (5.1%)
- Other sales and related occupations, including supervisors (4.5%)
- Other office and administrative support workers, including supervisors (4.4%)
- Other management occupations, except farmers and farm managers (3.8%)
- Textile, apparel, and furnishings workers (3.5%)
- Building and grounds cleaning and maintenance occupations (3.4%)
- Secretaries and administrative assistants (3.0%)
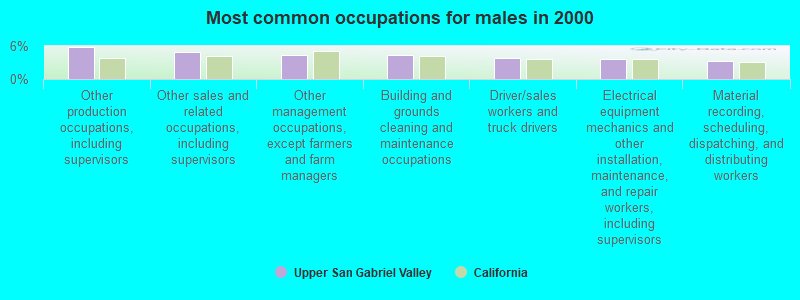
- Other production occupations, including supervisors (5.9%)
- Other sales and related occupations, including supervisors (4.9%)
- Other management occupations, except farmers and farm managers (4.4%)
- Building and grounds cleaning and maintenance occupations (4.3%)
- Driver/sales workers and truck drivers (3.8%)
- Electrical equipment mechanics and other installation, maintenance, and repair workers, including supervisors (3.7%)
- Material recording, scheduling, dispatching, and distributing workers (3.3%)
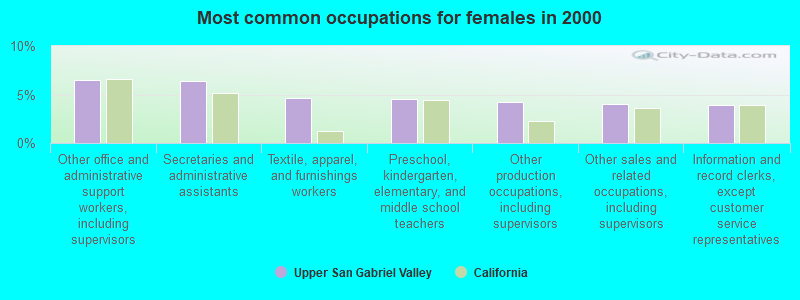
- Other office and administrative support workers, including supervisors (6.5%)
- Secretaries and administrative assistants (6.4%)
- Textile, apparel, and furnishings workers (4.6%)
- Preschool, kindergarten, elementary, and middle school teachers (4.5%)
- Other production occupations, including supervisors (4.3%)
- Other sales and related occupations, including supervisors (4.0%)
- Information and record clerks, except customer service representatives (3.9%)
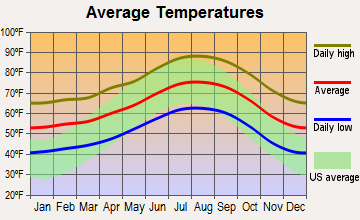
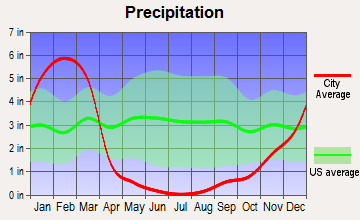
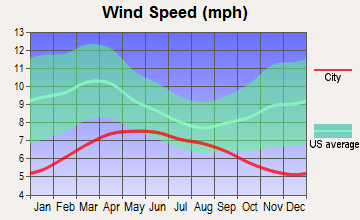
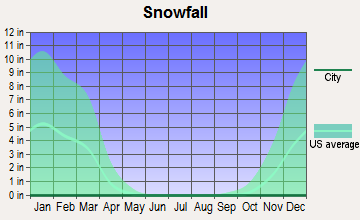
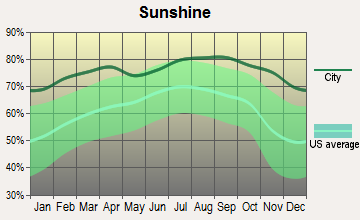
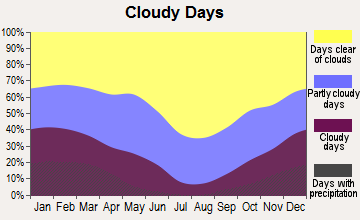
Average climate in Upper San Gabriel Valley, California
Based on data reported by over 4,000 weather stations

(lower is better)
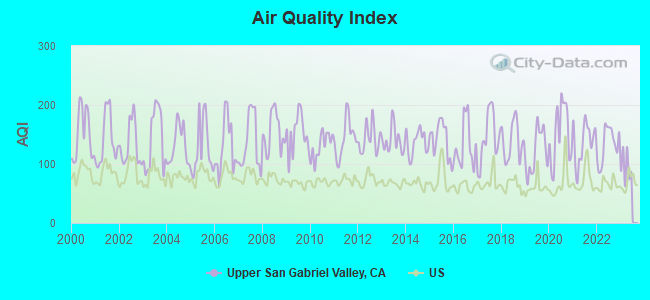
Air Quality Index (AQI) level in 2022 was 133. This is significantly worse than average.
| City: | 133 |
| U.S.: | 73 |
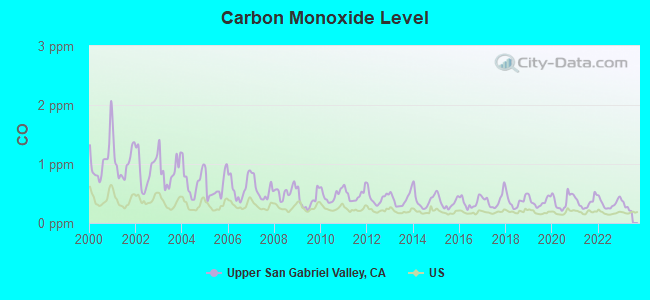
Carbon Monoxide (CO) [ppm] level in 2022 was 0.331. This is worse than average. Closest monitor was 2.4 miles away from the city center.
| City: | 0.331 |
| U.S.: | 0.251 |
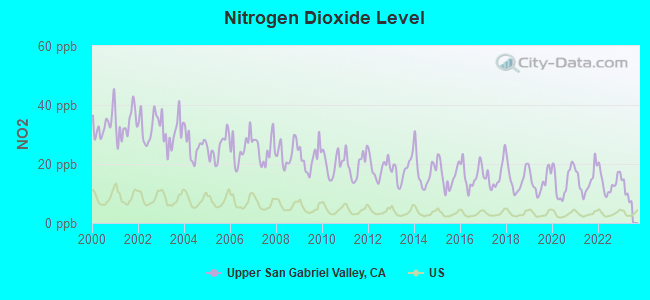
Nitrogen Dioxide (NO2) [ppb] level in 2022 was 13.7. This is significantly worse than average. Closest monitor was 1.9 miles away from the city center.
| City: | 13.7 |
| U.S.: | 5.1 |
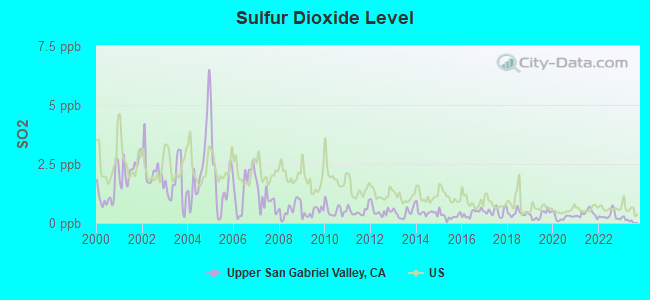
Sulfur Dioxide (SO2) [ppb] level in 2022 was 0.306. This is significantly better than average. Closest monitor was 1.9 miles away from the city center.
| City: | 0.306 |
| U.S.: | 1.515 |
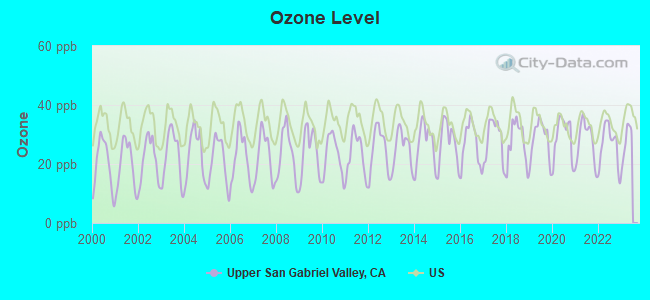
Ozone [ppb] level in 2022 was 26.5. This is better than average. Closest monitor was 1.9 miles away from the city center.
| City: | 26.5 |
| U.S.: | 33.3 |
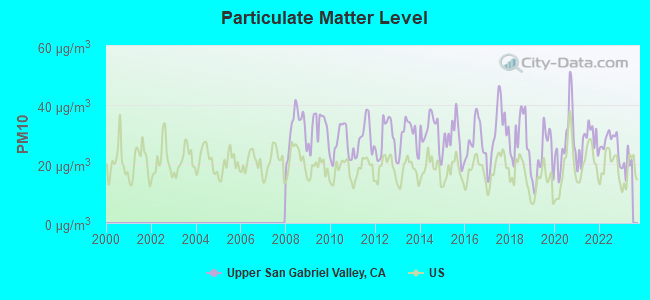
Particulate Matter (PM10) [µg/m3] level in 2022 was 27.1. This is significantly worse than average. Closest monitor was 6.2 miles away from the city center.
| City: | 27.1 |
| U.S.: | 19.2 |
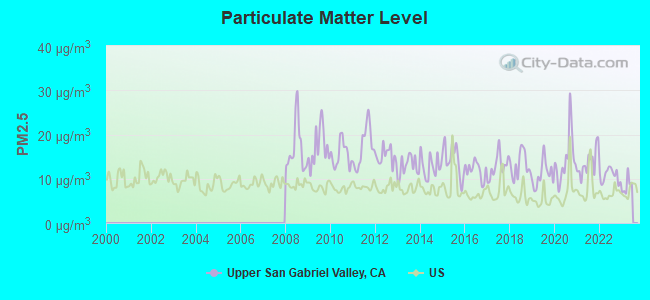
Particulate Matter (PM2.5) [µg/m3] level in 2022 was 10.8. This is worse than average. Closest monitor was 6.0 miles away from the city center.
| City: | 10.8 |
| U.S.: | 8.1 |
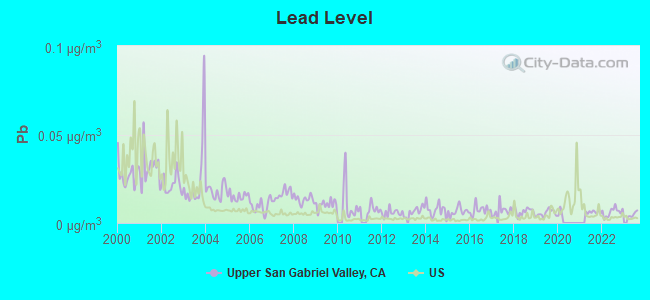
Lead (Pb) [µg/m3] level in 2022 was 0.00622. This is significantly better than average. Closest monitor was 3.6 miles away from the city center.
| City: | 0.00622 |
| U.S.: | 0.00931 |
Earthquake activity:
Upper San Gabriel Valley-area historical earthquake activity is significantly above California state average. It is 7165% greater than the overall U.S. average.On 7/21/1952 at 11:52:14, a magnitude 7.7 (7.7 UK, Class: Major, Intensity: VIII - XII) earthquake occurred 82.9 miles away from Upper San Gabriel Valley center, causing $50,000,000 total damage
On 6/28/1992 at 11:57:34, a magnitude 7.6 (6.2 MB, 7.6 MS, 7.3 MW, Depth: 0.7 mi) earthquake occurred 85.7 miles away from the city center, causing 3 deaths (1 shaking deaths, 2 other deaths) and 400 injuries, causing $100,000,000 total damage and $40,000,000 insured losses
On 10/16/1999 at 09:46:44, a magnitude 7.4 (6.3 MB, 7.4 MS, 7.2 MW, 7.3 ML) earthquake occurred 95.2 miles away from Upper San Gabriel Valley center
On 11/4/1927 at 13:51:53, a magnitude 7.5 (7.5 UK) earthquake occurred 180.1 miles away from the city center
On 1/17/1994 at 12:30:55, a magnitude 6.8 (6.4 MB, 6.8 MS, 6.7 MW, Depth: 11.4 mi, Class: Strong, Intensity: VII - IX) earthquake occurred 31.6 miles away from the city center, causing 60 deaths (60 shaking deaths) and 7000 injuries
On 4/21/1918 at 22:32:30, a magnitude 6.8 (6.8 UK) earthquake occurred 39.4 miles away from the city center
Magnitude types: body-wave magnitude (MB), local magnitude (ML), surface-wave magnitude (MS), moment magnitude (MW)
Natural disasters:
The number of natural disasters in Los Angeles County (57) is a lot greater than the US average (15).Major Disasters (Presidential) Declared: 27
Emergencies Declared: 3
Causes of natural disasters: Fires: 37, Floods: 16, Storms: 9, Winter Storms: 6, Landslides: 5, Mudslides: 5, Earthquakes: 3, Freeze: 1, Heavy Rain: 1, Hurricane: 1, Snow: 1, Tornado: 1, Wind: 1, Other: 1 (Note: some incidents may be assigned to more than one category).
Hospitals and medical centers near Upper San Gabriel Valley:
- NMC HOMECARE (Home Health Center, about 1 miles away; ARCADIA, CA)
- BALDWIN GARDENS NURSING CENTER (Nursing Home, about 1 miles away; TEMPLE CITY, CA)
- TEMPLE CITY CONVALESCENT HOSP (Nursing Home, about 1 miles away; TEMPLE CITY, CA)
- SANTA ANITA CONVALESCENT HOSP (Nursing Home, about 2 miles away; TEMPLE CITY, CA)
- FIDELITY HEALTH CARE (Nursing Home, about 2 miles away; EL MONTE, CA)
- ALLIANCE CHERRYLEE CENTER (Nursing Home, about 2 miles away; EL MONTE, CA)
- ALLIANCE EL MONTE CARE CENTER (Nursing Home, about 2 miles away; EL MONTE, CA)
Amtrak stations near Upper San Gabriel Valley:
- 7 miles: PASADENA (150 S. ROBLES AVE.) - Bus Station . Services: fully wheelchair accessible, enclosed waiting area, public restrooms, public payphones, full-service food facilities, paid short-term parking, paid long-term parking, taxi stand, public transit connection.
- 13 miles: LOS ANGELES (800 N. ALAMEDA ST.) . Services: ticket office, fully wheelchair accessible, enclosed waiting area, public restrooms, public payphones, snack bar, free short-term parking, paid long-term parking, car rental agency, taxi stand, public transit connection.
- 14 miles: GLENDALE (400 W. CERRITOS AVE.) . Services: fully wheelchair accessible, public payphones, free short-term parking, free long-term parking, call for taxi service, intercity bus service, public transit connection.
Colleges/universities with over 2000 students nearest to Upper San Gabriel Valley:
- Pasadena City College (about 6 miles; Pasadena, CA; Full-time enrollment: 14,712)
- California Institute of Technology (about 7 miles; Pasadena, CA; FT enrollment: 2,246)
- Rio Hondo College (about 7 miles; Whittier, CA; FT enrollment: 9,610)
- Le Cordon Bleu College of Culinary Arts-Pasadena (about 7 miles; Pasadena, CA; FT enrollment: 2,934)
- Hacienda La Puente Adult Education (about 8 miles; La Puente, CA; FT enrollment: 2,750)
- Azusa Pacific University (about 9 miles; Azusa, CA; FT enrollment: 9,427)
- Citrus College (about 9 miles; Glendora, CA; FT enrollment: 8,456)
Points of interest:
Notable locations in Upper San Gabriel Valley: Whittier Narrows Water Reclamation Plant (A), Site of Mission Vieja Station (B), Westminster Gardens (C), Santa Anita Golf Course (D), Rancho Duarte Golf Course (E), Arcadia Golf Course (F), Norwood Branch County of Los Angeles Public Library (G), Live Oak Branch County of Los Angeles Public Library (H), Carl W Mischke Memorial Library (I), Arcadia Public Library (J), Sierra Madre City Hall (K), Barlow Villa (L), South El Monte Branch County of Los Angeles Public Library (M), Sierra Madre Public Library (N), Mount Oliva Passionist Fathers Home (O), Monrovia Public Library (P), Monrovia City Hall (Q), El Monte Branch County of Los Angeles Public Library (R), Duarte City Hall (S), Duarte Branch County of Los Angeles Public Library (T). Display/hide their locations on the map
Shopping Centers: Aracadia Gateway Centre Shopping Center (1), Temple City Square Shopping Center (2), El Monte Shopping Center (3), Santa Anita Fashion Park Shopping Center (4), Mountain Vista Plaza Shopping Center (5), Monrovia Shopping Center (6), Huntington Oaks Shopping Center (7), Foothill Park Plaza Shopping Center (8), Five Points Plaza Shopping Center (9). Display/hide their locations on the map
Churches in Upper San Gabriel Valley include: Arcadia Presbyterian Church (A), Church of the Good Shepherd (B), Congregation Shaarei Torah (C), Mandarin Baptist Church (D), San Gabriel Valley Chinese Church (E), Victory Chapel (F), Chinese Alliance Bible Church (G), Church of Christ (H), Church of the Foothills (I). Display/hide their locations on the map
Cemeteries: Liveoak Cemetery (1), Sierra Madre Cemetery (2). Display/hide their locations on the map
Lakes and reservoirs: Legg Lake (A), Baldwin Lake (B), Whittier Narrows Reservoir (C). Display/hide their locations on the map
Streams, rivers, and creeks: Eaton Wash (A), Arcadia Wash (B), Sawpit Wash (C), Santa Anita Wash (D), Rubio Wash (E), Mission Creek (F). Display/hide their locations on the map
Parks in Upper San Gabriel Valley include: Arcadia County Park (1), Arcadia Wilderness Park (2), Bonita Park (3), Duarte Park (4), Lambert Park (5), Live Oak Park (6), Monrovia Mountain Park (7), Mountain View Park (8), Olive Park (9). Display/hide their locations on the map
| This place: | 3.3 people |
| California: | 2.9 people |
| This place: | 76.6% |
| Whole state: | 68.7% |
| This place: | 5.7% |
| Whole state: | 7.2% |
Likely homosexual households (counted as self-reported same-sex unmarried-partner households)
- Lesbian couples: 0.4% of all households
- Gay men: 0.3% of all households
| This place: | 16.3% |
| Whole state: | 14.2% |
| This place: | 6.9% |
| Whole state: | 6.3% |
People in group quarters in Upper San Gabriel Valley in 2010:
- 1,938 people in nursing facilities/skilled-nursing facilities
- 662 people in workers' group living quarters and job corps centers
- 170 people in other noninstitutional facilities
- 144 people in residential treatment centers for adults
- 82 people in emergency and transitional shelters (with sleeping facilities) for people experiencing homelessness
- 74 people in correctional residential facilities
- 68 people in group homes intended for adults
- 50 people in residential treatment centers for juveniles (non-correctional)
- 45 people in group homes for juveniles (non-correctional)
- 13 people in in-patient hospice facilities
People in group quarters in Upper San Gabriel Valley in 2000:
- 2,232 people in nursing homes
- 468 people in other noninstitutional group quarters
- 393 people in other group homes
- 133 people in homes for the mentally retarded
- 90 people in homes for the mentally ill
- 89 people in hospitals/wards and hospices for chronically ill
- 89 people in hospices or homes for chronically ill
- 77 people in schools, hospitals, or wards for the intellectually disabled
- 66 people in homes or halfway houses for drug/alcohol abuse
- 48 people in religious group quarters
- 47 people in other nonhousehold living situations
- 15 people in hospitals or wards for drug/alcohol abuse
- 8 people in training schools for juvenile delinquents
For population 15 years and over in Upper San Gabriel Valley:
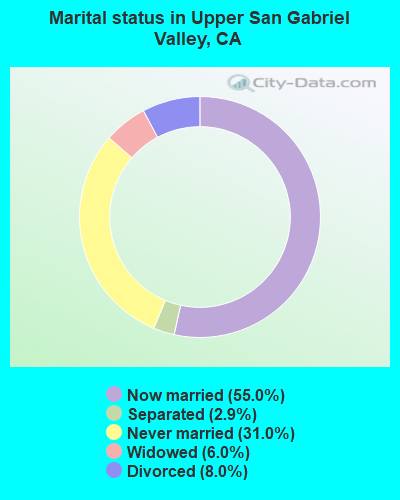
- Never married: 31.0%
- Now married: 55.0%
- Separated: 2.9%
- Widowed: 6.0%
- Divorced: 8.0%
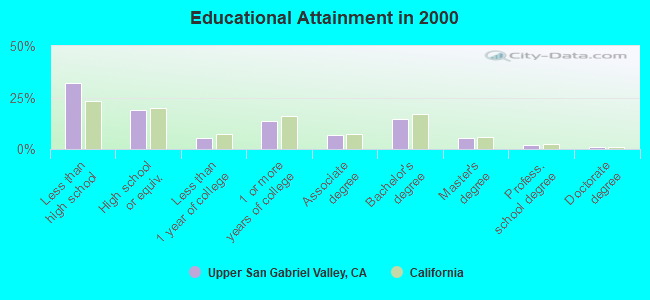
For population 25 years and over in Upper San Gabriel Valley:
- High school or higher: 68.0%
- Bachelor's degree or higher: 22.9%
- Graduate or professional degree: 8.1%
- Unemployed: 7.0%
- Mean travel time to work (commute): 27.5 minutes
| Here: | 19.7 |
| California average: | 16.1 |


Graphs represent county-level data. Detailed 2008 Election Results
Religion statistics for Upper San Gabriel Valley, CA (based on Los Angeles County data)


| Religion | Adherents | Congregations |
|---|---|---|
| Catholic | 3,542,994 | 275 |
| Evangelical Protestant | 814,611 | 3,249 |
| Other | 451,594 | 1,023 |
| Mainline Protestant | 229,056 | 860 |
| Black Protestant | 112,338 | 290 |
| Orthodox | 63,517 | 76 |
| None | 4,604,495 | - |
Food Environment Statistics:
| Los Angeles County: | 2.12 / 10,000 pop. |
| California: | 2.14 / 10,000 pop. |
| This county: | 0.03 / 10,000 pop. |
| California: | 0.04 / 10,000 pop. |
| This county: | 0.58 / 10,000 pop. |
| California: | 0.62 / 10,000 pop. |
| This county: | 1.23 / 10,000 pop. |
| State: | 1.49 / 10,000 pop. |
| Los Angeles County: | 7.15 / 10,000 pop. |
| State: | 7.42 / 10,000 pop. |
| Los Angeles County: | 7.5% |
| State: | 7.3% |
| Here: | 20.4% |
| California: | 21.3% |
| Los Angeles County: | 18.6% |
| California: | 17.9% |
2.98% of this county's 2021 resident taxpayers lived in other counties in 2020 ($81,235 average adjusted gross income)
| Here: | 2.98% |
| California average: | 5.19% |
0.01% of residents moved from foreign countries ($155 average AGI)
Los Angeles County: 0.01% California average: 0.03%
Top counties from which taxpayers relocated into this county between 2020 and 2021:
| from Orange County, CA | |
| from San Bernardino County, CA | |
| from Riverside County, CA |
4.68% of this county's 2020 resident taxpayers moved to other counties in 2021 ($97,324 average adjusted gross income)
| Here: | 4.68% |
| California average: | 6.14% |
0.01% of residents moved to foreign countries ($196 average AGI)
Los Angeles County: 0.01% California average: 0.02%
Top counties to which taxpayers relocated from this county between 2020 and 2021:
| to Orange County, CA | |
| to San Bernardino County, CA | |
| to Riverside County, CA |
Strongest AM radio stations in Upper San Gabriel Valley:
- KLAC (570 AM; 50 kW; LOS ANGELES, CA; Owner: AMFM RADIO LICENSES, L.L.C.)
- KDIS (1110 AM; 50 kW; PASADENA, CA; Owner: ABC,INC.)
- KTNQ (1020 AM; 50 kW; LOS ANGELES, CA; Owner: KTNQ-AM LICENSE CORP.)
- KXTA (1150 AM; 50 kW; LOS ANGELES, CA; Owner: CITICASTERS LICENSES, L.P.)
- KFWB (980 AM; 50 kW; LOS ANGELES, CA; Owner: INFINITY BROADCASTING OPERATIONS, INC.)
- KMPC (1540 AM; 50 kW; LOS ANGELES, CA; Owner: ROSE CITY RADIO CORPORATION)
- KMRB (1430 AM; 5 kW; SAN GABRIEL, CA; Owner: POLYETHNIC BROADCASTING, INC.)
- KFI (640 AM; 50 kW; LOS ANGELES, CA; Owner: CAPSTAR TX LIMITED PARTNERSHIP)
- KXMX (1190 AM; 25 kW; ANAHEIM, CA; Owner: NEW INSPIRATION BROADCASTING COMPANY)
- KBLA (1580 AM; 50 kW; SANTA MONICA, CA)
- KAZN (1300 AM; 5 kW; PASADENA, CA; Owner: MULTICULTURAL RADIO BROADCASTING, INC.)
- KRLA (870 AM; 20 kW; GLENDALE, CA; Owner: NEW INSPIRATION BROADCASTING COMPANY)
- KSPN (710 AM; 50 kW; LOS ANGELES, CA; Owner: KABC-AM RADIO, INC.)
Strongest FM radio stations in Upper San Gabriel Valley:
- KCBS-FM (93.1 FM; LOS ANGELES, CA; Owner: INFINITY BROADCASTING OPERATIONS, INC.)
- KSCA (101.9 FM; GLENDALE, CA; Owner: HBC LICENSE CORPORATION)
- KOST (103.5 FM; LOS ANGELES, CA; Owner: CAPSTAR TX LIMITED PARTNERSHIP)
- KLOS (95.5 FM; LOS ANGELES, CA; Owner: KLOS-FM RADIO, INC.)
- K212FA (90.3 FM; TEMPLE CITY, CA; Owner: EDUCATIONAL MEDIA FOUNDATION)
- KIIS-FM (102.7 FM; LOS ANGELES, CA; Owner: CITICASTERS LICENSES, L.P.)
- KPCC (89.3 FM; PASADENA, CA; Owner: PASADENA AREA COMMUNITY COLLEGE DISTRICT)
- KLVE (107.5 FM; LOS ANGELES, CA; Owner: KLVE-FM LICENSE CORP.)
- KHHT (92.3 FM; LOS ANGELES, CA; Owner: AMFM RADIO LICENSES, L.L.C.)
- KTWV (94.7 FM; LOS ANGELES, CA; Owner: INFINITY BROADCASTING OPERATIONS, INC.)
- KBIG-FM (104.3 FM; LOS ANGELES, CA; Owner: AMFM RADIO LICENSES, L.L.C.)
- KMZT-FM (105.1 FM; LOS ANGELES, CA; Owner: MOUNT WILSON FM BROADCASTERS, INC.)
- K216EM (91.1 FM; ARCADIA, CA; Owner: LIFE ON THE WAY COMMUNICATIONS, INC.)
- KPFK (90.7 FM; LOS ANGELES, CA; Owner: PACIFICA FOUNDATION, INC)
- KZLA-FM (93.9 FM; LOS ANGELES, CA; Owner: EMMIS RADIO LICENSE CORPORATION)
- KPWR (105.9 FM; LOS ANGELES, CA; Owner: EMMIS RADIO LICENSE CORPORATION)
- KLSX (97.1 FM; LOS ANGELES, CA; Owner: INFINITY BROADCASTING OPERATIONS, INC.)
- KUSC (91.5 FM; LOS ANGELES, CA; Owner: UNIVERSITY OF SOUTHERN CALIFORNIA)
- KKLA-FM (99.5 FM; LOS ANGELES, CA; Owner: NEW INSPIRATION BROADCASTING CO., INC.)
- KRTH-FM (101.1 FM; LOS ANGELES, CA; Owner: INFINITY BROADCASTING OPERATIONS, INC.)
TV broadcast stations around Upper San Gabriel Valley:
- KCBS-TV (Channel 2; LOS ANGELES, CA; Owner: CBS BROADCASTING INC.)
- KTLA-TV (Channel 5; LOS ANGELES, CA; Owner: KTLA INC.)
- KABC-TV (Channel 7; LOS ANGELES, CA; Owner: ABC HOLDING COMPANY, INC.)
- KNBC (Channel 4; LOS ANGELES, CA; Owner: NBC SUBSIDIARY (KNBC-TV), INC.)
- KCAL-TV (Channel 9; LOS ANGELES, CA; Owner: VIACOM TELEVISION STATIONS GROUP OF LOS ANGELES LLC)
- KTRO-LP (Channel 50; LANCASTER, CA; Owner: ROBERT D. ADELMAN)
- KSCI (Channel 18; LONG BEACH, CA; Owner: KSLS, INC.)
- KMEX-TV (Channel 34; LOS ANGELES, CA; Owner: KMEX LICENSE PARTNERSHIP, G.P.)
- KAZA-TV (Channel 54; AVALON, CA; Owner: PAPPAS SOUTHERN CALIFORNIA LICENSE LLC)
- KDOC-TV (Channel 56; ANAHEIM, CA; Owner: GOLDEN ORANGE BROADCASTING CO., INC.)
- KOCE-TV (Channel 50; HUNTINGTON BEACH, CA; Owner: BD. OF TRUSTEES, COAST COMMUNITY COLLEGE DIST.)
- KCET (Channel 28; LOS ANGELES, CA; Owner: COMMUNITY TELEVISION OF SOUTHERN CALIFORNIA)
- KXLA (Channel 44; RANCHO PALOS VERDES, CA; Owner: RANCHO PALOS VERDES BROADCASTERS, INC.)
- KFTR (Channel 46; ONTARIO, CA; Owner: TELEFUTURA LOS ANGELES LLC)
- KTTV (Channel 11; LOS ANGELES, CA; Owner: FOX TELEVISION STATIONS, INC.)
- KVEA (Channel 52; CORONA, CA; Owner: ESTRELLA LICENSE CORPORATION)
- KWHY-TV (Channel 22; LOS ANGELES, CA; Owner: TELEMUNDO OF LOS ANGELES LICENSE CORPORATION)
- KCOP-TV (Channel 13; LOS ANGELES, CA; Owner: FOX TELEVISION STATIONS, INC.)
- KSFV-LP (Channel 26; SAN FERNANDO VALLEY, CA; Owner: VENTURE TECHNOLOGIES GROUP, LLC)
- KTBN-TV (Channel 40; SANTA ANA, CA; Owner: TRINITY BROADCASTING NETWORK, INC.)
- KHIZ (Channel 64; BARSTOW, CA; Owner: SUNBELT TELEVISION, INC.)
- KLCS (Channel 58; LOS ANGELES, CA; Owner: LOS ANGELES UNIFIED SCHOOL DISTRICT)
- KHTV-LP (Channel 48; INLAND EMPIRE, CA; Owner: VENTURE TECHNOLOGIES GROUP, LLC)
- KLAU-LP (Channel 66; REDLANDS, CA; Owner: GERALD BENAVIDES)
- KNET-LP (Channel 38; LOS ANGELES, CA; Owner: VENTURE TECHNOLOGIES GROUP, LLC)
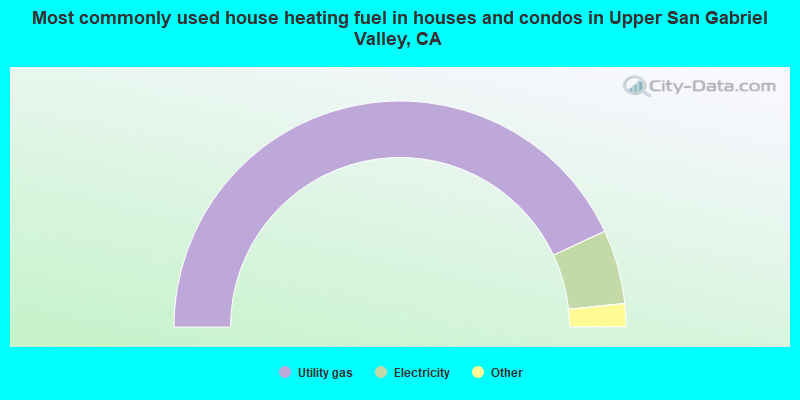
- 86.1%Utility gas
- 10.6%Electricity
- 1.5%No fuel used
- 1.3%Bottled, tank, or LP gas
- 0.3%Wood
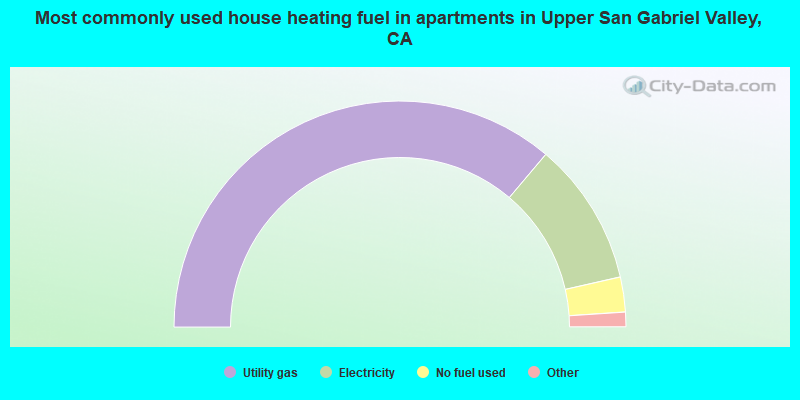
- 72.4%Utility gas
- 20.6%Electricity
- 5.0%No fuel used
- 1.4%Bottled, tank, or LP gas
- 0.2%Solar energy
- 0.2%Wood
- 0.2%Other fuel
Upper San Gabriel Valley compared to California state average:
- Unemployed percentage below state average.
- Black race population percentage below state average.
- Foreign-born population percentage significantly below state average.
- Length of stay since moving in significantly above state average.
- Number of rooms per house significantly below state average.
- House age significantly below state average.
Upper San Gabriel Valley, CA compared to other similar cities:
Upper San Gabriel Valley on our top lists:
- #1 on the list of "Top 101 cities with largest percentage of males in industries: apparel (population 50,000+)"
- #1 on the list of "Top 101 cities with largest percentage of males in occupations: textile, apparel, and furnishings workers (population 50,000+)"
- #1 on the list of "Top 101 cities with largest percentage of males in industries: furniture and related product manufacturing (population 50,000+)"
- #2 on the list of "Top 101 cities with largest percentage of females in industries: apparel (population 50,000+)"
- #2 on the list of "Top 101 cities with largest percentage of females in occupations: textile, apparel, and furnishings workers (population 50,000+)"
- #2 on the list of "Top 101 cities with largest percentage of females in occupations: other production occupations including supervisors (population 50,000+)"
- #3 on the list of "Top 101 cities with largest percentage of females in industries: miscellaneous nondurable goods merchant wholesalers (population 50,000+)"
- #3 on the list of "Top 101 cities with largest percentage of females in industries: furniture and related product manufacturing (population 50,000+)"
- #4 on the list of "Top 101 cities with largest percentage of females in industries: textile mills and textile products (population 50,000+)"
- #4 on the list of "Top 101 cities with largest percentage of males in industries: textile mills and textile products (population 50,000+)"
- #4 on the list of "Top 101 cities with largest percentage of females in occupations: laborers and material movers, hand (population 50,000+)"
- #5 on the list of "Top 101 cities with largest percentage of females in industries: miscellaneous durable goods merchant wholesalers (population 50,000+)"
- #5 on the list of "Top 101 cities with largest percentage of males in industries: miscellaneous nondurable goods merchant wholesalers (population 50,000+)"
- #5 on the list of "Top 101 cities with largest percentage of females in industries: apparel, fabrics, and notions merchant wholesalers (population 50,000+)"
- #5 on the list of "Top 101 cities with largest percentage of females in industries: plastics and rubber products (population 50,000+)"
- #6 on the list of "Top 101 cities with largest percentage of males in industries: printing and related support activities (population 50,000+)"
- #7 on the list of "Top 101 cities with largest percentage of females in industries: groceries and related products merchant wholesalers (population 50,000+)"
- #7 on the list of "Top 101 cities with largest percentage of males in industries: retail florists (population 50,000+)"
- #8 on the list of "Top 101 cities with largest percentage of females in industries: recyclable material merchant wholesalers (population 50,000+)"
- #8 on the list of "Top 101 cities with largest percentage of males in industries: leather and allied products (population 50,000+)"
- #1 on the list of "Top 101 counties with the most Evangelical Protestant congregations"
- #1 on the list of "Top 101 counties with the most Mainline Protestant congregations"
- #1 on the list of "Top 101 counties with the most Orthodox adherents"
- #1 on the list of "Top 101 counties with the highest ground withdrawal of fresh water for public supply (pop. 50,000+)"
- #1 on the list of "Top 101 counties with the most Catholic adherents (pop. 50,000+)"