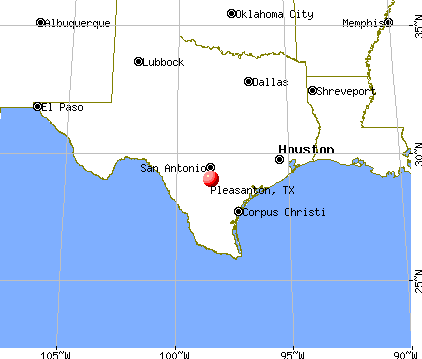
Pleasanton, Texas
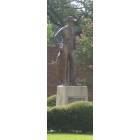
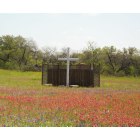
Pleasanton: The Cowboy Statue in front of Pleasanton's City Hall taken on 8/18/07.
Pleasanton: Roadway into Pleasanton
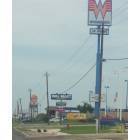
Pleasanton: The signs of businesses along Hwy. 97 in Pleasanton, Texas
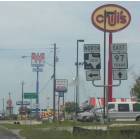
Pleasanton: The signs of businesses along Hwy. 97 in Pleasanton, Texas
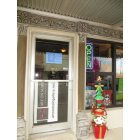
Pleasanton: Art On Main Gallery
Pleasanton: Indian Paintbrush in the Springtime
- add
your
Submit your own pictures of this city and show them to the world
- OSM Map
- General Map
- Google Map
- MSN Map
Population change since 2000: +33.1%
 |
| Males: 5,247 | |
| Females: 5,757 |
| Median resident age: | 34.9 years |
| Texas median age: | 35.6 years |
Zip codes: 78064.
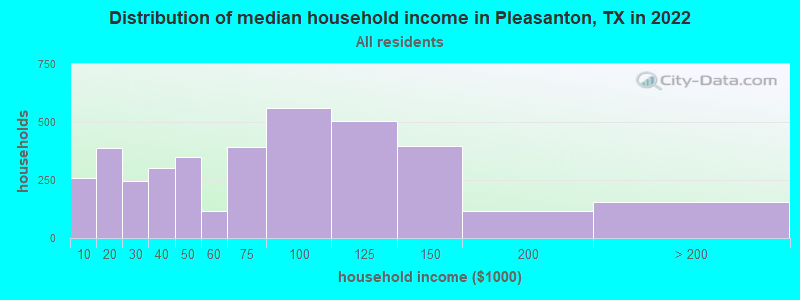
| Pleasanton: | $69,958 |
| TX: | $72,284 |
Estimated per capita income in 2022: $27,485 (it was $14,878 in 2000)
Pleasanton city income, earnings, and wages data
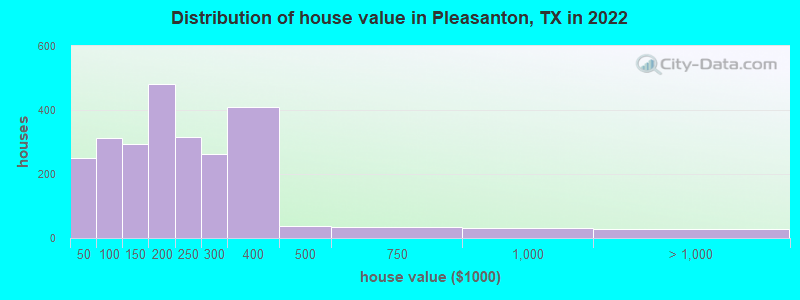
Estimated median house or condo value in 2022: $205,740 (it was $54,300 in 2000)
| Pleasanton: | $205,740 |
| TX: | $275,400 |
Mean prices in 2022: all housing units: $228,387; detached houses: $264,515; mobile homes: $85,948
Median gross rent in 2022: $1,079.
(9.6% for White Non-Hispanic residents, 14.2% for Hispanic or Latino residents, 23.3% for other race residents, 26.0% for two or more races residents)
Detailed information about poverty and poor residents in Pleasanton, TX


Compare current foreclosures near Pleasanton, TX:
| Photo | Address | Area | Beds / Baths | Price | Details |
|---|---|---|---|---|---|

|
#1
N Main St
Pleasanton, TX 78064
|
1,627 sq. feet
|
2 baths 3 beds |
show details | |

|
#2
Vivian St
Pleasanton, TX 78064
|
- sq. feet
|
2 baths 3 beds |
show details | |

|
#3
W Goodwin St
Pleasanton, TX 78064
|
1,865 sq. feet
|
- baths - beds |
show details | |

|
#4
Winship Rd
Pleasanton, TX 78064
|
- sq. feet
|
- baths - beds |
show details | |

|
#5
W Oaklawn Rd # 10103
Pleasanton, TX 78064
|
- sq. feet
|
- baths - beds |
show details | |

|
#6
Park St
Pleasanton, TX 78064
|
- sq. feet
|
- baths - beds |
show details | |

|
#7
Trails End
Pleasanton, TX 78064
|
- sq. feet
|
- baths - beds |
show details | |

|
#8
Edgehill
Pleasanton, TX 78064
|
2,164 sq. feet
|
- baths - beds |
show details | |

|
#9
Brian Dr
Pleasanton, TX 78064
|
1,954 sq. feet
|
- baths - beds |
show details | |

|
#10
Yorktown
Pleasanton, TX 78064
|
2,096 sq. feet
|
- baths - beds |
show details |
| Photo | Address | Area | Beds / Baths | Price | Details |
|---|---|---|---|---|---|

|
#11
Maia St
Pleasanton, TX 78064
|
1,152 sq. feet
|
- baths - beds |
show details | |

|
#12
Persimmon Dr
Pleasanton, TX 78064
|
- sq. feet
|
- baths - beds |
show details | |

|
#13
Avenue F
Poteet, TX 78065
|
1,452 sq. feet
|
2 baths 3 beds |
$209,900
|
show details |

|
#14
Karen Ln
Poteet, TX 78065
|
1,992 sq. feet
|
2 baths 4 beds |
show details | |

|
#15
Forest Dr
San Antonio, TX 78264
|
856 sq. feet
|
1 baths 2 beds |
show details | |

|
#16
Sunset Rd
San Antonio, TX 78264
|
1,342 sq. feet
|
1 baths 3 beds |
show details | |

|
#17
Grapeland Dr
San Antonio, TX 78264
|
1,711 sq. feet
|
2 baths 3 beds |
show details | |

|
#18
Hickory Pass
San Antonio, TX 78264
|
1,160 sq. feet
|
1 baths 3 beds |
show details | |

|
#19
Woodland Hills Rd
Poteet, TX 78065
|
1,024 sq. feet
|
- baths - beds |
show details | |

|
#20
Fm 2504
Poteet, TX 78065
|
- sq. feet
|
- baths - beds |
show details |
| Photo | Address | Area | Beds / Baths | Price | Details |
|---|---|---|---|---|---|

|
#21
Shady Forest Dr
Elmendorf, TX 78112
|
1,216 sq. feet
|
- baths - beds |
show details | |

|
#22
W Farm To Market 140
Charlotte, TX 78011
|
- sq. feet
|
- baths - beds |
show details | |

|
#23
Grand Spg
Elmendorf, TX 78112
|
- sq. feet
|
- baths - beds |
show details | |

|
#24
Clear Lake Loop
Poteet, TX 78065
|
- sq. feet
|
- baths - beds |
show details | |

|
#25
Fm 1333
Charlotte, TX 78011
|
- sq. feet
|
- baths - beds |
show details | |

|
#26
Eichman Rd
Von Ormy, TX 78073
|
4,852 sq. feet
|
- baths - beds |
show details | |

|
#27
County Road 104
Floresville, TX 78114
|
924 sq. feet
|
- baths - beds |
show details | |

|
#28
Alanwood Dr Lot 1
San Antonio, TX 78264
|
952 sq. feet
|
- baths - beds |
show details | |

|
#29
Dragon Rock Rd
Elmendorf, TX 78112
|
- sq. feet
|
- baths - beds |
show details | |

|
#30
Opportunity Dr
Elmendorf, TX 78112
|
- sq. feet
|
- baths - beds |
show details |
| Photo | Address | Area | Beds / Baths | Price | Details |
|---|---|---|---|---|---|

|
#31
Savannah Hts
Von Ormy, TX 78073
|
2,128 sq. feet
|
- baths - beds |
show details | |

|
#32
Hackberry Pt
San Antonio, TX 78264
|
- sq. feet
|
- baths - beds |
show details | |

|
#33
Lozano Rd
Poteet, TX 78065
|
- sq. feet
|
- baths - beds |
show details | |

|
#34
Cantrell Ave
Jourdanton, TX 78026
|
588 sq. feet
|
- baths - beds |
show details | |

|
#35
Cantrell Ave
Jourdanton, TX 78026
|
1,370 sq. feet
|
- baths - beds |
show details | |

|
#36
140 Hwy W
Jourdanton, TX 78026
|
- sq. feet
|
- baths - beds |
show details | |

|
#37
Fm 2146
Jourdanton, TX 78026
|
- sq. feet
|
- baths - beds |
show details | |

|
#38
School Dr
Poteet, TX 78065
|
- sq. feet
|
- baths - beds |
show details | |

|
#39
Coble Rd
Poteet, TX 78065
|
1,650 sq. feet
|
- baths - beds |
show details | |

|
#40
Us Highway 281 S # 212
San Antonio, TX 78264
|
- sq. feet
|
- baths - beds |
show details |
| Photo | Address | Area | Beds / Baths | Price | Details |
|---|---|---|---|---|---|

|
#41
Hickory Rd
Poteet, TX 78065
|
2,030 sq. feet
|
- baths - beds |
show details | |

|
#42
Hickory Rd
Poteet, TX 78065
|
- sq. feet
|
- baths - beds |
show details | |

|
#43
Big Oak Dr
San Antonio, TX 78264
|
- sq. feet
|
- baths - beds |
show details | |

|
#44
Mesquite Cv
San Antonio, TX 78264
|
- sq. feet
|
- baths - beds |
show details | |

|
#45
Hackberry Loop
San Antonio, TX 78264
|
- sq. feet
|
- baths - beds |
show details | |

|
#46
Early Rise Dr
Elmendorf, TX 78112
|
- sq. feet
|
- baths - beds |
show details | |

|
#47
Dragon Rock Rd
Elmendorf, TX 78112
|
- sq. feet
|
- baths - beds |
show details | |

|
#48
Hickory Shadow
Elmendorf, TX 78112
|
- sq. feet
|
- baths - beds |
show details | |

|
#49
Mathis Rd
Elmendorf, TX 78112
|
- sq. feet
|
- baths - beds |
show details | |

|
Check over 1 million property listings on Foreclosure.com!
|
browse all offers | |||


- 6,52059.3%Hispanic
- 3,98636.3%White alone
- 1741.6%Black alone
- 1621.5%Two or more races
- 1101.0%Asian alone
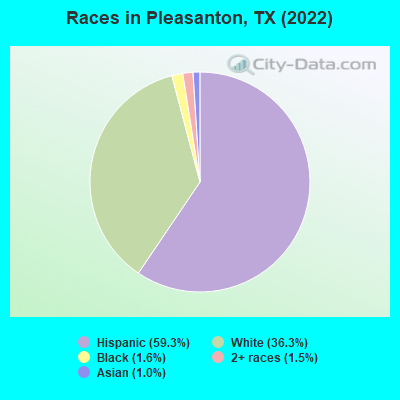
Races in Pleasanton detailed stats: ancestries, foreign born residents, place of birth
According to our research of Texas and other state lists, there were 44 registered sex offenders living in Pleasanton, Texas as of April 26, 2024.
The ratio of all residents to sex offenders in Pleasanton is 238 to 1.
Type |
2009 |
2010 |
2011 |
2012 |
2013 |
2014 |
2015 |
2016 |
2017 |
2018 |
2019 |
2020 |
2021 |
2022 |
|---|---|---|---|---|---|---|---|---|---|---|---|---|---|---|
| Murders (per 100,000) | 1 (10.2) | 0 (0.0) | 0 (0.0) | 0 (0.0) | 0 (0.0) | 2 (20.7) | 1 (10.2) | 2 (20.0) | 0 (0.0) | 0 (0.0) | 0 (0.0) | 1 (9.1) | 0 (0.0) | 0 (0.0) |
| Rapes (per 100,000) | 15 (152.4) | 9 (100.7) | 5 (54.8) | 3 (32.6) | 1 (10.6) | 2 (20.7) | 5 (50.9) | 5 (49.9) | 13 (123.1) | 9 (84.7) | 8 (73.3) | 3 (27.3) | 3 (26.9) | 5 (45.7) |
| Robberies (per 100,000) | 3 (30.5) | 2 (22.4) | 1 (11.0) | 2 (21.7) | 3 (31.9) | 3 (31.1) | 3 (30.6) | 8 (79.9) | 5 (47.3) | 1 (9.4) | 8 (73.3) | 5 (45.4) | 2 (17.9) | 2 (18.3) |
| Assaults (per 100,000) | 23 (233.6) | 26 (291.0) | 25 (274.1) | 17 (184.7) | 31 (330.0) | 28 (289.9) | 17 (173.1) | 19 (189.8) | 21 (198.8) | 20 (188.2) | 20 (183.3) | 19 (172.6) | 23 (206.1) | 13 (118.7) |
| Burglaries (per 100,000) | 85 (863.5) | 84 (940.2) | 83 (909.9) | 108 (1,173) | 80 (851.6) | 87 (900.8) | 100 (1,018) | 97 (968.7) | 71 (672.2) | 70 (658.7) | 31 (284.1) | 34 (308.9) | 33 (295.7) | 27 (246.6) |
| Thefts (per 100,000) | 268 (2,722) | 305 (3,414) | 312 (3,420) | 393 (4,269) | 430 (4,577) | 440 (4,556) | 501 (5,102) | 378 (3,775) | 311 (2,944) | 315 (2,964) | 240 (2,200) | 183 (1,663) | 177 (1,586) | 205 (1,872) |
| Auto thefts (per 100,000) | 20 (203.2) | 25 (279.8) | 22 (241.2) | 27 (293.3) | 33 (351.3) | 35 (362.4) | 33 (336.1) | 24 (239.7) | 29 (274.5) | 21 (197.6) | 20 (183.3) | 15 (136.3) | 34 (304.7) | 23 (210.0) |
| Arson (per 100,000) | 1 (10.2) | 1 (11.2) | 1 (11.0) | 1 (10.9) | 0 (0.0) | 1 (10.4) | 0 (0.0) | 0 (0.0) | 0 (0.0) | 0 (0.0) | 0 (0.0) | 0 (0.0) | 1 (9.0) | 0 (0.0) |
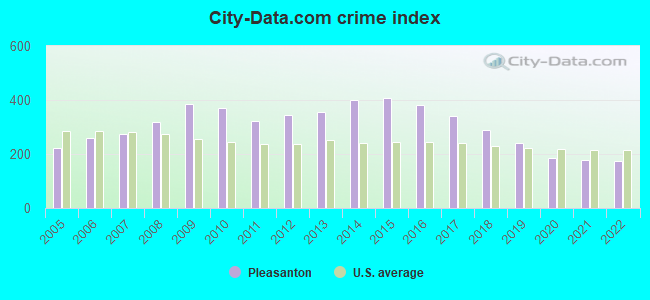
| City-Data.com crime index | 383.7 | 370.3 | 321.7 | 345.9 | 354.9 | 399.6 | 407.2 | 379.8 | 339.2 | 288.7 | 239.8 | 187.2 | 176.6 | 174.7 |
The City-Data.com crime index weighs serious crimes and violent crimes more heavily. Higher means more crime, U.S. average is 246.1. It adjusts for the number of visitors and daily workers commuting into cities.
Crime rate in Pleasanton detailed stats: murders, rapes, robberies, assaults, burglaries, thefts, arson
Full-time law enforcement employees in 2021, including police officers: 26 (22 officers - 19 male; 3 female).
| Officers per 1,000 residents here: | 1.97 |
| Texas average: | 2.07 |
 Recent articles from our blog. Our writers, many of them Ph.D. graduates or candidates, create easy-to-read articles on a wide variety of topics.

 | Pleasanton, Texas (6 replies) |
| Rural/country area, 20 mins to everyday retail, 80 mins to airport, no work commute (42 replies) |
| The not so fast food, fast food thread. (55 replies) |
| Help us find an area to live please (16 replies) |
| Oracle moving HQ to Austin (38 replies) |
| Jourdanton/Pleasanton apartments? (2 replies) |
Latest news from Pleasanton, TX collected exclusively by city-data.com from local newspapers, TV, and radio stations
Ancestries: German (8.1%), English (5.4%), Irish (4.7%), American (3.8%), Polish (1.4%).
Current Local Time: CST time zone
Land area: 6.39 square miles.
Population density: 1,722 people per square mile (low).
704 residents are foreign born (5.5% Latin America, 0.7% Asia).
| This city: | 6.4% |
| Texas: | 17.1% |
Median real estate property taxes paid for housing units with mortgages in 2022: $3,751 (1.7%)
Median real estate property taxes paid for housing units with no mortgage in 2022: $2,635 (1.4%)
Nearest city with pop. 50,000+: San Antonio, TX  (33.6 miles , pop. 1,144,646).
Nearest cities:
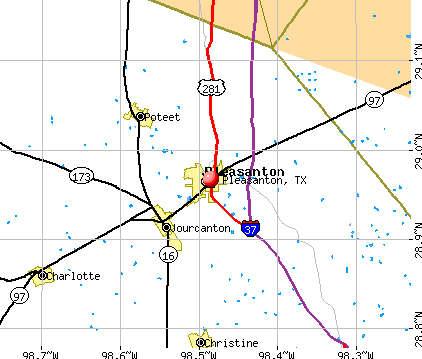
), ), ), ), )Latitude: 28.97 N, Longitude: 98.48 W
Daytime population change due to commuting: +1,233 (+11.2%)
Workers who live and work in this city: 2,128 (47.7%)
Area code: 830

Pleasanton, Texas accommodation & food services, waste management - Economy and Business Data
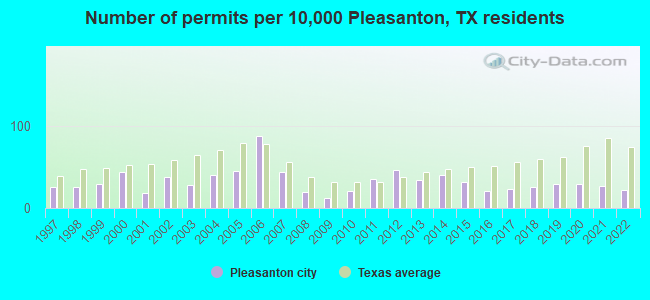
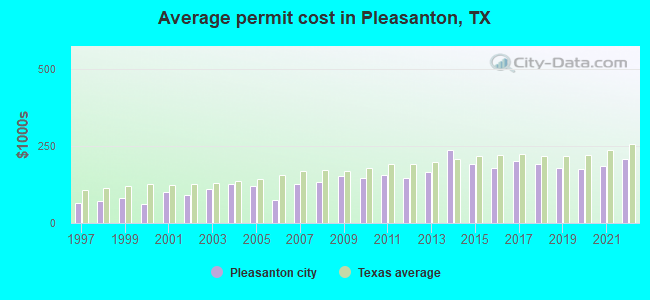
Single-family new house construction building permits:
- 2022: 18 buildings, average cost: $207,900
- 2021: 22 buildings, average cost: $187,300
- 2020: 24 buildings, average cost: $176,200
- 2019: 24 buildings, average cost: $180,000
- 2018: 21 buildings, average cost: $190,900
- 2017: 19 buildings, average cost: $201,300
- 2016: 17 buildings, average cost: $177,600
- 2015: 26 buildings, average cost: $192,700
- 2014: 33 buildings, average cost: $236,900
- 2013: 28 buildings, average cost: $165,600
- 2012: 38 buildings, average cost: $147,900
- 2011: 29 buildings, average cost: $157,400
- 2010: 17 buildings, average cost: $147,400
- 2009: 10 buildings, average cost: $153,100
- 2008: 16 buildings, average cost: $133,400
- 2007: 36 buildings, average cost: $127,600
- 2006: 73 buildings, average cost: $75,600
- 2005: 37 buildings, average cost: $120,500
- 2004: 33 buildings, average cost: $126,800
- 2003: 23 buildings, average cost: $111,800
- 2002: 31 buildings, average cost: $89,600
- 2001: 15 buildings, average cost: $100,500
- 2000: 36 buildings, average cost: $63,200
- 1999: 24 buildings, average cost: $81,300
- 1998: 21 buildings, average cost: $71,400
- 1997: 21 buildings, average cost: $65,800
| Here: | 3.4% |
| Texas: | 3.5% |
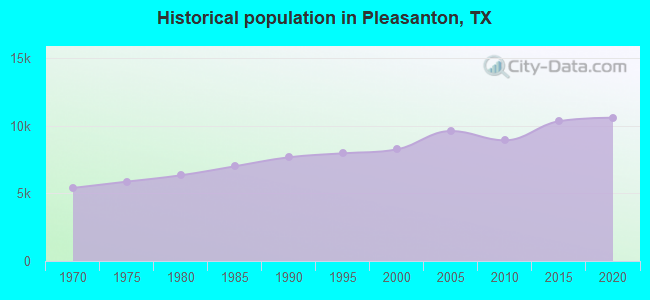
Population change in the 1990s: +249 (+3.1%).
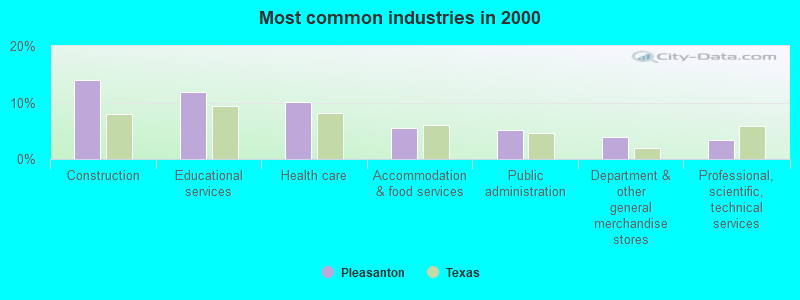
- Construction (13.9%)
- Educational services (11.8%)
- Health care (10.0%)
- Accommodation & food services (5.6%)
- Public administration (5.2%)
- Department & other general merchandise stores (3.9%)
- Professional, scientific, technical services (3.3%)
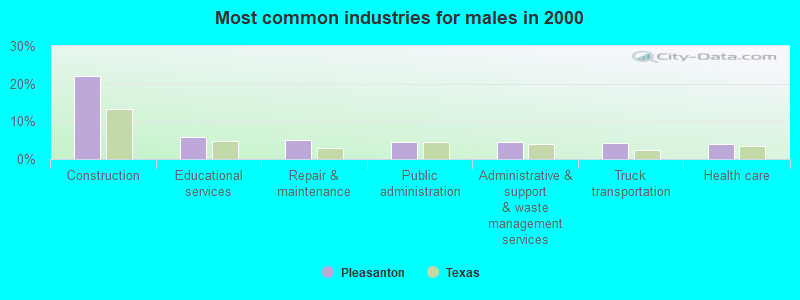
- Construction (22.0%)
- Educational services (6.0%)
- Repair & maintenance (5.0%)
- Public administration (4.6%)
- Administrative & support & waste management services (4.4%)
- Truck transportation (4.3%)
- Health care (3.9%)
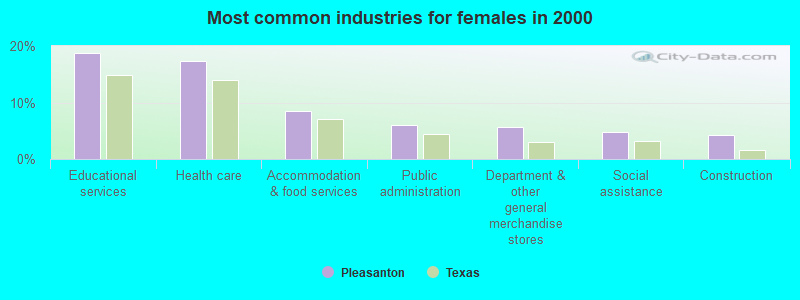
- Educational services (18.8%)
- Health care (17.4%)
- Accommodation & food services (8.4%)
- Public administration (6.0%)
- Department & other general merchandise stores (5.8%)
- Social assistance (4.8%)
- Construction (4.2%)
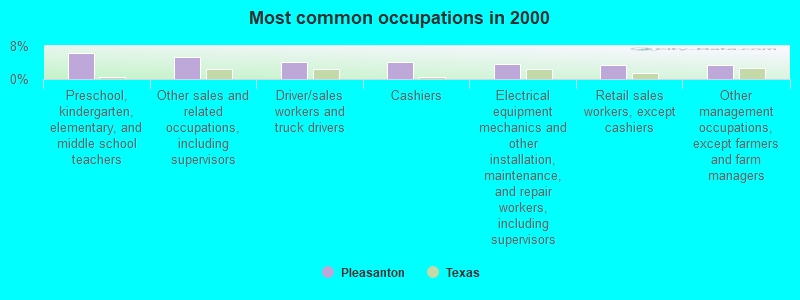
- Preschool, kindergarten, elementary, and middle school teachers (6.3%)
- Other sales and related occupations, including supervisors (5.3%)
- Driver/sales workers and truck drivers (4.2%)
- Cashiers (4.0%)
- Electrical equipment mechanics and other installation, maintenance, and repair workers, including supervisors (3.6%)
- Retail sales workers, except cashiers (3.4%)
- Other management occupations, except farmers and farm managers (3.4%)
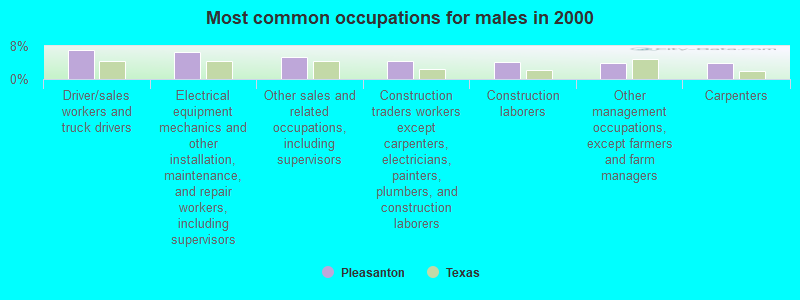
- Driver/sales workers and truck drivers (7.1%)
- Electrical equipment mechanics and other installation, maintenance, and repair workers, including supervisors (6.5%)
- Other sales and related occupations, including supervisors (5.3%)
- Construction traders workers except carpenters, electricians, painters, plumbers, and construction laborers (4.3%)
- Construction laborers (4.2%)
- Other management occupations, except farmers and farm managers (4.0%)
- Carpenters (3.9%)
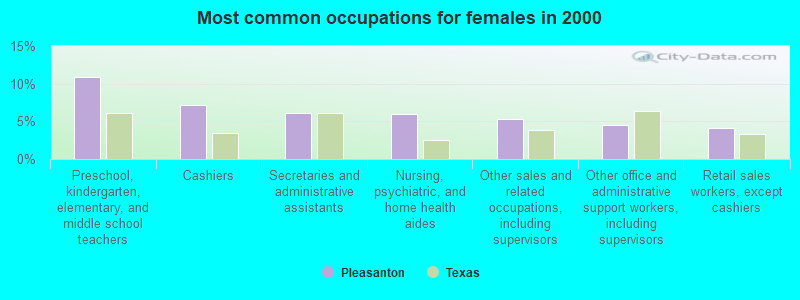
- Preschool, kindergarten, elementary, and middle school teachers (10.8%)
- Cashiers (7.1%)
- Secretaries and administrative assistants (6.1%)
- Nursing, psychiatric, and home health aides (5.9%)
- Other sales and related occupations, including supervisors (5.4%)
- Other office and administrative support workers, including supervisors (4.6%)
- Retail sales workers, except cashiers (4.1%)
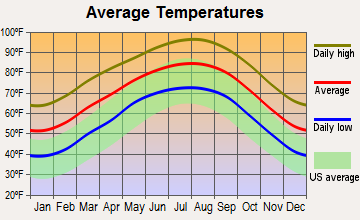
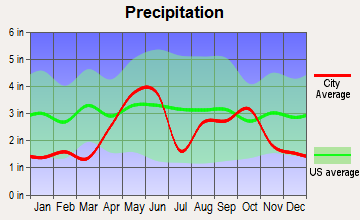
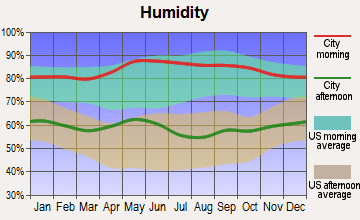
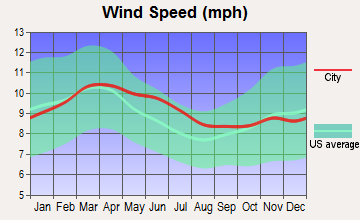
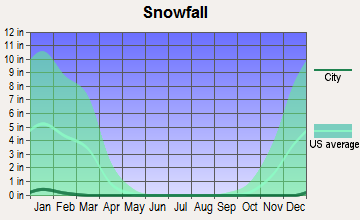
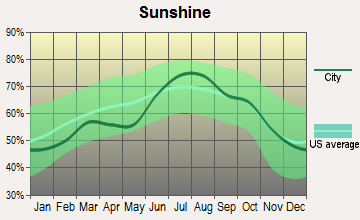
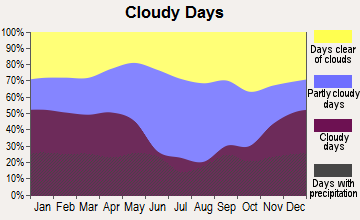
Average climate in Pleasanton, Texas
Based on data reported by over 4,000 weather stations
|
|

(lower is better)
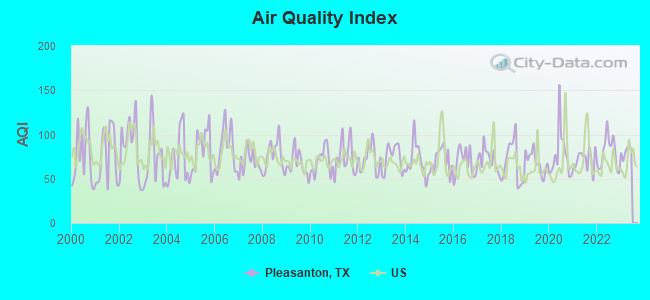
Air Quality Index (AQI) level in 2022 was 79.3. This is about average.
| City: | 79.3 |
| U.S.: | 72.6 |
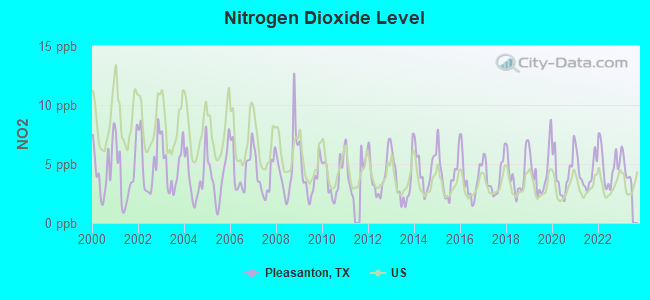
Nitrogen Dioxide (NO2) [ppb] level in 2022 was 4.83. This is about average. Closest monitor was 23.8 miles away from the city center.
| City: | 4.83 |
| U.S.: | 5.11 |
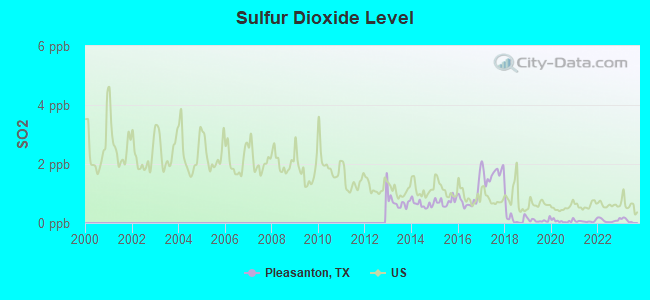
Sulfur Dioxide (SO2) [ppb] level in 2022 was 0.0888. This is significantly better than average. Closest monitor was 23.8 miles away from the city center.
| City: | 0.0888 |
| U.S.: | 1.5147 |
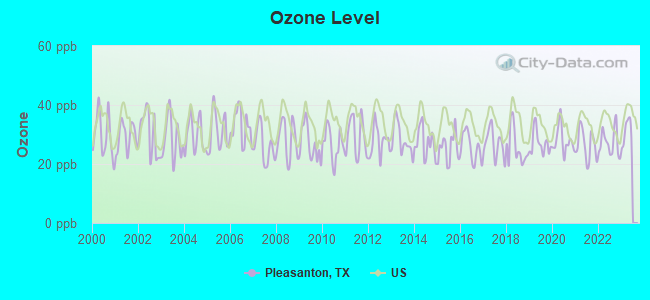
Ozone [ppb] level in 2022 was 27.2. This is better than average. Closest monitor was 23.8 miles away from the city center.
| City: | 27.2 |
| U.S.: | 33.3 |
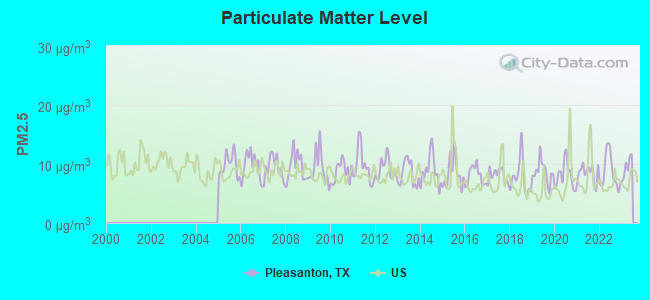
Particulate Matter (PM2.5) [µg/m3] level in 2022 was 8.60. This is about average. Closest monitor was 15.0 miles away from the city center.
| City: | 8.60 |
| U.S.: | 8.11 |
Tornado activity:
Pleasanton-area historical tornado activity is below Texas state average. It is 23% smaller than the overall U.S. average.
On 4/15/1973, a category F4 (max. wind speeds 207-260 mph) tornado 23.2 miles away from the Pleasanton city center killed 5 people and injured 12 people.
On 4/28/1953, a category F4 tornado 43.7 miles away from the city center killed 2 people and injured 15 people.
Earthquake activity:
Pleasanton-area historical earthquake activity is significantly above Texas state average. It is 31% smaller than the overall U.S. average.On 10/20/2011 at 12:24:41, a magnitude 4.8 (4.8 MW, Depth: 3.1 mi, Class: Light, Intensity: IV - V) earthquake occurred 25.6 miles away from the city center
On 4/9/1993 at 12:29:19, a magnitude 4.3 (4.1 MB, 4.3 LG, Depth: 3.1 mi) earthquake occurred 24.4 miles away from the city center
On 4/14/1995 at 00:32:56, a magnitude 5.7 (5.6 MB, 5.7 MS, 5.7 MW, Depth: 11.1 mi, Class: Moderate, Intensity: VI - VII) earthquake occurred 307.2 miles away from the city center
On 5/1/2018 at 16:28:56, a magnitude 4.0 (4.0 MW, Depth: 3.1 mi) earthquake occurred 29.3 miles away from Pleasanton center
On 4/7/2008 at 09:51:12, a magnitude 3.9 (3.9 MW, Depth: 3.1 mi, Class: Light, Intensity: II - III) earthquake occurred 27.4 miles away from Pleasanton center
On 6/16/1978 at 11:46:54, a magnitude 5.3 (4.4 MB, 4.6 UK, 5.3 ML) earthquake occurred 311.9 miles away from the city center
Magnitude types: regional Lg-wave magnitude (LG), body-wave magnitude (MB), local magnitude (ML), surface-wave magnitude (MS), moment magnitude (MW)
Natural disasters:
The number of natural disasters in Atascosa County (14) is near the US average (15).Major Disasters (Presidential) Declared: 8
Emergencies Declared: 5
Causes of natural disasters: Hurricanes: 5, Storms: 5, Floods: 4, Tornadoes: 4, Fires: 2, Tropical Storm: 1, Wind: 1, Other: 1 (Note: some incidents may be assigned to more than one category).

Hospitals and medical centers in Pleasanton:
- RETAMA MANOR NORTH (404 GOODWIN ST)
- RETAMA MANOR NURSING CENTER/PLEASANTON NORTH (404 GOODWIN ST)
- RETAMA MANOR NURSING CENTER/PLEASANTON SOUTH (905 OAKLAWN)
- RETAMA MANOR NURSING CTR SOUTH (905 W OAKLAWN)
- THE HEIGHTS (1855 W GOODWIN)
- USRC ATASCOSA COUNTY DIALYSIS (1320 WEST OAKLAWN SUITE G & H)
- SOUTH TEXAS HOME HEALTH (121 SOUTH SMITH STREET)
Airports located in Pleasanton:
- Pleasanton Municipal Airport (PEZ) (Runways: 1, Air Taxi Ops: 200, Itinerant Ops: 2,700, Local Ops: 8,100, Military Ops: 1,080)
Colleges/universities with over 2000 students nearest to Pleasanton:
- Palo Alto College (about 25 miles; San Antonio, TX; Full-time enrollment: 5,055)
- St Philip's College (about 32 miles; San Antonio, TX; FT enrollment: 5,970)
- Our Lady of the Lake University (about 32 miles; San Antonio, TX; FT enrollment: 2,133)
- San Antonio College (about 34 miles; San Antonio, TX; FT enrollment: 15,182)
- Trinity University (about 35 miles; San Antonio, TX; FT enrollment: 2,467)
- University of the Incarnate Word (about 35 miles; San Antonio, TX; FT enrollment: 6,875)
- Northwest Vista College (about 38 miles; San Antonio, TX; FT enrollment: 9,683)
Public high schools in Pleasanton:
- PLEASANTON H S (Students: 518, Location: 1100 W ADAMS ST, Grades: 9-12)
- PLEASANTON ISD SCHOOL OF CHOICE (Students: 5, Location: 1411 BENSDALE RD, Grades: 10-12)
Public elementary/middle schools in Pleasanton:
- PLEASANTON J H (Students: 935, Location: 1140 JOLLY ST, Grades: 7-8)
- PLEASANTON PRI (Students: 755, Location: 1209 DOWNEY DR, Grades: PK-1)
- PLEASANTON EL (Students: 536, Location: 616 N MAIN ST, Grades: 2-4)
- PLEASANTON INT (Students: 508, Location: 1208 JOLLY ST, Grades: 5-6)
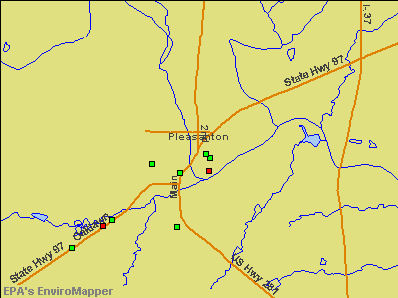
Points of interest:
Notable locations in Pleasanton: Pleasanton Fire Department (A), Texas Regional Emergency Medical Services (B), Quality Ambulance Service (C), Atascosa County Emergency Medical Services (D). Display/hide their locations on the map
Churches in Pleasanton include: Saint Andrew Catholic Church (A), Primera Iglesia Bautista Church (B), Community Bible Chapel Church (C), Atascosa First Seventh Day Adventist Church (D), First Presbyterian Church (E), The Church of Jesus Christ of Latter Day Saints (F), Church of Christ (G). Display/hide their locations on the map
Cemetery: San Ysidro Cemetery (1). Display/hide its location on the map
Creek: Bonita Creek (A). Display/hide its location on the map
Parks in Pleasanton include: Lyons Park (1), City Park (2), Atascosa City Park (3), Atascosa River Park (4). Display/hide their locations on the map
Tourist attractions: Eagle Lanes (507 North Bryant Street), Chamber of Commerce (605 2nd Street).
Court: Pleasanton City - Municipal Court (412 Commerce Street).
| This city: | 2.7 people |
| Texas: | 2.8 people |
| This city: | 70.7% |
| Whole state: | 69.9% |
| This city: | 7.2% |
| Whole state: | 6.0% |
Likely homosexual households (counted as self-reported same-sex unmarried-partner households)
- Lesbian couples: 0.5% of all households
- Gay men: 0.1% of all households
102 people in nursing homes in 2000
16 people in other group homes in 2000
Banks with branches in Pleasanton (2011 data):
- Texas Champion Bank: Pleasanton Branch at 405 West Oaklawn, branch established on 1993/07/19. Info updated 2006/11/03: Bank assets: $344.7 mil, Deposits: $288.3 mil, headquarters in Alice, TX, positive income, Commercial Lending Specialization, 13 total offices, Holding Company: Mesquite Financial Services, Inc.
- Prosperity Bank: Pleasanton Branch at 1112 West Oaklawn, branch established on 1921/01/01. Info updated 2012/01/05: Bank assets: $9,816.2 mil, Deposits: $8,064.8 mil, headquarters in El Campo, TX, positive income, Mortgage Lending Specialization, 187 total offices, Holding Company: Prosperity Bancshares, Inc.
- First National Bank Texas: Pleasanton Banking Center - Rc 636 at 2151 West Oaklawn, branch established on 1999/10/27. Info updated 2006/11/03: Bank assets: $944.3 mil, Deposits: $815.9 mil, headquarters in Killeen, TX, positive income, Mortgage Lending Specialization, 250 total offices, Holding Company: First Community Bancshares, Inc.
- Wells Fargo Bank, National Association: Pleasanton Branch at 425 West Oaklawn Road, branch established on 1932/01/01. Info updated 2011/04/05: Bank assets: $1,161,490.0 mil, Deposits: $905,653.0 mil, headquarters in Sioux Falls, SD, positive income, 6395 total offices, Holding Company: Wells Fargo & Company
- Atascosa National Bank: at 1525 West Oaklawn, branch established on 1982/09/07. Info updated 2006/11/03: Bank assets: $75.6 mil, Deposits: $68.6 mil, local headquarters, positive income, 2 total offices
- Security State Bank: West Oaklawn Branch at 1194 West Oaklawn, branch established on 2007/07/25. Info updated 2010/06/18: Bank assets: $393.6 mil, Deposits: $305.4 mil, headquarters in Pearsall, TX, positive income, Agricultural Specialization, 5 total offices, Holding Company: Briscoe Ranch, Inc.
For population 15 years and over in Pleasanton:
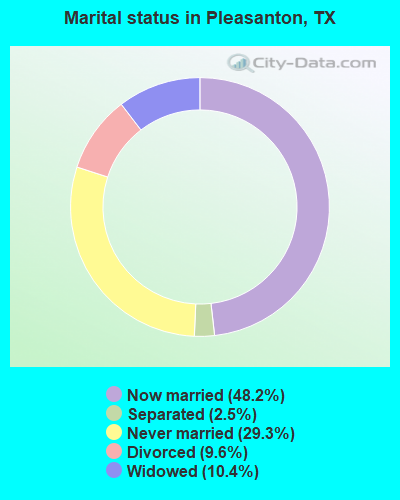
- Never married: 29.3%
- Now married: 48.2%
- Separated: 2.5%
- Widowed: 10.4%
- Divorced: 9.6%
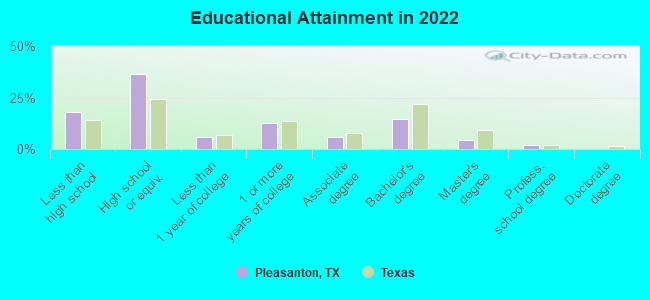
For population 25 years and over in Pleasanton:
- High school or higher: 81.1%
- Bachelor's degree or higher: 19.9%
- Graduate or professional degree: 6.0%
- Unemployed: 5.8%
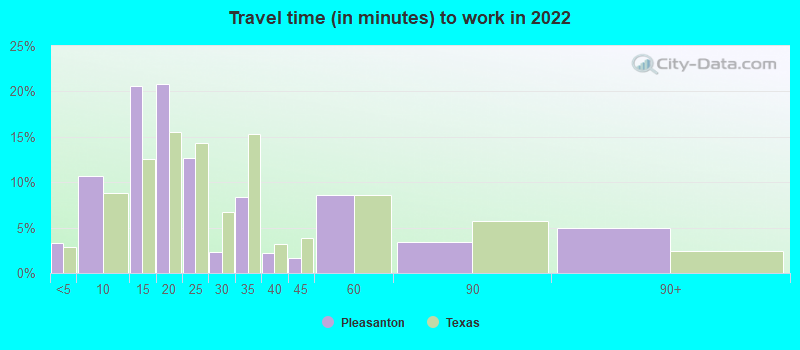
- Mean travel time to work (commute): 24.9 minutes
| Here: | 14.8 |
| Texas average: | 14.0 |
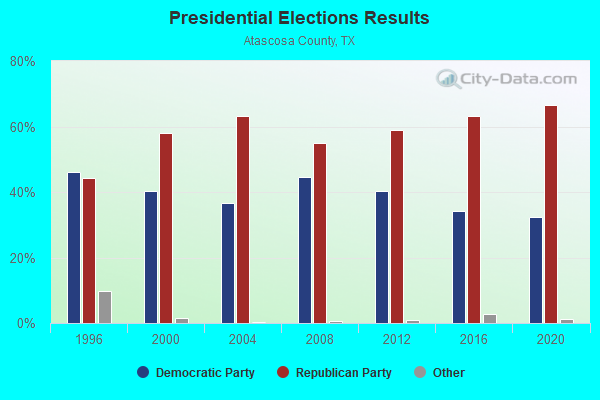
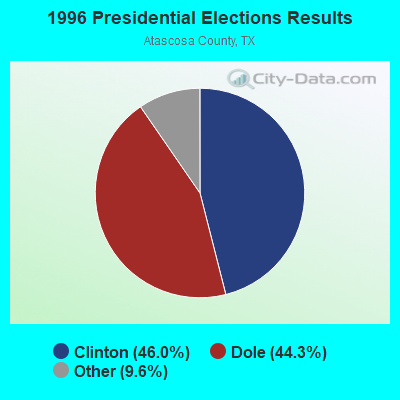
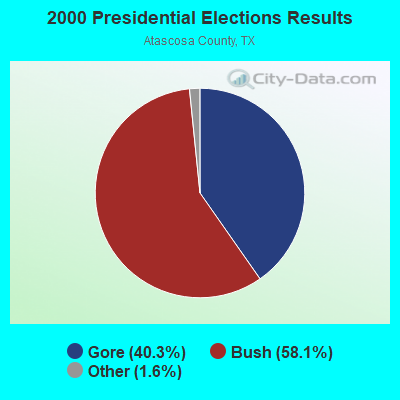
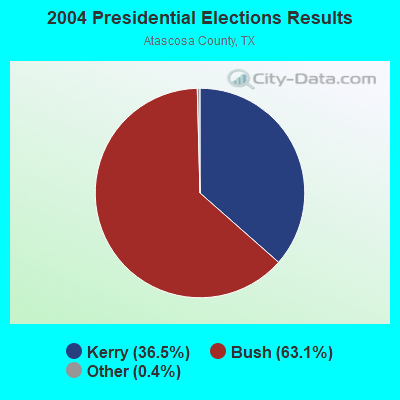
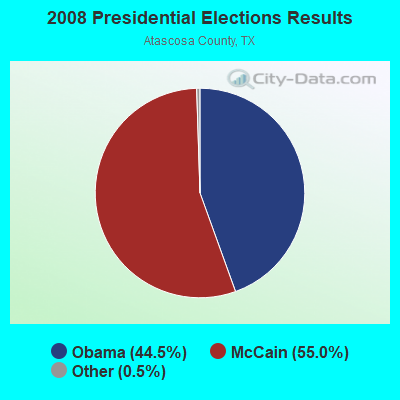
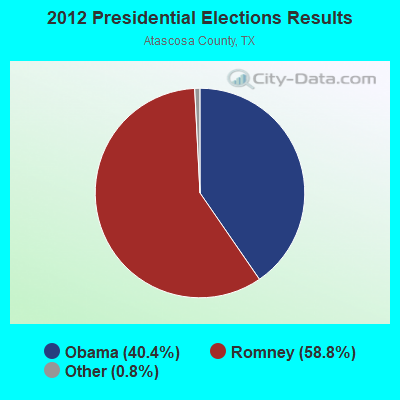
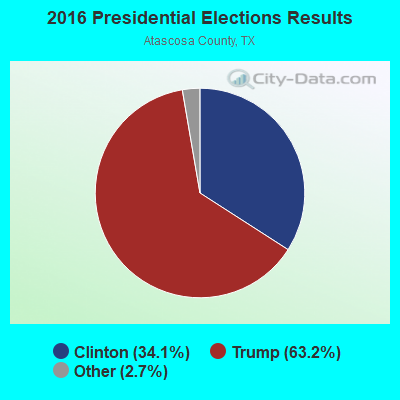
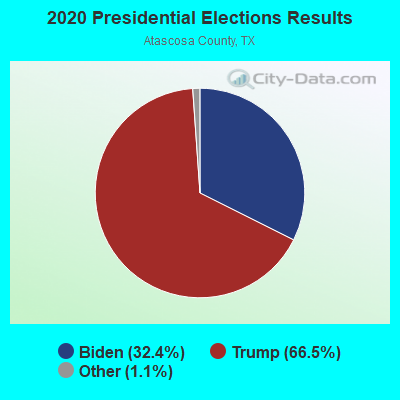
Graphs represent county-level data. Detailed 2008 Election Results
Religion statistics for Pleasanton, TX (based on Atascosa County data)
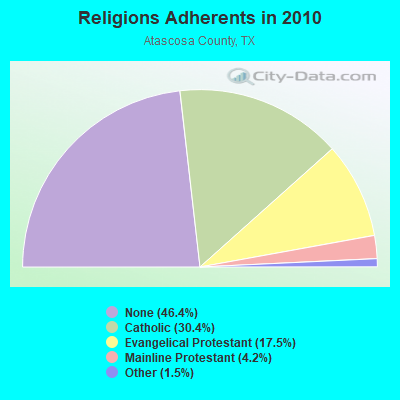
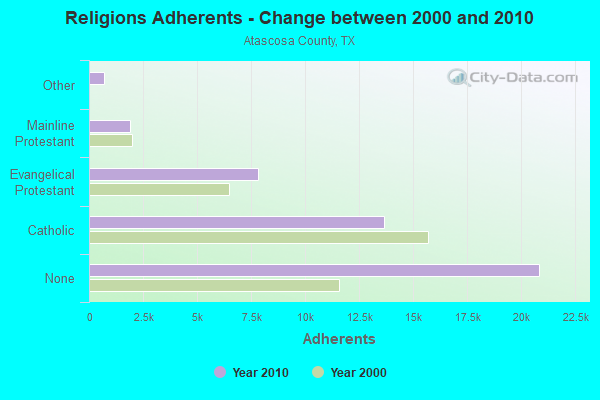
| Religion | Adherents | Congregations |
|---|---|---|
| Catholic | 13,637 | 10 |
| Evangelical Protestant | 7,844 | 49 |
| Mainline Protestant | 1,888 | 9 |
| Other | 694 | 4 |
| None | 20,848 | - |
Food Environment Statistics:
| Atascosa County: | 1.15 / 10,000 pop. |
| Texas: | 1.47 / 10,000 pop. |
| This county: | 0.23 / 10,000 pop. |
| Texas: | 0.14 / 10,000 pop. |
| Atascosa County: | 2.07 / 10,000 pop. |
| State: | 1.11 / 10,000 pop. |
| Here: | 4.37 / 10,000 pop. |
| Texas: | 3.95 / 10,000 pop. |
| This county: | 6.21 / 10,000 pop. |
| Texas: | 6.13 / 10,000 pop. |
| Atascosa County: | 8.9% |
| Texas: | 8.9% |
| Atascosa County: | 26.6% |
| Texas: | 26.6% |
| This county: | 15.0% |
| State: | 15.7% |
Health and Nutrition:
| This city: | 48.9% |
| State: | 48.6% |
| Pleasanton: | 47.5% |
| State: | 47.4% |
| This city: | 28.8 |
| State: | 28.5 |
| Pleasanton: | 20.7% |
| Texas: | 20.6% |
| This city: | 12.0% |
| Texas: | 10.3% |
| This city: | 6.9 |
| Texas: | 6.8 |
| Pleasanton: | 35.1% |
| Texas: | 33.1% |
| Pleasanton: | 55.0% |
| Texas: | 56.2% |
| Pleasanton: | 79.7% |
| Texas: | 80.7% |
More about Health and Nutrition of Pleasanton, TX Residents
| Local government employment and payroll (March 2022) | |||||
| Function | Full-time employees | Monthly full-time payroll | Average yearly full-time wage | Part-time employees | Monthly part-time payroll |
|---|---|---|---|---|---|
| Police Protection - Officers | 26 | $139,342 | $64,312 | 0 | $0 |
| Sewerage | 13 | $58,002 | $53,540 | 0 | $0 |
| Water Supply | 12 | $51,128 | $51,128 | 0 | $0 |
| Streets and Highways | 12 | $40,077 | $40,077 | 0 | $0 |
| Financial Administration | 9 | $45,959 | $61,279 | 0 | $0 |
| Parks and Recreation | 9 | $29,711 | $39,615 | 0 | $0 |
| Other Government Administration | 7 | $48,934 | $83,887 | 0 | $0 |
| Firefighters | 6 | $34,848 | $69,696 | 0 | $0 |
| Local Libraries | 4 | $13,679 | $41,037 | 0 | $0 |
| Other and Unallocable | 2 | $5,270 | $31,620 | 0 | $0 |
| Totals for Government | 100 | $466,950 | $56,034 | 0 | $0 |
Pleasanton government finances - Expenditure in 2017 (per resident):
- Current Operations - Sewerage: $4,838,000 ($439.66)
Financial Administration: $3,028,000 ($275.17)
Police Protection: $2,373,000 ($215.65)
General - Other: $1,685,000 ($153.13)
Water Utilities: $1,446,000 ($131.41)
Parks and Recreation: $644,000 ($58.52)
Local Fire Protection: $378,000 ($34.35)
Libraries: $356,000 ($32.35)
General Public Buildings: $290,000 ($26.35)
Judicial and Legal Services: $237,000 ($21.54)
Air Transportation: $131,000 ($11.90)
Central Staff Services: $49,000 ($4.45)
- General - Interest on Debt: $52,000 ($4.73)
- Other Capital Outlay - Water Utilities: $491,000 ($44.62)
Police Protection: $267,000 ($24.26)
Local Fire Protection: $236,000 ($21.45)
Sewerage: $12,000 ($1.09)
Parks and Recreation: $8,000 ($0.73)
Pleasanton government finances - Revenue in 2017 (per resident):
- Charges - Solid Waste Management: $1,623,000 ($147.49)
Parks and Recreation: $44,000 ($4.00)
Other: $1,000 ($0.09)
- Miscellaneous - Fines and Forfeits: $188,000 ($17.08)
Sale of Property: $19,000 ($1.73)
Interest Earnings: $12,000 ($1.09)
Donations From Private Sources: $6,000 ($0.55)
General Revenue - Other: $2,000 ($0.18)
- Revenue - Water Utilities: $4,781,000 ($434.48)
- State Intergovernmental - General Local Government Support: $23,000 ($2.09)
Other: $12,000 ($1.09)
- Tax - General Sales and Gross Receipts: $4,165,000 ($378.50)
Property: $1,719,000 ($156.22)
Other Selective Sales: $393,000 ($35.71)
Occupation and Business License - Other: $77,000 ($7.00)
Other License: $54,000 ($4.91)
Alcoholic Beverage License: $4,000 ($0.36)
Pleasanton government finances - Debt in 2017 (per resident):
- Long Term Debt - Beginning Outstanding - Unspecified Public Purpose: $1,309,000 ($118.96)
Outstanding Unspecified Public Purpose: $929,000 ($84.42)
Retired Unspecified Public Purpose: $379,000 ($34.44)
Pleasanton government finances - Cash and Securities in 2017 (per resident):
- Other Funds - Cash and Securities: $26,618,000 ($2418.94)
| Businesses in Pleasanton, TX | ||||
| Name | Count | Name | Count | |
|---|---|---|---|---|
| AT&T | 1 | La-Z-Boy | 1 | |
| AutoZone | 1 | McDonald's | 2 | |
| Blockbuster | 1 | Nike | 1 | |
| Burger King | 1 | Payless | 1 | |
| Chevrolet | 1 | Pizza Hut | 1 | |
| Church's Chicken | 1 | RadioShack | 1 | |
| Cricket Wireless | 2 | SONIC Drive-In | 1 | |
| Curves | 1 | Sears | 1 | |
| Dairy Queen | 2 | Super 8 | 1 | |
| Domino's Pizza | 1 | U-Haul | 1 | |
| FedEx | 1 | UPS | 3 | |
| Ford | 1 | Walgreens | 1 | |
| H&R Block | 1 | Walmart | 1 | |
Strongest AM radio stations in Pleasanton:
- KFNI (1380 AM; 4 kW; PLEASANTON, TX; Owner: WAY BROADCASTING, INC.)
- KTKR (760 AM; 50 kW; SAN ANTONIO, TX; Owner: CCB TEXAS LICENSES, L.P.)
- KKYX (680 AM; 50 kW; SAN ANTONIO, TX; Owner: CXR HOLDINGS, INC.)
- WOAI (1200 AM; 50 kW; SAN ANTONIO, TX; Owner: CCB TEXAS LICENSES, L.P.)
- KENS (1160 AM; 25 kW; SAN ANTONIO, TX; Owner: KENS-TV, INC.)
- KSLR (630 AM; 5 kW; SAN ANTONIO, TX; Owner: SALEM MEDIA OF TEXAS, INC.)
- KSAH (720 AM; 10 kW; UNIVERSAL CITY, TX; Owner: KSAH LICENSING, INC.)
- KTSA (550 AM; 5 kW; SAN ANTONIO, TX; Owner: INFINITY BROADCASTING CORPORATION OF SAN ANTONIO)
- KDRY (1100 AM; 11 kW; ALAMO HEIGHTS, TX; Owner: KDRY RADIO, INC.)
- KONO (860 AM; 5 kW; SAN ANTONIO, TX; Owner: CXR HOLDINGS, INC.)
- KCTA (1030 AM; 50 kW; CORPUS CHRISTI, TX; Owner: BROADCASTING CORPORATION OF THE SOUTHWEST)
- KEDA (1540 AM; 5 kW; SAN ANTONIO, TX; Owner: D & E BROADCASTING CO., INC.)
- KXTN (1310 AM; 5 kW; SAN ANTONIO, TX)
Strongest FM radio stations in Pleasanton:
- K220GL (91.9 FM; PLEASANTON, TX; Owner: CALVARY CHAPEL OF TWIN FALLS, INC.)
- KBBT (98.5 FM; SCHERTZ, TX; Owner: HBC LICENSE CORPORATION)
- KBUC (95.7 FM; JOURDANTON, TX; Owner: REDING ENTERPRISES, LTD.)
- KCJZ (106.7 FM; TERRELL HILLS, TX; Owner: CXR HOLDINGS, INC.)
- KXTN-FM (107.5 FM; SAN ANTONIO, TX; Owner: TICHENOR LICENSE CORPORATION ("TLC"))
- KLEY-FM (94.1 FM; FLORESVILLE, TX; Owner: KLEY LICENSING, INC.)
- KROM (92.9 FM; SAN ANTONIO, TX; Owner: TICHENOR LICENSE CORPORATION ("TLC"))
- KSMG (105.3 FM; SEGUIN, TX; Owner: CXR HOLDINGS, INC.)
- KISS-FM (99.5 FM; SAN ANTONIO, TX; Owner: CXR HOLDINGS, INC.)
- KMFR (104.1 FM; PEARSALL, TX; Owner: RADIO TUNA, LTD.)
- KCYY (100.3 FM; SAN ANTONIO, TX; Owner: CXR HOLDINGS, INC.)
- KONO-FM (101.1 FM; HELOTES, TX; Owner: CXR HOLDINGS, INC.)
- KXXM (96.1 FM; SAN ANTONIO, TX; Owner: CCB TEXAS LICENSES, L.P.)
- KZLV (91.3 FM; LYTLE, TX; Owner: EDUCATIONAL MEDIA FOUNDATION)
- KTFM (102.7 FM; SAN ANTONIO, TX; Owner: INFINITY BROADCASTING CORPORATION OF SAN ANTONIO)
- KQXT-FM (101.9 FM; SAN ANTONIO, TX; Owner: CCB TEXAS LICENSES, L.P.)
- KZEP-FM (104.5 FM; SAN ANTONIO, TX; Owner: TEXAS LOTUS LTD.)
- KLMO-FM (98.9 FM; DILLEY, TX; Owner: DILLEY BROADCASTERS)
TV broadcast stations around Pleasanton:
- KENS-TV (Channel 5; SAN ANTONIO, TX; Owner: KENS-TV, INC.)
- WOAI-TV (Channel 4; SAN ANTONIO, TX; Owner: CCB TEXAS LICENSES, L.P.)
- KABB (Channel 29; SAN ANTONIO, TX; Owner: KABB LICENSEE, LLC)
- KVDA (Channel 60; SAN ANTONIO, TX; Owner: TELEMUNDO OF TEXAS PARTNERSHIP, LP)
- KSAT-TV (Channel 12; SAN ANTONIO, TX; Owner: POST-NEWSWEEK STATIONS, SAN ANTONIO, LP)
- KWEX-TV (Channel 41; SAN ANTONIO, TX; Owner: KWEX LICENSE PARTNERSHIP, L.P.)
- K45DX (Channel 45; FLORESVILLE, TX; Owner: TELEFUTURA PARTNERSHIP OF FLORESVILLE)
- KXTM-LP (Channel 21; SAN ANTONIO, TX; Owner: HUMBERTO LOPEZ)
- KSAA-LP (Channel 28; SAN ANTONIO, TX; Owner: MAKO COMMUNICATIONS, LLC)
- KRRT (Channel 35; KERRVILLE, TX; Owner: SAN ANTONIO (KRRT-TV) LICENSEE, INC.)
- KLRN (Channel 9; SAN ANTONIO, TX; Owner: ALAMO PUBLIC TELECOMMUNICATIONS COUNCIL)
- KHCE (Channel 23; SAN ANTONIO, TX; Owner: SAN ANTONIO COMMUNITY EDUCATIONAL TV, INC.)
- KFTO-CA (Channel 67; SAN ANTONIO, TX; Owner: TELEFUTURA PARTNERSHIP OF SAN ANTONIO)
- KQVE-LP (Channel 46; La VERNIA, TX; Owner: WORD OF GOD FELLOWSHIP, INC.)
- KMHZ-LP (Channel 65; SAN ANTONIO, TX; Owner: LOUIS MARTINEZ FAMILY GROUP, LLC)
- KGMM-CA (Channel 58; SAN ANTONIO, TX; Owner: CABALLERO TELEVISION TEXAS, L.L.C.)
- KNIC-CA (Channel 17; SAN ANTONIO, TX; Owner: TELEFUTURA PARTNERSHIP OF SAN ANTONIO)
- K52EA (Channel 52; SAN ANTONIO, TX; Owner: ORTIZ BROADCASTING CORPORATION)
- National Bridge Inventory (NBI) Statistics
- 26Number of bridges
- 518ft / 158mTotal length
- $1,303,000Total costs
- 287,991Total average daily traffic
- 65,625Total average daily truck traffic
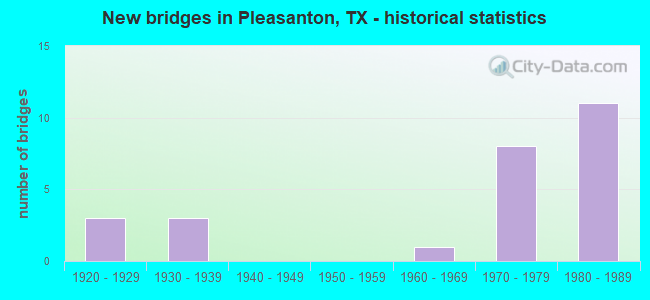
- New bridges - historical statistics
- 31920-1929
- 31930-1939
- 11960-1969
- 81970-1979
- 111980-1989
FCC Registered Antenna Towers: 181 (See the full list of FCC Registered Antenna Towers)
FCC Registered Commercial Land Mobile Towers: 1 (See the full list of FCC Registered Commercial Land Mobile Towers in Pleasanton, TX)
FCC Registered Private Land Mobile Towers: 2 (See the full list of FCC Registered Private Land Mobile Towers)
FCC Registered Broadcast Land Mobile Towers: 22 (See the full list of FCC Registered Broadcast Land Mobile Towers)
FCC Registered Microwave Towers: 58 (See the full list of FCC Registered Microwave Towers in this town)
FCC Registered Paging Towers: 3 (See the full list of FCC Registered Paging Towers)
FCC Registered Maritime Coast & Aviation Ground Towers: 5 (See the full list of FCC Registered Maritime Coast & Aviation Ground Towers)
FCC Registered Amateur Radio Licenses: 59 (See the full list of FCC Registered Amateur Radio Licenses in Pleasanton)
FAA Registered Aircraft: 23 (See the full list of FAA Registered Aircraft in Pleasanton)
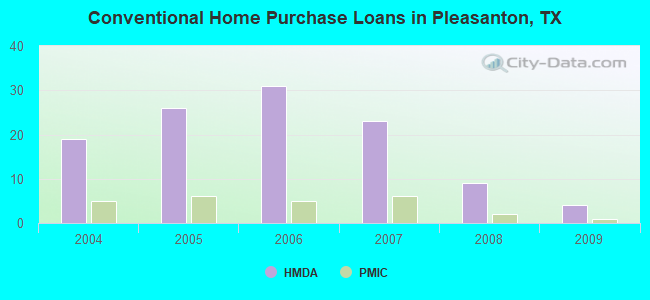
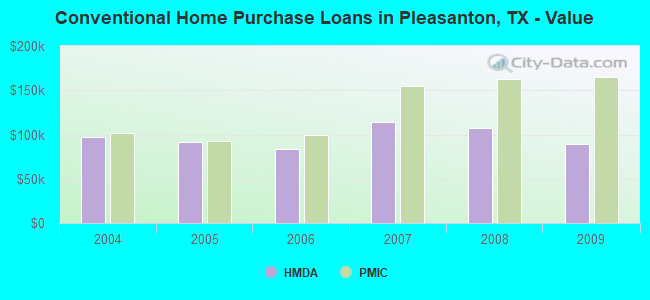
| Home Mortgage Disclosure Act Aggregated Statistics For Year 2009 (Based on 1 partial tract) | ||||||||||||
| A) FHA, FSA/RHS & VA Home Purchase Loans | B) Conventional Home Purchase Loans | C) Refinancings | D) Home Improvement Loans | F) Non-occupant Loans on < 5 Family Dwellings (A B C & D) | G) Loans On Manufactured Home Dwelling (A B C & D) | |||||||
|---|---|---|---|---|---|---|---|---|---|---|---|---|
| Number | Average Value | Number | Average Value | Number | Average Value | Number | Average Value | Number | Average Value | Number | Average Value | |
| LOANS ORIGINATED | 8 | $137,341 | 4 | $88,948 | 14 | $122,899 | 3 | $44,587 | 2 | $46,940 | 1 | $39,880 |
| APPLICATIONS APPROVED, NOT ACCEPTED | 1 | $71,240 | 1 | $67,090 | 2 | $80,070 | 0 | $0 | 0 | $0 | 0 | $0 |
| APPLICATIONS DENIED | 0 | $0 | 1 | $91,390 | 5 | $108,876 | 2 | $34,065 | 0 | $0 | 0 | $0 |
| APPLICATIONS WITHDRAWN | 0 | $0 | 1 | $73,530 | 5 | $110,622 | 0 | $0 | 0 | $0 | 0 | $0 |
| FILES CLOSED FOR INCOMPLETENESS | 0 | $0 | 0 | $0 | 1 | $88,060 | 0 | $0 | 0 | $0 | 0 | $0 |
Detailed HMDA statistics for the following Tracts: 9604.02
| Private Mortgage Insurance Companies Aggregated Statistics For Year 2009 (Based on 1 partial tract) | ||
| A) Conventional Home Purchase Loans | ||
|---|---|---|
| Number | Average Value | |
| LOANS ORIGINATED | 1 | $164,910 |
| APPLICATIONS APPROVED, NOT ACCEPTED | 0 | $0 |
| APPLICATIONS DENIED | 0 | $0 |
| APPLICATIONS WITHDRAWN | 0 | $0 |
| FILES CLOSED FOR INCOMPLETENESS | 0 | $0 |
Detailed PMIC statistics for the following Tracts: 9604.02
2002 - 2018 National Fire Incident Reporting System (NFIRS) incidents
- Fire incident types reported to NFIRS in Pleasanton, TX
- 94365.9%Outside Fires
- 23716.6%Structure Fires
- 20814.5%Mobile Property/Vehicle Fires
- 443.1%Other
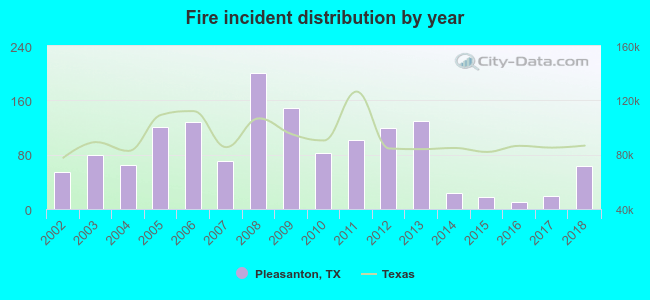 According to the data from the years 2002 - 2018 the average number of fire incidents per year is 84. The highest number of fires - 200 took place in 2008, and the least - 11 in 2016. The data has a rising trend.
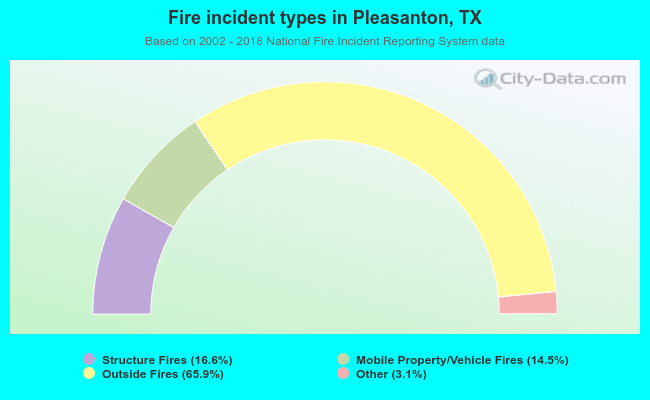 When looking into fire subcategories, the most incidents belonged to: Outside Fires (65.9%), and Structure Fires (16.6%).
Fire-safe hotels and motels in Pleasanton, Texas:
- Hampton Inn by Hilton - Pleasanton, TX, 2057 W Oaklawn, Pleasanton, Texas 78064 , Phone: (830) 569-3001
- Fairfield Inn & Suites Pleasanton, 200 Cowboy Ln, Pleasanton, Texas 78064 , Phone: (830) 569-8656
- Savannah Suites, 910 Palmer Ln, Pleasanton, Texas 78064 , Phone: (830) 569-8500
- Microtel Inn, 1311 Brush Country Ln, Pleasanton, Texas 78064 , Phone: (830) 399-4250
| Most common first names in Pleasanton, TX among deceased individuals | ||
| Name | Count | Lived (average) |
|---|---|---|
| Mary | 71 | 80.5 years |
| William | 56 | 75.7 years |
| James | 55 | 73.6 years |
| John | 50 | 74.5 years |
| Maria | 33 | 75.9 years |
| Robert | 32 | 70.6 years |
| Joe | 29 | 71.7 years |
| Frank | 27 | 75.5 years |
| Jose | 27 | 75.5 years |
| Charles | 24 | 66.8 years |
| Most common last names in Pleasanton, TX among deceased individuals | ||
| Last name | Count | Lived (average) |
|---|---|---|
| Martinez | 33 | 69.2 years |
| Rodriguez | 28 | 71.1 years |
| Garcia | 25 | 73.9 years |
| Gonzales | 24 | 71.8 years |
| Lopez | 21 | 65.6 years |
| Garza | 20 | 77.1 years |
| Arguijo | 19 | 74.5 years |
| Pacheco | 19 | 69.5 years |
| Leal | 18 | 70.6 years |
| Smith | 18 | 74.1 years |
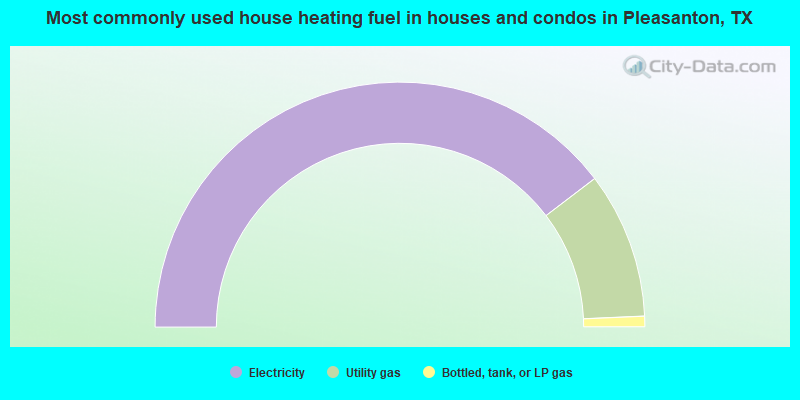
- 79.2%Electricity
- 19.3%Utility gas
- 1.4%Bottled, tank, or LP gas
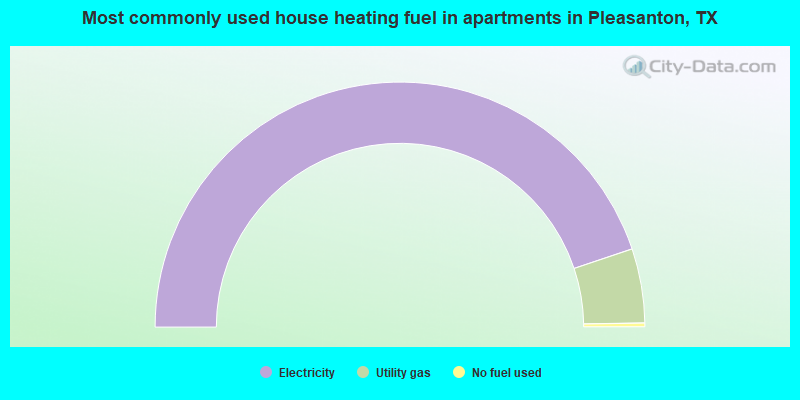
- 89.7%Electricity
- 9.8%Utility gas
- 0.5%No fuel used
Pleasanton compared to Texas state average:
- Unemployed percentage below state average.
- Black race population percentage significantly below state average.
- Hispanic race population percentage above state average.
- Median age above state average.
- Foreign-born population percentage below state average.
- Length of stay since moving in significantly above state average.
Pleasanton on our top lists:
- #73 on the list of "Top 101 cities with largest percentage of females in industries: mining, quarrying, and oil and gas extraction (population 5,000+)"
- #82 on the list of "Top 101 cities with the most residents born in Other Northern Africa (population 500+)"
- #90 on the list of "Top 101 cities with largest percentage of females in occupations: sales and related occupations (population 5,000+)"

|
Total of 4 patent applications in 2008-2024.