South San Francisco, California
Submit your own pictures of this city and show them to the world
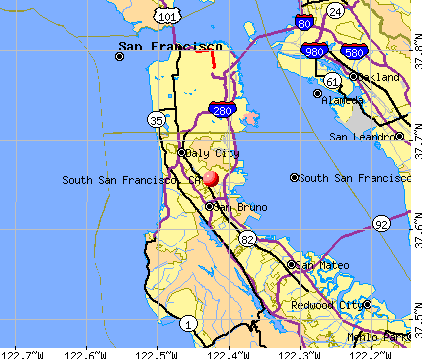
- OSM Map
- General Map
- Google Map
- MSN Map
Population change since 2000: +4.8%
 |
| Males: 31,705 | |
| Females: 31,779 |
| Median resident age: | 43.5 years |
| California median age: | 37.9 years |
Zip codes: 94080.
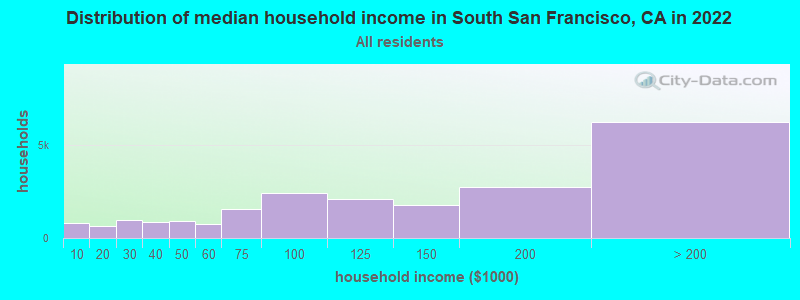
| South San Francisco: | $123,232 |
| CA: | $91,551 |
Estimated per capita income in 2022: $59,808 (it was $23,562 in 2000)
South San Francisco city income, earnings, and wages data
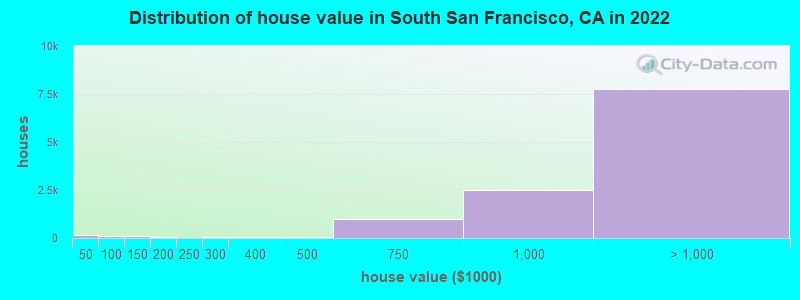
Estimated median house or condo value in 2022: over $1,000,000 (it was $344,300 in 2000)
| South San Francisco: | over $1,000,000 |
| CA: | $715,900 |
Mean prices in 2022: all housing units: over $1,000,000; detached houses: over $1,000,000; townhouses or other attached units: over $1,000,000; in 2-unit structures: over $1,000,000; in 3-to-4-unit structures: $681,863; in 5-or-more-unit structures: $898,573; mobile homes: $221,434; occupied boats, rvs, vans, etc.: $25,359
Median gross rent in 2022: $2,540.
South San Francisco, CA residents, houses, and apartments details
(7.2% for White Non-Hispanic residents, 14.2% for Black residents, 10.9% for Hispanic or Latino residents, 14.2% for Native Hawaiian and other Pacific Islander residents, 11.5% for other race residents, 12.6% for two or more races residents)
Detailed information about poverty and poor residents in South San Francisco, CA


Compare current foreclosures near South San Francisco, CA:
| Photo | Address | Area | Beds / Baths | Price | Details |
|---|---|---|---|---|---|

|
#1
Cymbidium Cir
South San Francisco, CA 94080
|
1,610 sq. feet
|
2 baths 3 beds |
show details | |

|
#2
Shannon Park Ct
South San Francisco, CA 94080
|
2,210 sq. feet
|
3 baths 4 beds |
show details | |

|
#3
Valencia Dr
South San Francisco, CA 94080
|
1,410 sq. feet
|
2 baths 3 beds |
show details | |

|
#4
Stonegate 26
South San Francisco, CA 94080
|
1,080 sq. feet
|
1 baths 2 beds |
show details | |

|
#5
Westview Dr
South San Francisco, CA 94080
|
2,214 sq. feet
|
2 baths 4 beds |
show details | |

|
#6
Newman Dr
South San Francisco, CA 94080
|
1,520 sq. feet
|
2 baths 3 beds |
show details | |

|
#7
Kipling Ave
South San Francisco, CA 94080
|
1,110 sq. feet
|
1 baths 3 beds |
show details | |

|
#8
Olmstead Ct
South San Francisco, CA 94080
|
1,820 sq. feet
|
2 baths 4 beds |
show details | |

|
#9
Alta Mesa Dr
South San Francisco, CA 94080
|
1,020 sq. feet
|
1 baths 3 beds |
show details | |

|
#10
Cottonwood Ave
South San Francisco, CA 94080
|
1,570 sq. feet
|
2 baths 4 beds |
show details |
| Photo | Address | Area | Beds / Baths | Price | Details |
|---|---|---|---|---|---|

|
#11
Northwood Dr
South San Francisco, CA 94080
|
1,330 sq. feet
|
1 baths 3 beds |
show details | |

|
#12
Myrtle Ave
South San Francisco, CA 94080
|
1,000 sq. feet
|
1 baths 3 beds |
show details | |

|
#13
Shoreline Ct Ste 201
South San Francisco, CA 94080
|
- sq. feet
|
- baths - beds |
show details | |

|
#14
Greendale Dr
South San Francisco, CA 94080
|
- sq. feet
|
- baths - beds |
show details | |

|
#15
California Ave
South San Francisco, CA 94080
|
- sq. feet
|
- baths - beds |
show details | |

|
#16
Diamond Ave
South San Francisco, CA 94080
|
- sq. feet
|
- baths - beds |
show details | |

|
#17
Commercial Ave Apt 4
South San Francisco, CA 94080
|
- sq. feet
|
- baths - beds |
show details | |

|
#18
Macarthur Blvd
Oakland, CA 94605
|
1,313 sq. feet
|
3 baths 3 beds |
$599,000
|
show details |

|
#19
Associated Rd # A
South San Francisco, CA 94080
|
- sq. feet
|
- baths - beds |
show details | |

|
#20
Ritchie St
Oakland, CA 94605
|
2,208 sq. feet
|
2 baths 3 beds |
show details |
| Photo | Address | Area | Beds / Baths | Price | Details |
|---|---|---|---|---|---|

|
#21
Balboa St
San Francisco, CA 94118
|
2,410 sq. feet
|
1 baths 3 beds |
show details | |

|
#22
Chestnut St
San Carlos, CA 94070
|
1,390 sq. feet
|
2 baths 3 beds |
show details | |

|
#23
Los Angeles St
Emeryville, CA 94608
|
803 sq. feet
|
1 baths 2 beds |
show details | |

|
#24
1322 94th Ave
Oakland, CA 94603
|
1,280 sq. feet
|
1 baths 2 beds |
show details | |

|
#25
106th Ave
Oakland, CA 94603
|
1,961 sq. feet
|
2 baths 3 beds |
show details | |

|
#26
E 31st St
Oakland, CA 94602
|
688 sq. feet
|
1 baths 2 beds |
show details | |

|
#27
Greenwich St Apt 3
San Francisco, CA 94109
|
998 sq. feet
|
1 baths 1 beds |
show details | |

|
#28
101st Ave
Oakland, CA 94603
|
1,134 sq. feet
|
1 baths 3 beds |
show details | |

|
#29
Weld St
Oakland, CA 94621
|
9,160 sq. feet
|
1 baths 2 beds |
show details | |

|
#30
S Humboldt St
San Mateo, CA 94401
|
1,290 sq. feet
|
2 baths 3 beds |
show details |
| Photo | Address | Area | Beds / Baths | Price | Details |
|---|---|---|---|---|---|

|
#31
Olima St
Sausalito, CA 94965
|
- sq. feet
|
2 baths 4 beds |
show details | |

|
#32
Alameda De Las Pulgas
Redwood City, CA 94061
|
1,250 sq. feet
|
2 baths 3 beds |
show details | |

|
#33
Begonia Dr
San Leandro, CA 94578
|
2,741 sq. feet
|
3 baths 5 beds |
show details | |

|
#34
Mirada Rd
Half Moon Bay, CA 94019
|
2,450 sq. feet
|
4 baths 4 beds |
show details | |

|
#35
83rd Ave
Oakland, CA 94621
|
1,304 sq. feet
|
1 baths 3 beds |
show details | |

|
#36
Cedar Ct
Daly City, CA 94014
|
1,200 sq. feet
|
2 baths 3 beds |
show details | |

|
#37
Madrid St
San Francisco, CA 94112
|
1,018 sq. feet
|
1 baths 4 beds |
show details | |

|
#38
Endicott St
San Leandro, CA 94579
|
1,164 sq. feet
|
1 baths 2 beds |
show details | |

|
#39
Lacey Ave
Oakland, CA 94605
|
- sq. feet
|
1 baths 3 beds |
show details | |

|
#40
Oakdale Ave
Oakland, CA 94605
|
2,020 sq. feet
|
3 baths 3 beds |
show details |
| Photo | Address | Area | Beds / Baths | Price | Details |
|---|---|---|---|---|---|

|
#41
3rd St Apt 808
San Francisco, CA 94107
|
807 sq. feet
|
1 baths 3 beds |
show details | |

|
#42
Cayuga Ave
San Francisco, CA 94112
|
1,340 sq. feet
|
1 baths 3 beds |
show details | |

|
#43
Garfield St
San Francisco, CA 94132
|
1,355 sq. feet
|
1 baths 3 beds |
show details | |

|
#44
106th Ave
Oakland, CA 94605
|
1,127 sq. feet
|
1 baths 3 beds |
show details | |

|
#45
Byxbee St
San Francisco, CA 94132
|
800 sq. feet
|
1 baths 1 beds |
show details | |

|
#46
Overland Ave
Emeryville, CA 94608
|
- sq. feet
|
- baths - beds |
$72,950
|
show details |

|
#47
Hollister Ave
San Francisco, CA 94124
|
1,000 sq. feet
|
3 baths 5 beds |
show details | |

|
#48
86th Ave
Oakland, CA 94621
|
835 sq. feet
|
1 baths 2 beds |
show details | |

|
#49
D St
Oakland, CA 94603
|
1,140 sq. feet
|
1 baths 3 beds |
show details | |

|
Check over 1 million property listings on Foreclosure.com!
|
browse all offers | |||


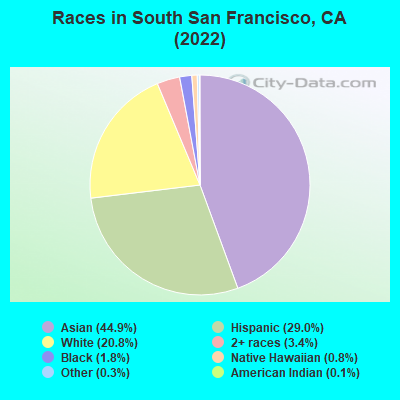
- 28,44344.9%Asian alone
- 18,36729.0%Hispanic
- 13,18420.8%White alone
- 2,1433.4%Two or more races
- 1,1191.8%Black alone
- 4960.8%Native Hawaiian and Other
Pacific Islander alone - 1820.3%Other race alone
- 940.1%American Indian alone
According to our research of California and other state lists, there were 51 registered sex offenders living in South San Francisco, California as of April 25, 2024.
The ratio of all residents to sex offenders in South San Francisco is 1,314 to 1.
The ratio of registered sex offenders to all residents in this city is lower than the state average.
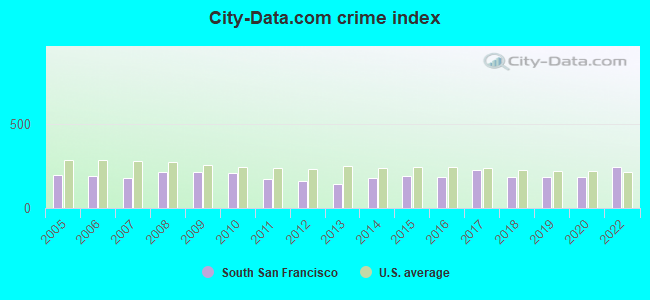
The City-Data.com crime index weighs serious crimes and violent crimes more heavily. Higher means more crime, U.S. average is 246.1. It adjusts for the number of visitors and daily workers commuting into cities.
- means the value is smaller than the state average.- means the value is about the same as the state average.
- means the value is bigger than the state average.
- means the value is much bigger than the state average.
Crime rate in South San Francisco detailed stats: murders, rapes, robberies, assaults, burglaries, thefts, arson
Full-time law enforcement employees in 2021, including police officers: 114 (84 officers - 74 male; 10 female).
| Officers per 1,000 residents here: | 1.26 |
| California average: | 2.30 |
 Recent articles from our blog. Our writers, many of them Ph.D. graduates or candidates, create easy-to-read articles on a wide variety of topics.


Latest news from South San Francisco, CA collected exclusively by city-data.com from local newspapers, TV, and radio stations
Ancestries: Italian (2.8%), American (1.7%), Irish (1.5%), European (1.4%).
Current Local Time: PST time zone
Elevation: 19 feet
Land area: 9.02 square miles.
Population density: 7,038 people per square mile (high).
25,481 residents are foreign born (25.0% Asia, 10.6% Latin America).
| This city: | 40.2% |
| California: | 26.5% |
Median real estate property taxes paid for housing units with mortgages in 2022: $7,691 (0.6%)
Median real estate property taxes paid for housing units with no mortgage in 2022: $4,955 (0.4%)
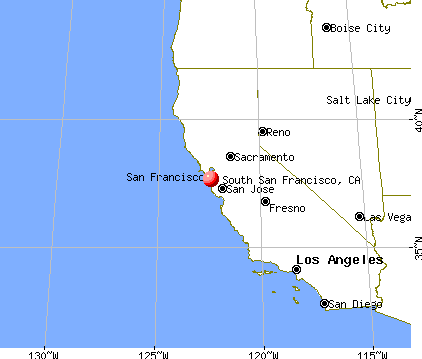
Nearest city with pop. 200,000+: San Francisco, CA  (7.2 miles , pop. 776,733).
Nearest city with pop. 1,000,000+: Los Angeles, CA (335.3 miles , pop. 3,694,820).
Nearest cities:
), ), ), Latitude: 37.66 N, Longitude: 122.43 W
Daytime population change due to commuting: +19,891 (+31.4%)
Workers who live and work in this city: 11,464 (33.9%)
Area code: 650
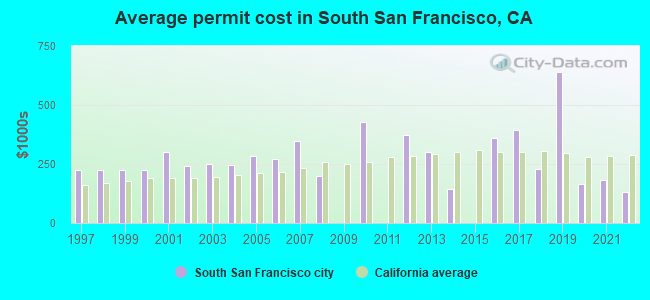
Property values in South San Francisco, CA
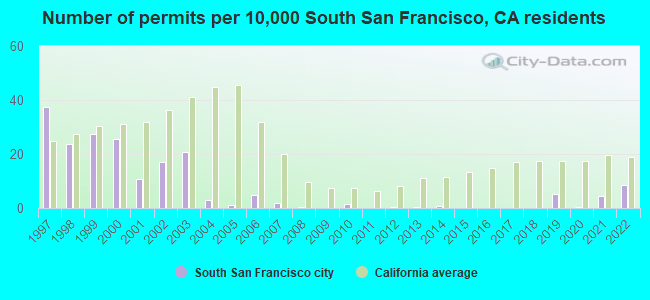
Single-family new house construction building permits:
- 2022: 51 buildings, average cost: $133,000
- 2021: 26 buildings, average cost: $184,100
- 2020: 3 buildings, average cost: $166,700
- 2019: 32 buildings, average cost: $639,200
- 2018: 1 building, cost: $227,800
- 2017: 1 building, cost: $393,000
- 2016: 1 building, cost: $360,700
- 2014: 5 buildings, average cost: $146,100
- 2013: 2 buildings, average cost: $299,400
- 2012: 3 buildings, average cost: $372,200
- 2010: 10 buildings, average cost: $425,900
- 2008: 3 buildings, average cost: $200,500
- 2007: 12 buildings, average cost: $347,100
- 2006: 30 buildings, average cost: $272,000
- 2005: 6 buildings, average cost: $285,200
- 2004: 18 buildings, average cost: $246,500
- 2003: 126 buildings, average cost: $248,600
- 2002: 103 buildings, average cost: $240,200
- 2001: 65 buildings, average cost: $300,000
- 2000: 155 buildings, average cost: $224,600
- 1999: 166 buildings, average cost: $224,800
- 1998: 144 buildings, average cost: $223,600
- 1997: 227 buildings, average cost: $223,600
| Here: | 3.4% |
| California: | 5.1% |
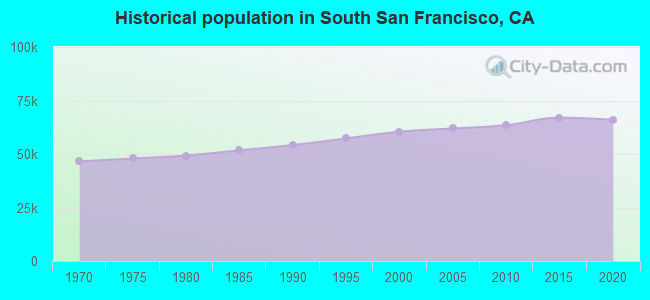
Population change in the 1990s: +6,074 (+11.1%).
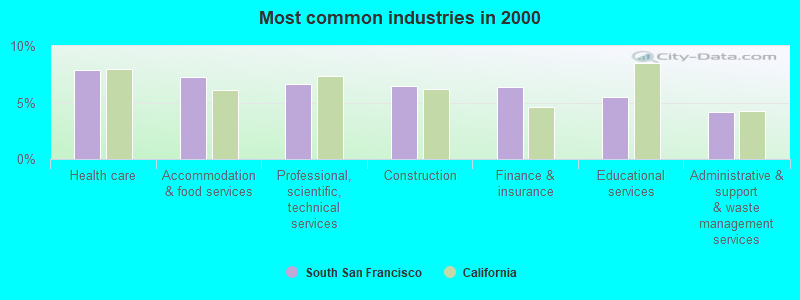
- Health care (7.9%)
- Accommodation & food services (7.3%)
- Professional, scientific, technical services (6.6%)
- Construction (6.5%)
- Finance & insurance (6.4%)
- Educational services (5.5%)
- Administrative & support & waste management services (4.2%)
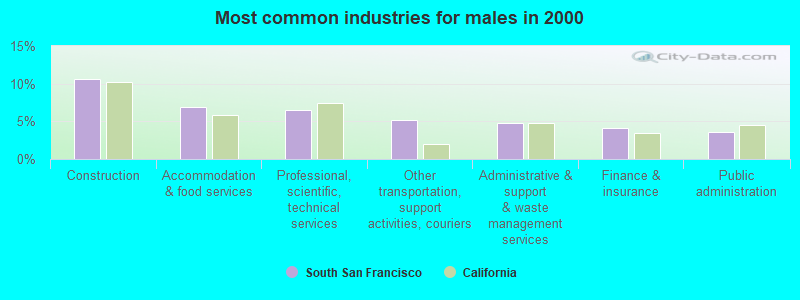
- Construction (10.7%)
- Accommodation & food services (6.8%)
- Professional, scientific, technical services (6.5%)
- Other transportation, support activities, couriers (5.2%)
- Administrative & support & waste management services (4.8%)
- Finance & insurance (4.1%)
- Public administration (3.6%)
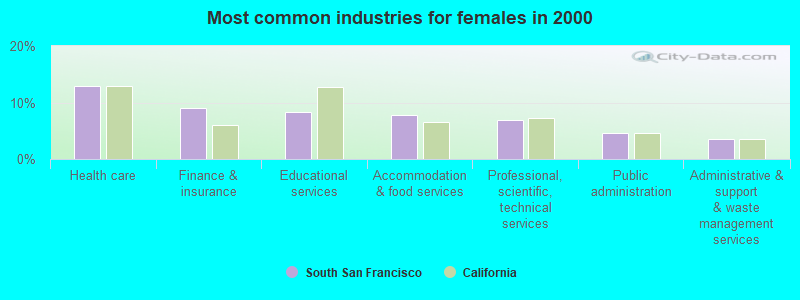
- Health care (12.9%)
- Finance & insurance (9.0%)
- Educational services (8.3%)
- Accommodation & food services (7.8%)
- Professional, scientific, technical services (6.9%)
- Public administration (4.7%)
- Administrative & support & waste management services (3.5%)
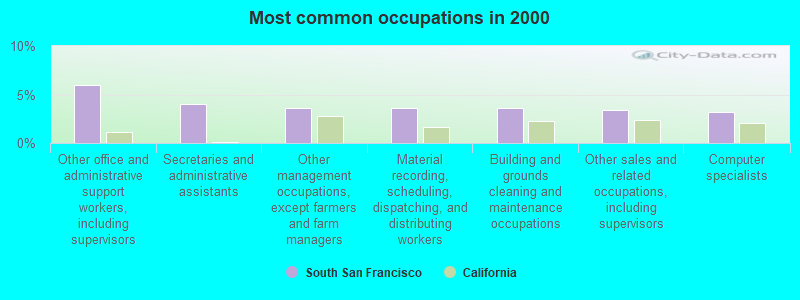
- Other office and administrative support workers, including supervisors (6.0%)
- Secretaries and administrative assistants (4.1%)
- Other management occupations, except farmers and farm managers (3.6%)
- Material recording, scheduling, dispatching, and distributing workers (3.6%)
- Building and grounds cleaning and maintenance occupations (3.6%)
- Other sales and related occupations, including supervisors (3.4%)
- Computer specialists (3.2%)
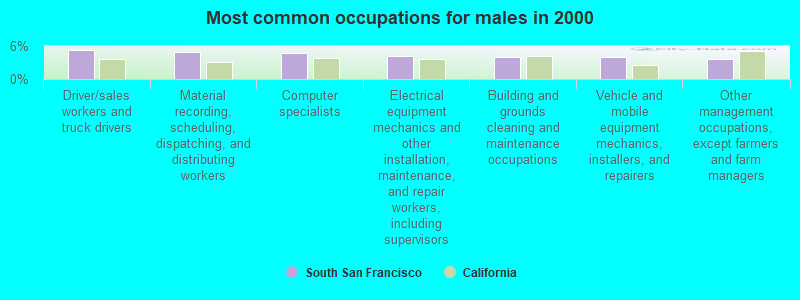
- Driver/sales workers and truck drivers (5.2%)
- Material recording, scheduling, dispatching, and distributing workers (4.9%)
- Computer specialists (4.7%)
- Electrical equipment mechanics and other installation, maintenance, and repair workers, including supervisors (4.1%)
- Building and grounds cleaning and maintenance occupations (4.0%)
- Vehicle and mobile equipment mechanics, installers, and repairers (3.9%)
- Other management occupations, except farmers and farm managers (3.6%)
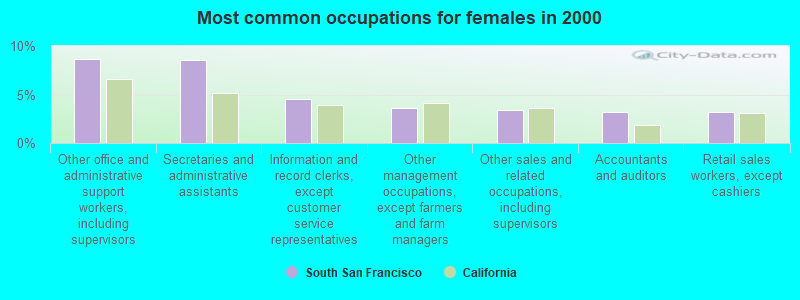
- Other office and administrative support workers, including supervisors (8.7%)
- Secretaries and administrative assistants (8.5%)
- Information and record clerks, except customer service representatives (4.6%)
- Other management occupations, except farmers and farm managers (3.6%)
- Other sales and related occupations, including supervisors (3.4%)
- Accountants and auditors (3.2%)
- Retail sales workers, except cashiers (3.2%)
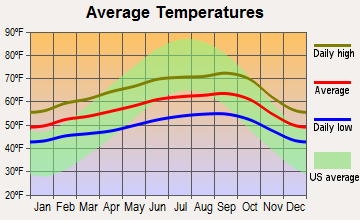
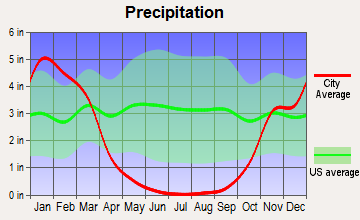
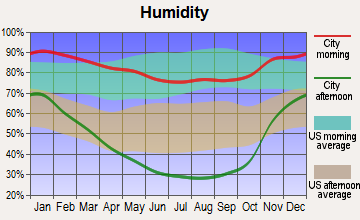
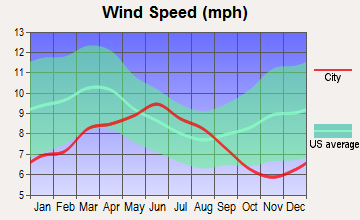
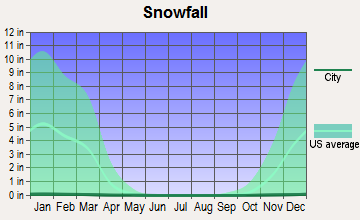
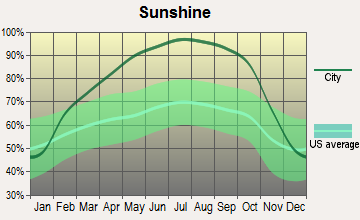
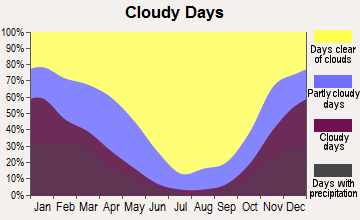
Average climate in South San Francisco, California
Based on data reported by over 4,000 weather stations
|
|

(lower is better)
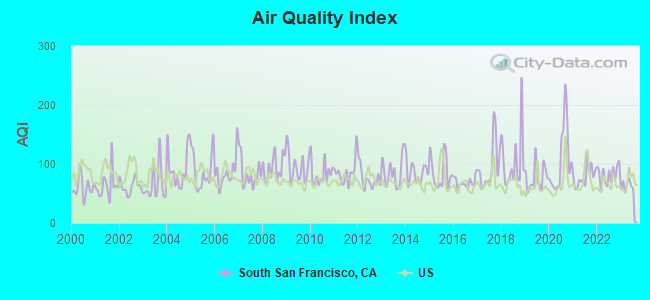
Air Quality Index (AQI) level in 2023 was 63.4. This is about average.
| City: | 63.4 |
| U.S.: | 72.6 |
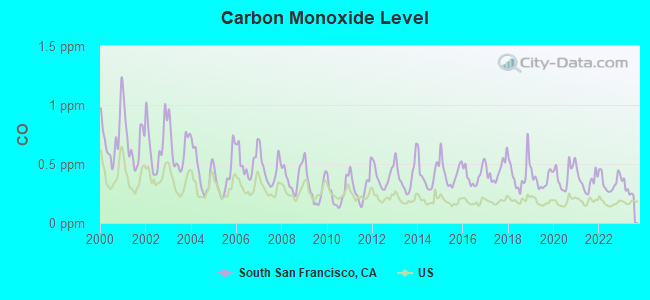
Carbon Monoxide (CO) [ppm] level in 2023 was 0.288. This is about average. Closest monitor was 5.3 miles away from the city center.
| City: | 0.288 |
| U.S.: | 0.251 |
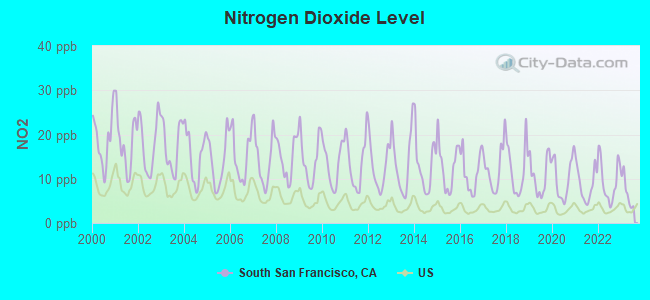
Nitrogen Dioxide (NO2) [ppb] level in 2023 was 7.01. This is worse than average. Closest monitor was 5.9 miles away from the city center.
| City: | 7.01 |
| U.S.: | 5.11 |
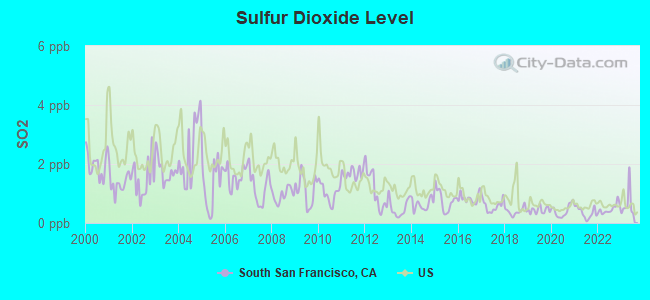
Sulfur Dioxide (SO2) [ppb] level in 2023 was 0.644. This is significantly better than average. Closest monitor was 5.9 miles away from the city center.
| City: | 0.644 |
| U.S.: | 1.515 |
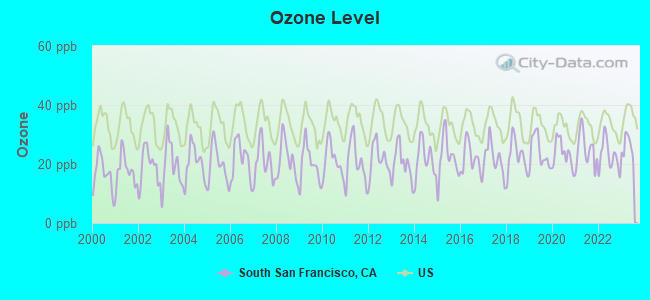
Ozone [ppb] level in 2023 was 25.9. This is better than average. Closest monitor was 5.9 miles away from the city center.
| City: | 25.9 |
| U.S.: | 33.3 |
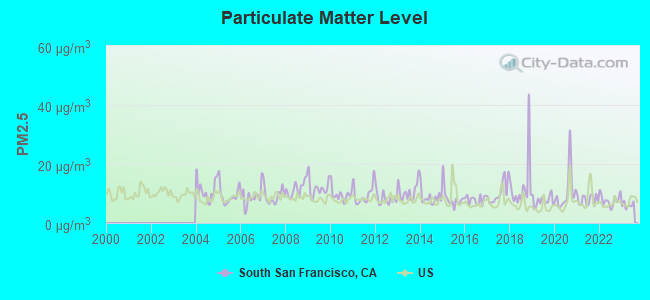
Particulate Matter (PM2.5) [µg/m3] level in 2023 was 6.06. This is better than average. Closest monitor was 7.7 miles away from the city center.
| City: | 6.06 |
| U.S.: | 8.11 |
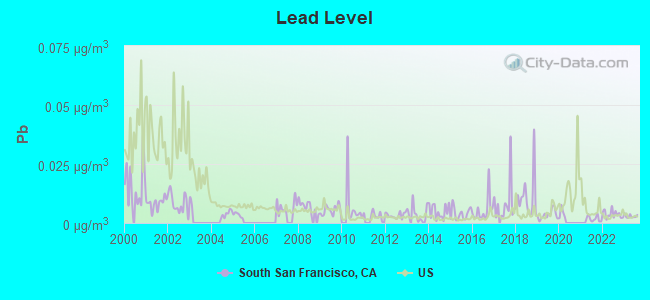
Lead (Pb) [µg/m3] level in 2023 was 0.00290. This is significantly better than average. Closest monitor was 5.9 miles away from the city center.
| City: | 0.00290 |
| U.S.: | 0.00931 |
Earthquake activity:
South San Francisco-area historical earthquake activity is significantly above California state average. It is 7341% greater than the overall U.S. average.On 4/18/1906 at 13:12:21, a magnitude 7.9 (7.9 UK, Class: Major, Intensity: VIII - XII) earthquake occurred 39.4 miles away from the city center, causing $524,000,000 total damage
On 10/18/1989 at 00:04:15, a magnitude 7.1 (6.5 MB, 7.1 MS, 6.9 MW, 7.0 ML) earthquake occurred 52.2 miles away from the city center, causing 62 deaths (62 shaking deaths) and 3757 injuries, causing $1,305,032,704 total damage
On 11/4/1927 at 13:51:53, a magnitude 7.5 (7.5 UK) earthquake occurred 204.9 miles away from the city center
On 7/21/1952 at 11:52:14, a magnitude 7.7 (7.7 UK) earthquake occurred 264.9 miles away from South San Francisco center, causing $50,000,000 total damage
On 1/31/1922 at 13:17:28, a magnitude 7.6 (7.6 UK) earthquake occurred 269.1 miles away from the city center
On 4/25/1992 at 18:06:04, a magnitude 7.2 (6.3 MB, 7.1 MS, 7.2 MW, 7.1 MW, Depth: 9.4 mi) earthquake occurred 206.2 miles away from the city center, causing $75,000,000 total damage
Magnitude types: body-wave magnitude (MB), local magnitude (ML), surface-wave magnitude (MS), moment magnitude (MW)
Natural disasters:
The number of natural disasters in San Mateo County (18) is near the US average (15).Major Disasters (Presidential) Declared: 11
Emergencies Declared: 2
Causes of natural disasters: Floods: 11, Storms: 6, Mudslides: 5, Winter Storms: 5, Landslides: 4, Fires: 2, Drought: 1, Earthquake: 1, Freeze: 1, Hurricane: 1, Tornado: 1, Other: 1 (Note: some incidents may be assigned to more than one category).
Main business address for: GENENTECH INC (PHARMACEUTICAL PREPARATIONS), CORGENTECH INC (PHARMACEUTICAL PREPARATIONS), ACTUATE CORP (SERVICES-PREPACKAGED SOFTWARE), RENOVIS INC (PHARMACEUTICAL PREPARATIONS), EXELIXIS INC (SERVICES-COMMERCIAL PHYSICAL & BIOLOGICAL RESEARCH), RIGEL PHARMACEUTICALS INC (PHARMACEUTICAL PREPARATIONS), CELL GENESYS INC (PHARMACEUTICAL PREPARATIONS), CYTOKINETICS INC (PHARMACEUTICAL PREPARATIONS) and 7 other public companies.
Hospitals in South San Francisco:
- ALTA LOMA ICF/DDN HOME (865 ALTA LOMA DRIVE)
- DEL MONTE ICF/DDN (210 DEL MONTE AVENUE)
- KAISER FOUNDATION HOSPITAL - SOUTH SAN FRANCISCO (Voluntary non-profit - Private, provides emergency services, 1200 EL CAMINO REAL)
- KAISER HOSPICE OF SO SAN FRANCISCO (1200 EL CAMINO REAL)
- MARNET ICF/DD-H (653 COMMERCIAL AVENUE)
- NEWMAN ICF/DDN HOME (830 NEWMAN DRIVE)
- ROSEWOOD HOME ICF/DDH (138 ROSEWOOD WAY)
- STEPHANIE'S ICF/DDN (776 DEL MONTE AVENUE)
- THE BRADFORD HOME ICF/DD-N (59 BRADFORD DRIVE)
Dialysis Facilities in South San Francisco:
- SATELLITE DIALYSIS SOUTH SAN FRANCISCO (205 KENWOOD WAY)
- WESTBOROUGH DIALYSIS CENTER (925 EL CAMINO REAL)
Home Health Centers in South San Francisco:
Amtrak stations near South San Francisco:
- 4 miles: SAN FRANCISCO INT'L AIRPO (SAN BRUNO, SAN FRANCISCO INTERNATIONAL AIRPORT) - Bus Station . Services: fully wheelchair accessible, enclosed waiting area, public restrooms, public payphones, snack bar, paid short-term parking, paid long-term parking, car rental agency, taxi stand, public transit connection.
- 5 miles: MILLBRAE (MILLBRAE AVE. & CALIFORNIA DR.) - Bus Station . Services: fully wheelchair accessible, public payphones, free short-term parking, call for taxi service, public transit connection.
- 9 miles: SAN FRANCISCO SHOPPING (SAN FRANCISCO, 835 MARKET ST.) - Bus Station . Services: fully wheelchair accessible, public payphones, snack bar, paid short-term parking, paid long-term parking, call for taxi service, public transit connection.
College/University in South San Francisco:
Colleges/universities with over 2000 students nearest to South San Francisco:
- Skyline College (about 3 miles; San Bruno, CA; Full-time enrollment: 5,824)
- City College of San Francisco (about 6 miles; San Francisco, CA; FT enrollment: 17,569)
- San Francisco State University (about 6 miles; San Francisco, CA; FT enrollment: 24,644)
- University of San Francisco (about 9 miles; San Francisco, CA; FT enrollment: 9,190)
- Academy of Art University (about 10 miles; San Francisco, CA; FT enrollment: 12,352)
- College of San Mateo (about 10 miles; San Mateo, CA; FT enrollment: 5,398)
- College of Alameda (about 12 miles; Alameda, CA; FT enrollment: 3,071)
Public high schools in South San Francisco:
- SOUTH SAN FRANCISCO HIGH (Students: 1,063, Location: 400 B ST., Grades: 9-12)
- BADEN HIGH (CONTINUATION) (Students: 38, Location: 825 S.WOOD DR., Grades: 9-12)
- EL CAMINO HIGH (Location: 1320 MISSION RD., Grades: 9-12)
- COMMUNITY DAY (Location: 201 W. ORANGE AVE., Grades: 6-12)
Private high school in South San Francisco:
Public elementary/middle schools in South San Francisco:
- ALTA LOMA MIDDLE (Students: 778, Location: 116 ROMNEY AVE., Grades: 6-8)
- WESTBOROUGH MIDDLE (Students: 650, Location: 2570 W.BOROUGH BLVD., Grades: 6-8)
- PARKWAY HEIGHTS MIDDLE (Students: 528, Location: 650 SUNSET AVE., Grades: 6-8)
- BURI BURI ELEMENTARY (Students: 400, Location: 120 EL CAMPO DR., Grades: KG-5)
- SPRUCE ELEMENTARY (Students: 351, Location: 501 SPRUCE AVE., Grades: KG-5)
- PONDEROSA ELEMENTARY (Students: 271, Location: 295 PONDEROSA RD., Grades: KG-5)
- SUNSHINE GARDENS ELEMENTARY (Students: 245, Location: 1200 MILLER AVE., Grades: KG-5)
- LOS CERRITOS ELEMENTARY (Students: 232, Location: 210 W. ORANGE AVE., Grades: KG-5)
- MARTIN ELEMENTARY (Location: 35 SCH ST., Grades: KG-5)
Private elementary/middle schools in South San Francisco:
- ST VERONICA CATHOLIC SCHOOL (Students: 303, Location: 434 ALIDA WAY, Grades: KG-8)
- ALL SOULS ELEMENTARY SCHOOL (Students: 255, Location: 479 MILLER AVE, Grades: T1-8)
- HILLSIDE CHRISTIAN ACADEMY (Students: 130, Location: 1415 HILLSIDE BLVD, Grades: PK-7)
- MILLS MONTESSORI SCHOOL (Students: 113, Location: 1400 HILLSIDE BLVD, Grades: PK-5)
Points of interest:
Notable locations in South San Francisco: California Golf Club (A), Oyster Point Marina (B), Oyster Cove Marina (C), Golden Gate Produce Terminal (D), El Camino Golf Club (E), South San Francisco City Hall (F), Grand Avenue Branch South San Francisco Public Library (G), South San Francisco Fire Department Station 63 (H), South San Francisco Public Library (I), San Mateo County Court Building (J), South San Francisco Fire Department Station 61 (K), South San Francisco Fire Department Station 64 (L), South San Francisco Fire Department Station 65 (M), South San Francisco Fire Department Station 62 (N). Display/hide their locations on the map
Shopping Centers: Sunshine Gardens Shopping Center (1), Southwood Shopping Center (2), El Camino Real Shopping Center (3), Buri-Buri Shopping Center (4), Brentwood Shopping Center (5), Winston Manor Shopping Center (6), Westborough Square Shopping Center (7). Display/hide their locations on the map
Main business address in South San Francisco include: GENENTECH INC (A), CORGENTECH INC (B), ACTUATE CORP (C), RENOVIS INC (D), EXELIXIS INC (E), RIGEL PHARMACEUTICALS INC (F), CELL GENESYS INC (G), CYTOKINETICS INC (H). Display/hide their locations on the map
Churches in South San Francisco include: Alls Souls Roman Catholic Church (A), Faith Tabernacle Assembly of God Church (B), First Baptist Church (C), First Church of Christ Scientist (D), First Southen Baptist Church (E), Our Redeemers Lutheran Church (F), Saint Pauls Community Methodist Church (G). Display/hide their locations on the map
Cemetery: Orange Memorial Park (1). Display/hide its location on the map
Creek: Colma Creek (A). Display/hide its location on the map
Parks in South San Francisco include: Selick Park (1), Westborough Park (2), Winston Manor Park (3), Briarwood Park (4), Buri Buri Park (5), Cypress and Pine Playlot (6), Hillside Recreation Center (7), Oyster Point Park (8), Paradise Valley Park (9). Display/hide their locations on the map
Tourist attractions: AAA Video Amusement Inc (Amusement & Theme Parks; 121 South Maple Avenue Suite 11), Barrango (Amusement & Theme Parks; 360 SWift Avenue), Betson Pacific Distributing CO (Amusement & Theme Parks; 213 East Harris Avenue).
Hotels: Airport Inn (751 Airport Boulevard), BEST WESTERN GROSVENOR HOTEL (380 South Airport Boulevard), Americana Inn Motel (760 El Camino Real), Blue Ribbon Supply Company (451 East Jamie Court).
Birthplace of: Walt Harris - Football coach and former player.
Drinking water stations with addresses in South San Francisco that have no violations reported:
- SELF-SERVE PETROLEUM (Population served: 810, Primary Water Source Type: Groundwater)
| This city: | 3.0 people |
| California: | 2.9 people |
| This city: | 73.2% |
| Whole state: | 68.7% |
| This city: | 6.1% |
| Whole state: | 7.2% |
Likely homosexual households (counted as self-reported same-sex unmarried-partner households)
- Lesbian couples: 0.4% of all households
- Gay men: 0.5% of all households
People in group quarters in South San Francisco in 2010:
- 304 people in group homes intended for adults
- 105 people in other noninstitutional facilities
- 69 people in emergency and transitional shelters (with sleeping facilities) for people experiencing homelessness
- 33 people in workers' group living quarters and job corps centers
- 18 people in nursing facilities/skilled-nursing facilities
- 18 people in in-patient hospice facilities
- 17 people in residential treatment centers for adults
- 12 people in group homes for juveniles (non-correctional)
- 3 people in correctional residential facilities
People in group quarters in South San Francisco in 2000:
- 148 people in nursing homes
- 88 people in other nonhousehold living situations
- 88 people in other noninstitutional group quarters
- 51 people in homes or halfway houses for drug/alcohol abuse
- 42 people in homes for the mentally retarded
- 14 people in religious group quarters
- 12 people in other group homes
Banks with most branches in South San Francisco (2011 data):
- U.S. Bank National Association: Gellert Boulevard Pac N Save Branch at 2255 Gellert Boulevard, branch established on 2004/08/16; South San Francisco Branch at 370 Grand Avenue, branch established on 1973/01/01. Info updated 2012/01/30: Bank assets: $330,470.8 mil, Deposits: $236,091.5 mil, headquarters in Cincinnati, OH, positive income, 3121 total offices, Holding Company: U.S. Bancorp
- First National Bank of Northern California: Buri Buri Branch at 975 El Camino Real, branch established on 1980/12/15; South San Francisco Branch at 211 Airport Boulevard, branch established on 1968/09/30. Info updated 2006/11/03: Bank assets: $715.6 mil, Deposits: $622.4 mil, headquarters in Daly City, CA, positive income, Commercial Lending Specialization, 12 total offices, Holding Company: Fnb Bancorp
- Citibank, National Association: Oyster Point Boulevard Branch at 400 Oyster Point Boulevard, branch established on 1994/03/21; 101 Arroyo Drive Branch at 101 Arroyo Drive, branch established on 1934/10/01. Info updated 2012/01/10: Bank assets: $1,288,658.0 mil, Deposits: $882,541.0 mil, headquarters in Sioux Falls, SD, positive income, International Specialization, 1048 total offices, Holding Company: Citigroup Inc.
- Wells Fargo Bank, National Association: Chestnut Avenue Branch at 10 Chestnut Avenue, branch established on 1973/02/02; South San Francisco Branch at 333 Linden Avenue, branch established on 1955/09/26. Info updated 2011/04/05: Bank assets: $1,161,490.0 mil, Deposits: $905,653.0 mil, headquarters in Sioux Falls, SD, positive income, 6395 total offices, Holding Company: Wells Fargo & Company
- The Bank of East Asia (USA), National Association: South San Francisco Branch at 235 Grand Avenue, Suite 101, branch established on 2008/02/28. Info updated 2006/05/30: Bank assets: $780.4 mil, Deposits: $620.7 mil, headquarters in New York, NY, positive income, Commercial Lending Specialization, 13 total offices, Holding Company: Bank Of East Asia, Limited, The
- Bank of America, National Association: South San Francisco Branch at 955 El Camino Real, branch established on 1956/06/18. Info updated 2009/11/18: Bank assets: $1,451,969.3 mil, Deposits: $1,077,176.8 mil, headquarters in Charlotte, NC, positive income, 5782 total offices, Holding Company: Bank Of America Corporation
- Union Bank, National Association: South San Francisco Branch at 58 S Linden Ave, branch established on 1994/05/09. Info updated 2011/09/01: Bank assets: $88,967.5 mil, Deposits: $65,286.4 mil, headquarters in San Francisco, CA, positive income, Commercial Lending Specialization, 403 total offices, Holding Company: Mitsubishi Ufj Financial Group, Inc.
- JPMorgan Chase Bank, National Association: South San Francisco Branch at 101 Mclellan Dr, Ste 1034, branch established on 2008/09/25. Info updated 2011/11/10: Bank assets: $1,811,678.0 mil, Deposits: $1,190,738.0 mil, headquarters in Columbus, OH, positive income, International Specialization, 5577 total offices, Holding Company: Jpmorgan Chase & Co.
- Liberty Bank: at 500 Linden Avenue, branch established on 1982/04/07. Info updated 2006/11/03: Bank assets: $216.8 mil, Deposits: $191.2 mil, local headquarters, negative income in the last year, Commercial Lending Specialization, 4 total offices, Holding Company: Liberty Bancorp
- 2 other banks with 2 local branches
For population 15 years and over in South San Francisco:
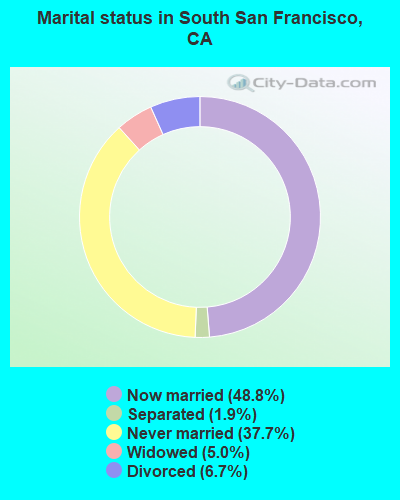
- Never married: 37.7%
- Now married: 48.8%
- Separated: 1.9%
- Widowed: 5.0%
- Divorced: 6.7%
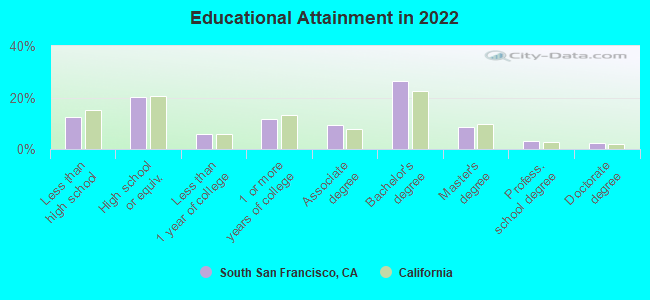
For population 25 years and over in South San Francisco:
- High school or higher: 88.3%
- Bachelor's degree or higher: 39.4%
- Graduate or professional degree: 12.6%
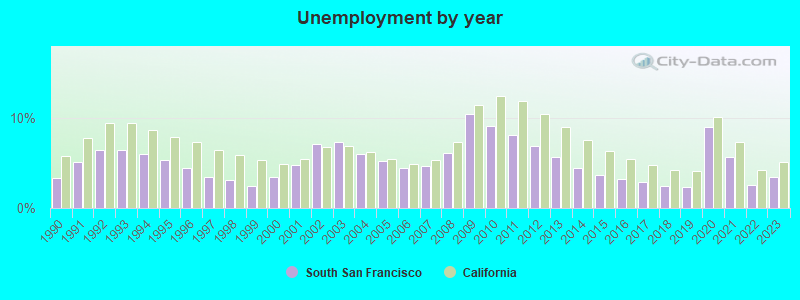
- Unemployed: 3.8%
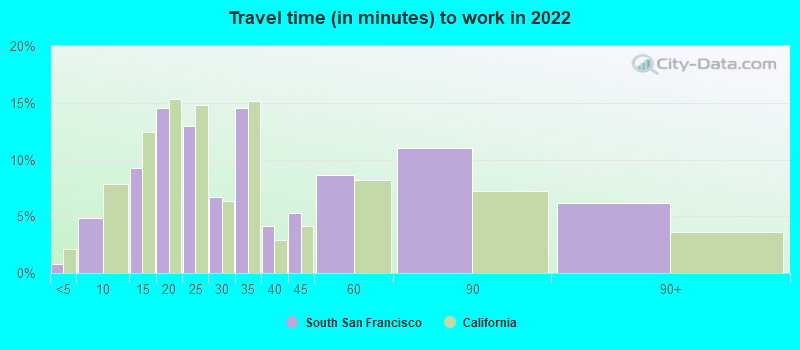
- Mean travel time to work (commute): 20.5 minutes
| Here: | 15.0 |
| California average: | 15.5 |
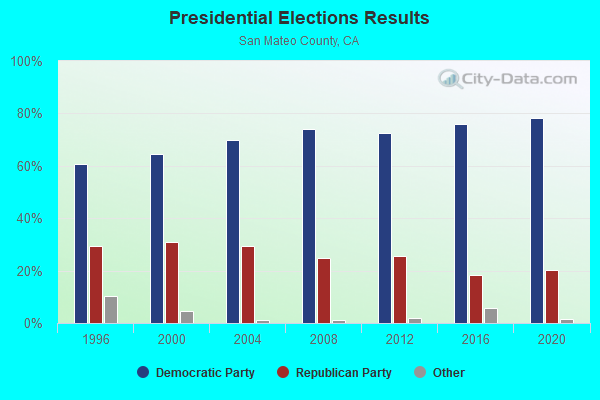
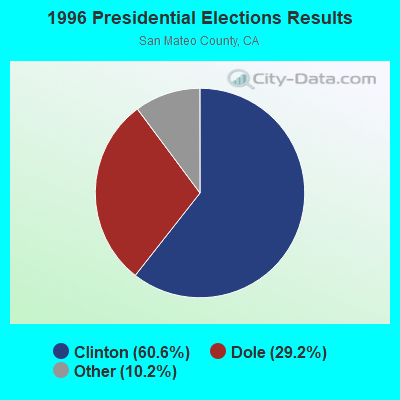
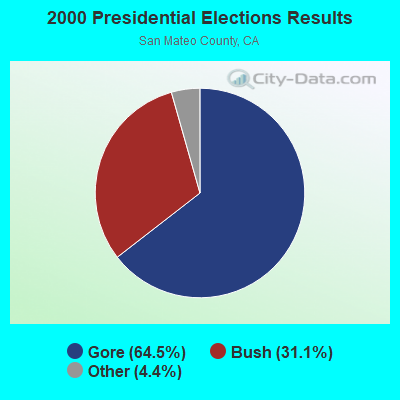
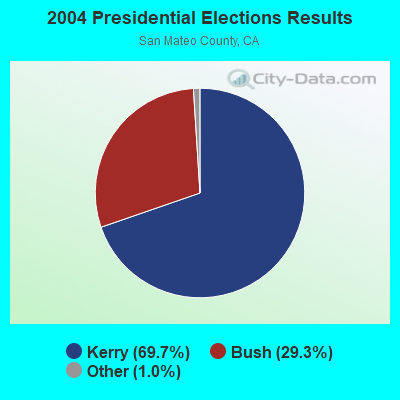

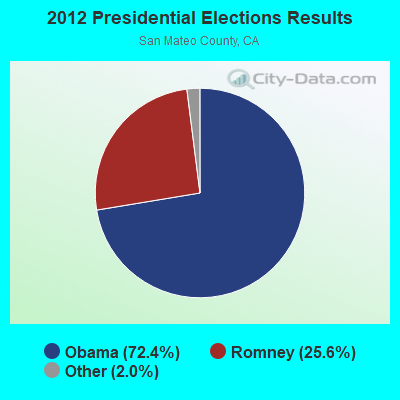
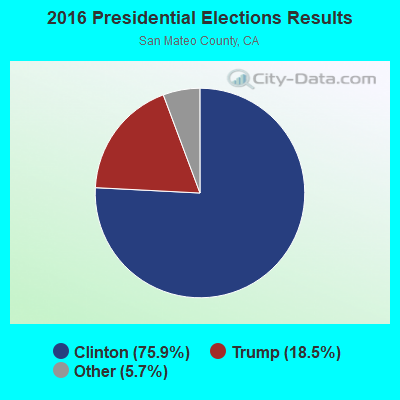
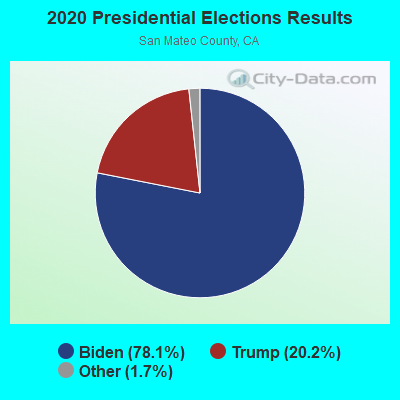
Graphs represent county-level data. Detailed 2008 Election Results
Political contributions by individuals in South San Francisco, CA
Neighborhoods in South San Francisco:
(South San Francisco, California Neighborhood Map)- Avalon (Avalon Park) neighborhood
- Baden neighborhood
- Brentwood neighborhood
- Buri Buri neighborhood
- Downtown neighborhood
- El Camino neighborhood
- Francisco Terrace (The Terrace) neighborhood
- Gateway neighborhood
- Lindenville neighborhood
- Mayfair Village neighborhood
- Mission Road neighborhood
- Orange Park neighborhood
- Oyster Point neighborhood
- Paradise Valley (Terra Bay) neighborhood
- Sierra Highlands neighborhood
- Sign Hill neighborhood
- South Airport neighborhood
- Southwood neighborhood
- Sterling Terrace neighborhood
- Sunshine Gardens neighborhood
- Tenforan neighborhood
- The East Side (Eastside) neighborhood
- Treasure Island neighborhood
- West Winston Manor neighborhood
- Westborough (The Boroughs) neighborhood
- Winston Manor (Winston-Serra) neighborhood
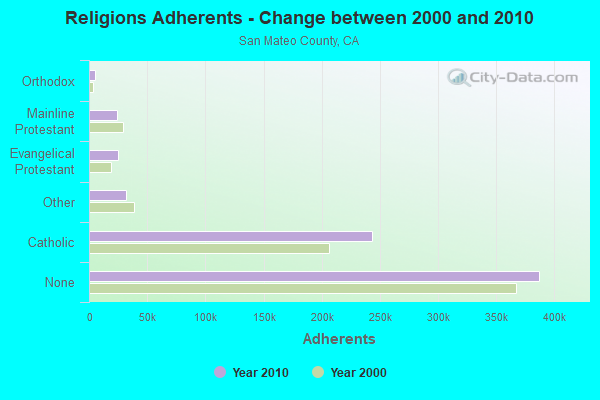
Religion statistics for South San Francisco, CA (based on San Mateo County data)
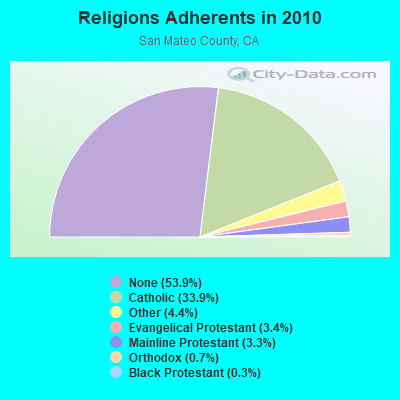
| Religion | Adherents | Congregations |
|---|---|---|
| Catholic | 243,634 | 22 |
| Other | 31,697 | 78 |
| Evangelical Protestant | 24,771 | 166 |
| Mainline Protestant | 23,840 | 74 |
| Orthodox | 5,350 | 5 |
| Black Protestant | 2,046 | 12 |
| None | 387,113 | - |
Food Environment Statistics:
| San Mateo County: | 2.44 / 10,000 pop. |
| California: | 2.14 / 10,000 pop. |
| This county: | 0.06 / 10,000 pop. |
| California: | 0.04 / 10,000 pop. |
| This county: | 0.56 / 10,000 pop. |
| California: | 0.62 / 10,000 pop. |
| San Mateo County: | 1.62 / 10,000 pop. |
| California: | 1.49 / 10,000 pop. |
| This county: | 10.02 / 10,000 pop. |
| California: | 7.42 / 10,000 pop. |
| San Mateo County: | 7.1% |
| California: | 7.3% |
| San Mateo County: | 16.9% |
| California: | 21.3% |
| Here: | 18.0% |
| California: | 17.9% |
Health and Nutrition:
| Here: | 52.2% |
| State: | 49.4% |
| This city: | 49.9% |
| California: | 48.0% |
| South San Francisco: | 27.5 |
| California: | 28.1 |
| This city: | 18.4% |
| California: | 20.2% |
| This city: | 14.2% |
| State: | 11.2% |
| This city: | 6.8 |
| California: | 6.8 |
| This city: | 29.4% |
| California: | 31.5% |
| Here: | 57.4% |
| California: | 56.4% |
| This city: | 81.6% |
| California: | 80.9% |
More about Health and Nutrition of South San Francisco, CA Residents
| Local government employment and payroll (March 2022) | |||||
| Function | Full-time employees | Monthly full-time payroll | Average yearly full-time wage | Part-time employees | Monthly part-time payroll |
|---|---|---|---|---|---|
| Firefighters | 93 | $1,212,381 | $156,436 | 2 | $847 |
| Police Protection - Officers | 87 | $1,049,423 | $144,748 | 4 | $7,991 |
| Parks and Recreation | 75 | $512,415 | $81,986 | 142 | $207,378 |
| Sewerage | 57 | $511,573 | $107,700 | 1 | $4,599 |
| Other and Unallocable | 32 | $311,487 | $116,808 | 6 | $416 |
| Police - Other | 30 | $343,213 | $137,285 | 6 | $23,500 |
| Other Government Administration | 27 | $384,848 | $171,044 | 11 | $12,715 |
| Local Libraries | 21 | $168,801 | $96,458 | 59 | $107,096 |
| Financial Administration | 20 | $182,901 | $109,741 | 0 | $0 |
| Streets and Highways | 15 | $131,142 | $104,914 | 2 | $7,651 |
| Fire - Other | 9 | $87,320 | $116,427 | 0 | $0 |
| Solid Waste Management | 5 | $47,381 | $113,714 | 0 | $0 |
| Housing and Community Development (Local) | 1 | $8,484 | $101,808 | 1 | $806 |
| Welfare | 1 | $10,437 | $125,244 | 0 | $0 |
| Totals for Government | 473 | $4,961,806 | $125,881 | 234 | $372,999 |
South San Francisco government finances - Expenditure in 2021 (per resident):
- Current Operations - Police Protection: $70,942,000 ($1117.48)
Regular Highways: $39,033,000 ($614.85)
Parks and Recreation: $28,242,000 ($444.87)
Sewerage: $22,277,000 ($350.91)
Local Fire Protection: $20,097,000 ($316.57)
Central Staff Services: $17,742,000 ($279.47)
Health - Other: $11,720,000 ($184.61)
Libraries: $5,904,000 ($93.00)
Housing and Community Development: $5,227,000 ($82.34)
Protective Inspection and Regulation - Other: $3,453,000 ($54.39)
Parking Facilities: $1,085,000 ($17.09)
General - Other: $520,000 ($8.19)
Solid Waste Management: $183,000 ($2.88)
- General - Interest on Debt: $4,240,000 ($66.79)
South San Francisco government finances - Revenue in 2021 (per resident):
- Charges - Sewerage: $36,598,000 ($576.49)
Other: $9,664,000 ($152.23)
Parks and Recreation: $1,786,000 ($28.13)
Parking Facilities: $765,000 ($12.05)
Solid Waste Management: $206,000 ($3.24)
Housing and Community Development: $5,000 ($0.08)
- Federal Intergovernmental - Other: $1,561,000 ($24.59)
Housing and Community Development: $654,000 ($10.30)
- Local Intergovernmental - Other: $850,000 ($13.39)
- Miscellaneous - Special Assessments: $13,055,000 ($205.64)
General Revenue - Other: $12,982,000 ($204.49)
Donations From Private Sources: $4,074,000 ($64.17)
Rents: $2,971,000 ($46.80)
Interest Earnings: $1,260,000 ($19.85)
Fines and Forfeits: $536,000 ($8.44)
- State Intergovernmental - Other: $7,324,000 ($115.37)
Highways: $2,741,000 ($43.18)
General Local Government Support: $110,000 ($1.73)
- Tax - Property: $37,690,000 ($593.69)
Other Selective Sales: $27,797,000 ($437.86)
Other License: $22,531,000 ($354.91)
General Sales and Gross Receipts: $20,813,000 ($327.85)
Public Utilities Sales: $4,498,000 ($70.85)
Occupation and Business License - Other: $2,695,000 ($42.45)
Documentary and Stock Transfer: $1,319,000 ($20.78)
South San Francisco government finances - Debt in 2021 (per resident):
- Long Term Debt - Outstanding Unspecified Public Purpose: $223,667,000 ($3523.20)
Beginning Outstanding - Unspecified Public Purpose: $135,562,000 ($2135.37)
Issue, Unspecified Public Purpose: $96,273,000 ($1516.49)
Retired Unspecified Public Purpose: $8,168,000 ($128.66)
Outstanding Nonguaranteed - Industrial Revenue: $6,520,000 ($102.70)
Beginning Outstanding - Public Debt for Private Purpose: $6,520,000 ($102.70)
South San Francisco government finances - Cash and Securities in 2021 (per resident):
- Bond Funds - Cash and Securities: $208,166,000 ($3279.03)
- Other Funds - Cash and Securities: $117,199,000 ($1846.12)
- Sinking Funds - Cash and Securities: $10,867,000 ($171.18)
6.99% of this county's 2021 resident taxpayers lived in other counties in 2020 ($178,839 average adjusted gross income)
| Here: | 6.99% |
| California average: | 5.19% |
0.01% of residents moved from foreign countries ($58 average AGI)
San Mateo County: 0.01% California average: 0.03%
Top counties from which taxpayers relocated into this county between 2020 and 2021:
| from San Francisco County, CA | |
| from Santa Clara County, CA | |
| from Alameda County, CA |
9.90% of this county's 2020 resident taxpayers moved to other counties in 2021 ($222,747 average adjusted gross income)
| Here: | 9.90% |
| California average: | 6.14% |
0.01% of residents moved to foreign countries ($372 average AGI)
San Mateo County: 0.01% California average: 0.02%
Top counties to which taxpayers relocated from this county between 2020 and 2021:
| to Santa Clara County, CA | |
| to San Francisco County, CA | |
| to Alameda County, CA |
| Businesses in South San Francisco, CA | ||||
| Name | Count | Name | Count | |
|---|---|---|---|---|
| 7-Eleven | 4 | Long John Silver's | 1 | |
| Arby's | 1 | Lowe's | 1 | |
| Bally Total Fitness | 1 | Marriott | 2 | |
| Best Western | 1 | McDonald's | 2 | |
| Blockbuster | 1 | Nike | 2 | |
| CVS | 1 | Penske | 2 | |
| Carl\s Jr. | 1 | Pizza Hut | 1 | |
| Comfort Inn | 1 | Quality | 1 | |
| Costco | 2 | Quiznos | 1 | |
| Curves | 1 | Ramada | 1 | |
| Days Inn | 1 | Starbucks | 3 | |
| Dennys | 1 | Subway | 3 | |
| FedEx | 7 | T-Mobile | 2 | |
| Firestone Complete Auto Care | 1 | Taco Bell | 2 | |
| H&R Block | 1 | Trader Joe's | 1 | |
| Hilton | 3 | Travelodge | 1 | |
| Howard Johnson | 1 | UPS | 9 | |
| IHOP | 1 | Verizon Wireless | 1 | |
| KFC | 2 | Vons | 3 | |
| La Quinta | 1 | |||
Strongest AM radio stations in South San Francisco:
- KNBR (680 AM; 50 kW; SAN FRANCISCO, CA; Owner: KNBR LICO, INC.)
- KTRB (860 AM; 50 kW; MODESTO, CA; Owner: PAPPAS RADIO OF CALIFORNIA, A CALIFORNIA LIMITED PARTNERSHIP)
- KYCY (1550 AM; 50 kW; SAN FRANCISCO, CA; Owner: INFINITY BROADCASTING OPERATIONS, INC.)
- KTCT (1050 AM; 50 kW; SAN MATEO, CA; Owner: SUSQUEHANNA RADIO CORP.)
- KOIT (1260 AM; 5 kW; SAN FRANCISCO, CA; Owner: BONNEVILLE HOLDING COMPANY)
- KIQI (1010 AM; 35 kW; SAN FRANCISCO, CA; Owner: RADIO UNICA OF SAN FRANCISCO LICENSE CORP.)
- KFAX (1100 AM; 50 kW; SAN FRANCISCO, CA; Owner: GOLDEN GATE BROADCASTING CO, INC.)
- KSFO (560 AM; 5 kW; SAN FRANCISCO, CA; Owner: KGO-AM RADIO, INC.)
- KGO (810 AM; 50 kW; SAN FRANCISCO, CA; Owner: KGO-AM RADIO, INC.)
- KNEW (910 AM; 20 kW; OAKLAND, CA; Owner: AMFM RADIO LICENSES, L.L.C.)
- KCBS (740 AM; 50 kW; SAN FRANCISCO, CA; Owner: INFINITY BROADCASTING OPERATIONS, INC.)
- KFRC (610 AM; 5 kW; SAN FRANCISCO, CA; Owner: INFINITY BROADCASTING CORPORATION OF LOS ANGELES)
- KMZT (1510 AM; 8 kW; SAN RAFAEL, CA; Owner: MOUNT WILSON FM BROADCASTERS, INC.)
Strongest FM radio stations in South San Francisco:
- KFRC-FM (99.7 FM; SAN FRANCISCO, CA; Owner: INFINITY KFRC-FM, INC.)
- KBLX-FM (102.9 FM; BERKELEY, CA; Owner: ICBC BROADCAST HOLDINGS - CA, INC.)
- KYLD (94.9 FM; SAN FRANCISCO, CA; Owner: AMFM RADIO LICENSES, L.L.C.)
- KSAN (107.7 FM; SAN MATEO, CA; Owner: SUSQUEHANNA RADIO CORP.)
- KIOI (101.3 FM; SAN FRANCISCO, CA; Owner: AMFM RADIO LICENSES, L.L.C.)
- KZBR (95.7 FM; SAN FRANCISCO, CA; Owner: BONNEVILLE HOLDING COMPANY)
- KMEL (106.1 FM; SAN FRANCISCO, CA; Owner: AMFM RADIO LICENSES, L.L.C.)
- KQED-FM (88.5 FM; SAN FRANCISCO, CA; Owner: KQED, INC.)
- KITS (105.3 FM; SAN FRANCISCO, CA; Owner: INFINITY BROADCASTING OPERATIONS, INC.)
- KOIT-FM (96.5 FM; SAN FRANCISCO, CA; Owner: BONNEVILLE HOLDING COMPANY)
- KKSF (103.7 FM; SAN FRANCISCO, CA; Owner: AMFM RADIO LICENSES, L.L.C.)
- KFOG (104.5 FM; SAN FRANCISCO, CA; Owner: KFFG LICO, INC)
- KSOL (98.9 FM; SAN FRANCISCO, CA; Owner: TMS LICENSE CALIFORNIA, INC)
- KBAY (93.3 FM; SAN FRANCISCO, CA; Owner: INFINITY BROADCASTING CORP. OF SAN FRANCISCO)
- KALW (91.7 FM; SAN FRANCISCO, CA; Owner: SAN FRANCISCO UNIFIED SCHOOL DIST.)
- KDFC-FM (102.1 FM; SAN FRANCISCO, CA; Owner: BONNEVILLE HOLDING COMPANY)
- KKSF-FM1 (103.7 FM; PLEASANTON, ETC., CA; Owner: AMFM RADIO LICENSES, L.L.C.)
- KSFB-FM (100.7 FM; SAN RAFAEL, CA; Owner: GOLDEN GATE BROADCASTING COMPANY, INC.)
- KFRC-FM3 (99.7 FM; WALNUT CREEK, CA; Owner: INFINITY KFRC-FM, INC.)
- KZBR-FM1 (95.7 FM; WALNUT CREEK, CA; Owner: BONNEVILLE HOLDING COMPANY)
TV broadcast stations around South San Francisco:
- KCSM-TV (Channel 60; SAN MATEO, CA; Owner: SAN MATEO COUNTY COMMUNITY COLLEGE DISTRICT)
- KQED (Channel 9; SAN FRANCISCO, CA; Owner: KQED, INC.)
- KGO-TV (Channel 7; SAN FRANCISCO, CA; Owner: KGO TELEVISION, INC.)
- KPIX-TV (Channel 5; SAN FRANCISCO, CA; Owner: CBS BROADCASTING INC.)
- KTVU (Channel 2; OAKLAND, CA; Owner: KTVU PARTNERSHIP)
- KTSF (Channel 26; SAN FRANCISCO, CA; Owner: LINCOLN BROADCASTING COMPANY, A CALIFORNIA LP)
- KRON-TV (Channel 4; SAN FRANCISCO, CA; Owner: YOUNG BROADCASTING OF SAN FRANCISCO, INC.)
- KMTP-TV (Channel 32; SAN FRANCISCO, CA; Owner: MINORITY TELEVISION PROJECT)
- KBHK-TV (Channel 44; SAN FRANCISCO, CA; Owner: VIACOM TELEVISION STATIONS GROUP OF SAN FRANCISCO INC.)
- KBWB (Channel 20; SAN FRANCISCO, CA; Owner: KBWB LICENSE, INC.)
- KFSF (Channel 66; VALLEJO, CA; Owner: TELEFUTURA SAN FRANCISCO LLC)
- KCNS (Channel 38; SAN FRANCISCO, CA; Owner: WRAY, INC.)
- KBIT-CA (Channel 28; SAN FRANCISCO, ETC., CA; Owner: POLAR BROADCASTING, INC.)
- KICU-TV (Channel 36; SAN JOSE, CA; Owner: KTVU PARTNERSHIP)
- National Bridge Inventory (NBI) Statistics
- 57Number of bridges
- 991ft / 302mTotal length
- $22,753,000Total costs
- 2,608,074Total average daily traffic
- 119,953Total average daily truck traffic

- New bridges - historical statistics
- 11900-1909
- 11920-1929
- 101940-1949
- 41950-1959
- 101960-1969
- 101970-1979
- 71980-1989
- 91990-1999
- 42000-2009
- 12010-2019
FCC Registered Private Land Mobile Towers: 3 (See the full list of FCC Registered Private Land Mobile Towers in South San Francisco, CA)
FCC Registered Broadcast Land Mobile Towers: 52 (See the full list of FCC Registered Broadcast Land Mobile Towers)
FCC Registered Microwave Towers: 60 (See the full list of FCC Registered Microwave Towers in this town)
FCC Registered Paging Towers: 1 (See the full list of FCC Registered Paging Towers)
FCC Registered Maritime Coast & Aviation Ground Towers: 2 (See the full list of FCC Registered Maritime Coast & Aviation Ground Towers)
FCC Registered Amateur Radio Licenses: 311 (See the full list of FCC Registered Amateur Radio Licenses in South San Francisco)
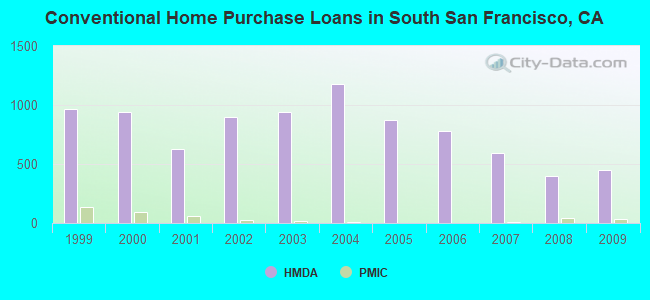
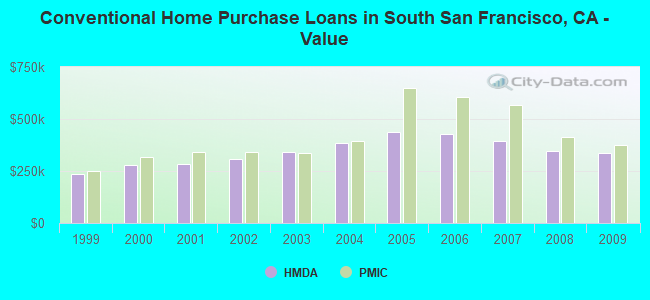
| Home Mortgage Disclosure Act Aggregated Statistics For Year 2009 (Based on 8 full and 2 partial tracts) | ||||||||||||||
| A) FHA, FSA/RHS & VA Home Purchase Loans | B) Conventional Home Purchase Loans | C) Refinancings | D) Home Improvement Loans | E) Loans on Dwellings For 5+ Families | F) Non-occupant Loans on < 5 Family Dwellings (A B C & D) | G) Loans On Manufactured Home Dwelling (A B C & D) | ||||||||
|---|---|---|---|---|---|---|---|---|---|---|---|---|---|---|
| Number | Average Value | Number | Average Value | Number | Average Value | Number | Average Value | Number | Average Value | Number | Average Value | Number | Average Value | |
| LOANS ORIGINATED | 100 | $441,452 | 446 | $335,990 | 1,214 | $321,826 | 70 | $245,014 | 3 | $965,000 | 102 | $303,797 | 0 | $0 |
| APPLICATIONS APPROVED, NOT ACCEPTED | 10 | $426,690 | 46 | $338,092 | 128 | $382,415 | 3 | $37,957 | 0 | $0 | 9 | $320,850 | 1 | $35,900 |
| APPLICATIONS DENIED | 22 | $423,958 | 92 | $372,990 | 424 | $410,566 | 38 | $190,021 | 0 | $0 | 38 | $291,131 | 1 | $11,970 |
| APPLICATIONS WITHDRAWN | 15 | $344,716 | 53 | $382,441 | 204 | $373,675 | 17 | $181,189 | 0 | $0 | 23 | $341,498 | 0 | $0 |
| FILES CLOSED FOR INCOMPLETENESS | 0 | $0 | 18 | $337,517 | 84 | $393,602 | 10 | $135,605 | 0 | $0 | 7 | $235,243 | 0 | $0 |
Detailed mortgage data for all 10 tracts in South San Francisco, CA
| Private Mortgage Insurance Companies Aggregated Statistics For Year 2009 (Based on 7 full and 2 partial tracts) | ||||
| A) Conventional Home Purchase Loans | B) Refinancings | |||
|---|---|---|---|---|
| Number | Average Value | Number | Average Value | |
| LOANS ORIGINATED | 38 | $372,767 | 4 | $453,930 |
| APPLICATIONS APPROVED, NOT ACCEPTED | 8 | $331,642 | 2 | $397,830 |
| APPLICATIONS DENIED | 7 | $451,000 | 1 | $446,340 |
| APPLICATIONS WITHDRAWN | 5 | $407,400 | 2 | $456,520 |
| FILES CLOSED FOR INCOMPLETENESS | 0 | $0 | 0 | $0 |
2005 - 2018 National Fire Incident Reporting System (NFIRS) incidents
- Fire incident types reported to NFIRS in South San Francisco, CA
- 1,09848.3%Structure Fires
- 72531.9%Outside Fires
- 38116.8%Mobile Property/Vehicle Fires
- 673.0%Other
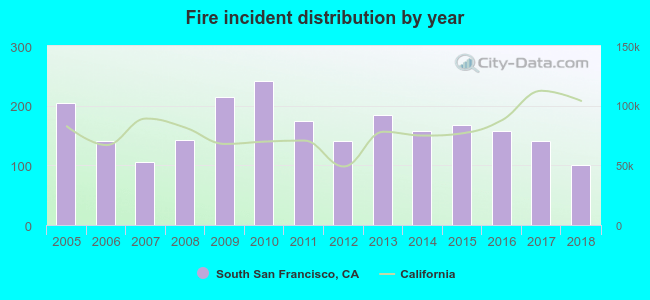 Based on the data from the years 2005 - 2018 the average number of fires per year is 162. The highest number of reported fire incidents - 241 took place in 2010, and the least - 101 in 2018. The data has a declining trend.
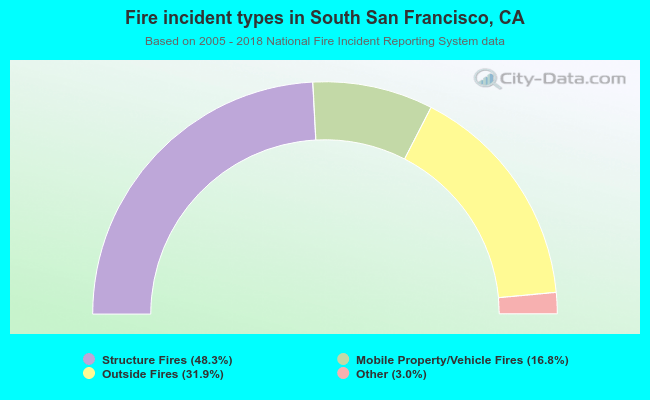 When looking into fire subcategories, the most incidents belonged to: Structure Fires (48.3%), and Outside Fires (31.9%).
Fire-safe hotels and motels in South San Francisco, California:
- Comfort Suites Sfo Airport, 121 E Grand Ave, South San Francisco, California 94080 , Phone: (650) 589-7100, Fax: (650) 589-7796
- Holiday Inn San Francisco International Airport, 275 S Airport Blvd, South San Francisco, California 94080 , Phone: (650) 873-3550, Fax: (650) 873-7101
- Embassy Suites Hotel San Francisco Airport, 250 Gateway Blvd, South San Francisco, California 94080 , Phone: (650) 589-3400, Fax: (650) 589-1183
- Days Inn, 1113 Airport Blvd, South San Francisco, California 94080 , Phone: (650) 873-9300, Fax: (650) 873-6200
- Hilton Garden Inn-South San Francisco, 670 Gateway Blvd, South San Francisco, California 94080 , Phone: (659) 872-1515, Fax: (650) 872-1064
- Inn At Oyster Point, 425 Marina Blvd, South San Francisco, California 94080 , Phone: (650) 737-7633, Fax: (650) 737-0795
- Ramada Limited, 721 Airport Blvd, South San Francisco, California 94080 , Phone: (650) 583-7300, Fax: (650) 583-7400
- Americas Best Value Inn & Suites, 701 Airport Bl, South San Francisco, California 94080 , Phone: (650) 952-2505, Fax: (650) 952-8311
- 3 other hotels and motels
| Most common first names in South San Francisco, CA among deceased individuals | ||
| Name | Count | Lived (average) |
|---|---|---|
| John | 303 | 73.3 years |
| Mary | 233 | 79.4 years |
| Robert | 197 | 68.5 years |
| William | 194 | 72.3 years |
| Joseph | 172 | 74.5 years |
| James | 145 | 69.9 years |
| George | 135 | 74.5 years |
| Maria | 121 | 79.4 years |
| Charles | 115 | 71.9 years |
| Frank | 114 | 73.5 years |
| Most common last names in South San Francisco, CA among deceased individuals | ||
| Last name | Count | Lived (average) |
|---|---|---|
| Smith | 61 | 75.1 years |
| Jones | 49 | 71.9 years |
| Brown | 43 | 73.3 years |
| Johnson | 37 | 73.4 years |
| Garcia | 36 | 75.9 years |
| Martin | 32 | 72.7 years |
| Lee | 31 | 73.6 years |
| Anderson | 30 | 74.9 years |
| Miller | 28 | 74.2 years |
| Hernandez | 27 | 64.9 years |
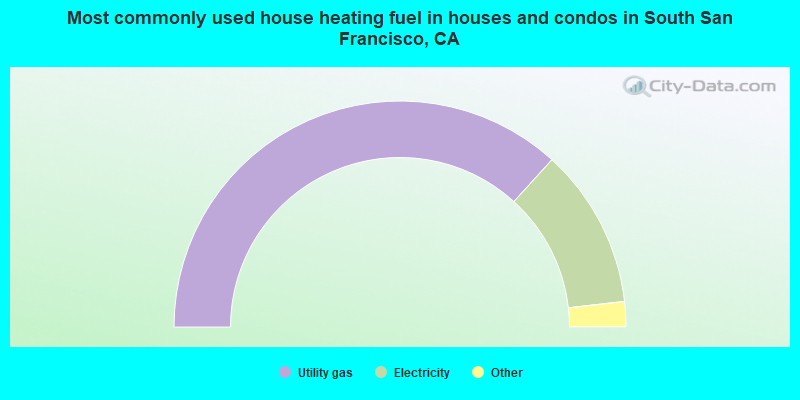
- 73.5%Utility gas
- 22.9%Electricity
- 2.2%Bottled, tank, or LP gas
- 1.2%No fuel used
- 0.1%Solar energy
- 0.1%Wood
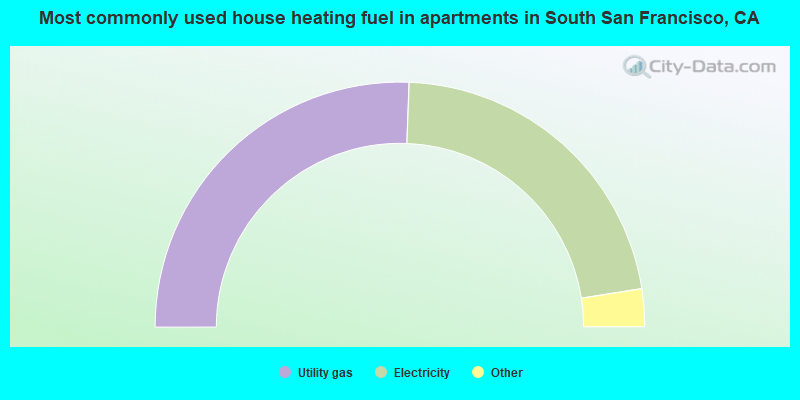
- 51.2%Utility gas
- 43.8%Electricity
- 3.2%No fuel used
- 1.1%Bottled, tank, or LP gas
- 0.6%Other fuel
- 0.1%Solar energy
South San Francisco compared to California state average:
- Median house value above state average.
- Unemployed percentage significantly below state average.
- Black race population percentage below state average.
- Median age above state average.
- Foreign-born population percentage above state average.
- Length of stay since moving in significantly above state average.
- Percentage of population with a bachelor's degree or higher above state average.
South San Francisco on our top lists:
- #6 on the list of "Top 101 cities with largest percentage of males in industries: transportation and warehousing (population 50,000+)"
- #7 on the list of "Top 101 cities with largest percentage of males in occupations: fire fighting and prevention workers including supervisors (population 50,000+)"
- #15 on the list of "Top 101 cities with largest percentage of males in industries: other services, except public administration (population 50,000+)"
- #25 on the list of "Top 101 cities with the smallest temperature differences during a year (population 50,000+)"
- #25 on the list of "Top 101 cities with the largest differences between morning and afternoon humidity (population 50,000+)"
- #25 on the list of "Top 101 cities with the largest humidity differences during a year (population 50,000+)"
- #26 on the list of "Top 101 cities with the largest percentage of elementary and middle school students in private schools (5,000+ students)"
- #27 on the list of "Top 101 cities with the most cars per house, population 50,000+"
- #28 on the list of "Top 101 cities with the most residents born in Hong Kong (population 500+)"
- #29 on the list of "Top 101 cities with largest percentage of males in occupations: healthcare support occupations (population 50,000+)"
- #31 on the list of "Top 101 cities with largest percentage of females in industries: transportation and warehousing (population 50,000+)"
- #31 on the list of "Top 101 cities with the largest percentage of high school students in private schools (3,000+ students)"
- #39 on the list of "Top 100 cities with highest percentage of foreign-born residents (pop. 50,000+)"
- #41 on the list of "Top 101 cities with the lowest number of murders per 100,000 residents (population 50,000+)"
- #41 on the list of "Top 100 low-educated but high-earning cities (pop. 50,000+)"
- #49 on the list of "Top 101 cities with largest percentage of females in occupations: fire fighting and prevention workers including supervisors (population 50,000+)"
- #56 on the list of "Top 101 cities with the most residents born in Nicaragua (population 500+)"
- #57 on the list of "Top 101 cities with the most residents born in Other Eastern Asia (population 500+)"
- #57 on the list of "Top 100 cities with highest median house value (pop. 50,000+)"
- #58 on the list of "Top 101 cities with the most residents born in Philippines (population 500+)"
- #98 (94080) on the list of "Top 101 zip codes with the most hotels or motels in 2005"
- #6 on the list of "Top 101 counties with the highest percentage of residents that exercised in the past month"
- #8 on the list of "Top 101 counties with the highest percentage of residents that drank alcohol in the past 30 days"
- #9 on the list of "Top 101 counties with the lowest Ozone (1-hour) air pollution readings in 2012 (ppm)"
- #10 on the list of "Top 101 counties with the highest carbon monoxide air pollution readings in 2012 (ppm)"
- #11 on the list of "Top 101 counties with the lowest average weight of females"

|
|
Total of 1665 patent applications in 2008-2024.