Races in Corpus Christi, Texas (TX) Detailed Stats
Data:
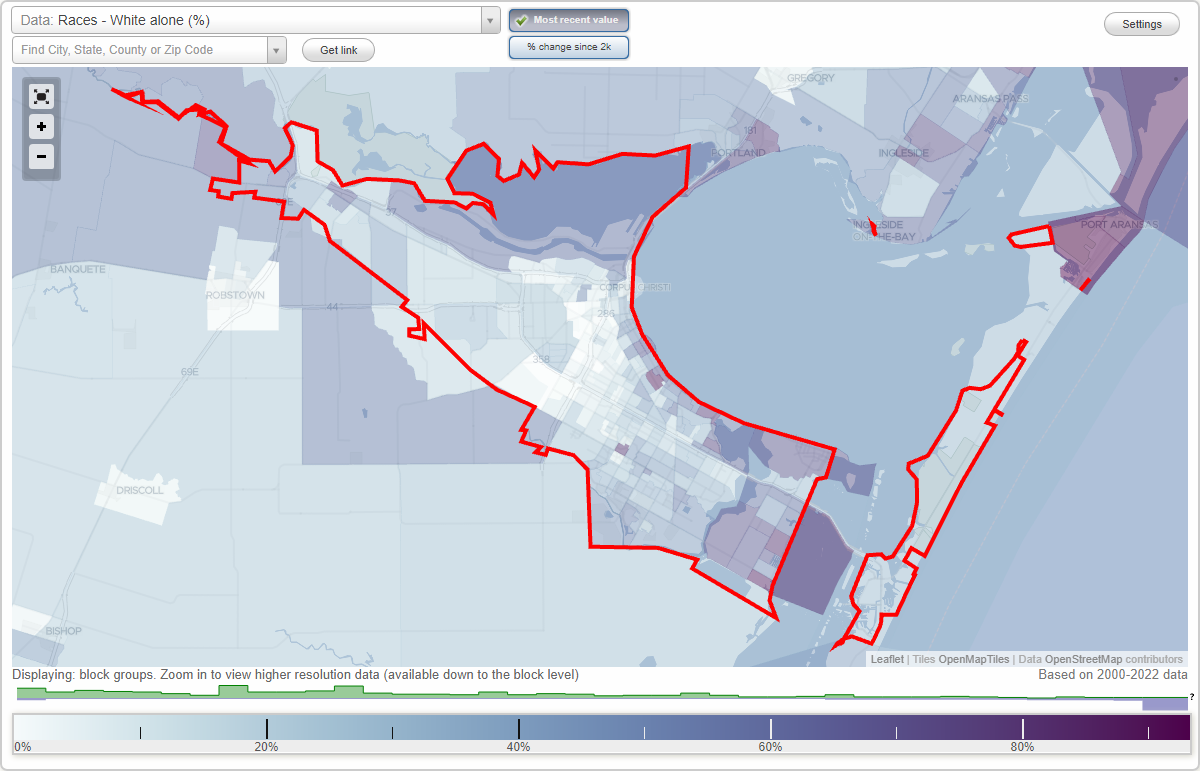
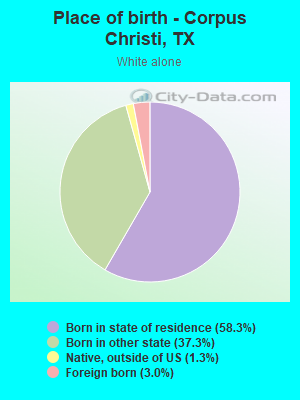
Races - White alone (%)
Races - White alone (% change since 2000)
Races - Black alone (%)
Races - Black alone (% change since 2000)
Races - American Indian alone (%)
Races - American Indian alone (% change since 2000)
Races - Asian alone (%)
Races - Asian alone (% change since 2000)
Races - Hispanic (%)
Races - Hispanic (% change since 2000)
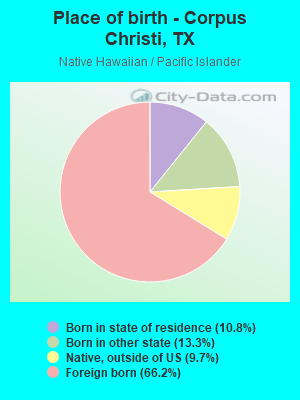
Races - Native Hawaiian and Other Pacific Islander alone (%)
Races - Native Hawaiian and Other Pacific Islander alone (% change since 2000)
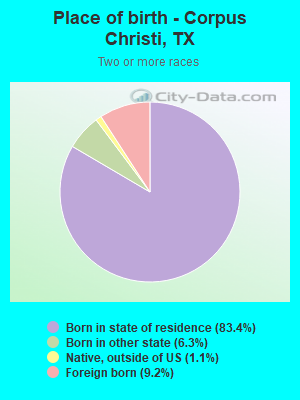
Races - Two or more races(%)
Races - Two or more races(% change since 2000)
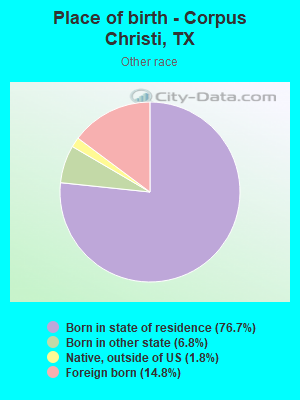
Races - Other race alone (%)
Races - Other race alone (% change since 2000)
Racial diversity
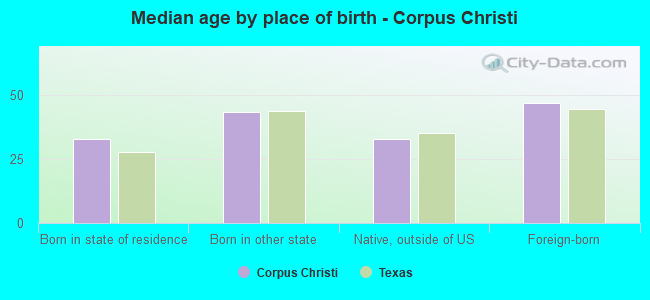
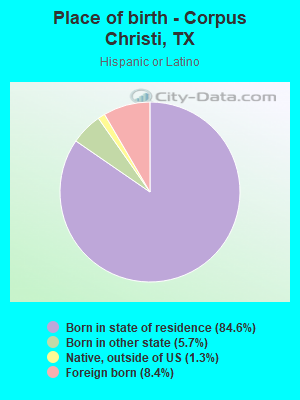
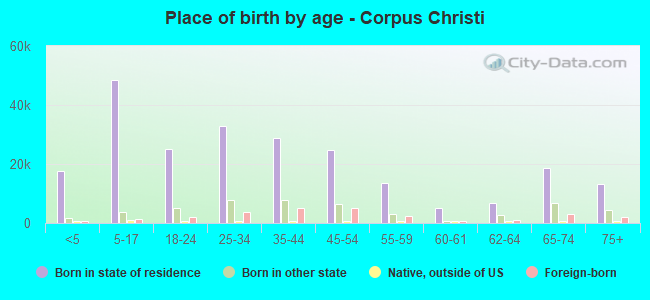
Place of birth - Born in state of residence (%)
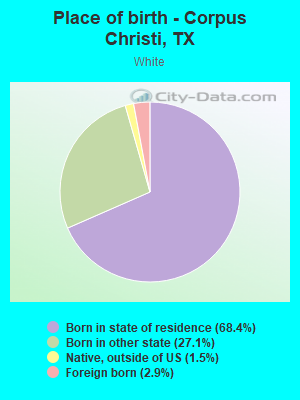
Place of birth - Born in state of residence (%) - White
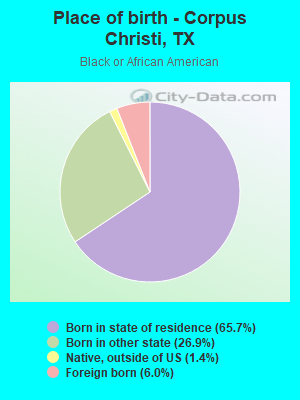
Place of birth - Born in state of residence (%) - Black or African American
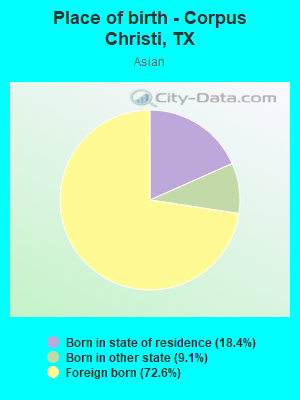
Place of birth - Born in state of residence (%) - Asian
Place of birth - Born in state of residence (%) - Hispanic or Latino
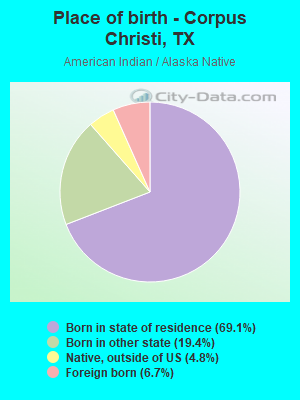
Place of birth - Born in state of residence (%) - American Indian and Alaska Native
Place of birth - Born in state of residence (%) - Multirace
Place of birth - Born in state of residence (%) - Other Race
Place of birth - Born in other state (%)
Place of birth - Born in other state (%) - White
Place of birth - Born in other state (%) - Black or African American
Place of birth - Born in other state (%) - Asian
Place of birth - Born in other state (%) - Hispanic or Latino
Place of birth - Born in other state (%) - American Indian and Alaska Native
Place of birth - Born in other state (%) - Multirace
Place of birth - Born in other state (%) - Other Race
Place of birth - Native, outside of US (%)
Place of birth - Native, outside of US (%) - White
Place of birth - Native, outside of US (%) - Black or African American
Place of birth - Native, outside of US (%) - Asian
Place of birth - Native, outside of US (%) - Hispanic or Latino
Place of birth - Native, outside of US (%) - American Indian and Alaska Native
Place of birth - Native, outside of US (%) - Multirace
Place of birth - Native, outside of US (%) - Other Race
Place of birth - Foreign born (%)
Place of birth - Foreign born (%) - White
Place of birth - Foreign born (%) - Black or African American
Place of birth - Foreign born (%) - Asian
Place of birth - Foreign born (%) - Hispanic or Latino
Place of birth - Foreign born (%) - American Indian and Alaska Native
Place of birth - Foreign born (%) - Multirace
Place of birth - Foreign born (%) - Other Race
Residents speaking English at home (%)
Residents speaking English at home - Born in the United States (%)
Residents speaking English at home - Native, born elsewhere (%)
Residents speaking English at home - Foreign born (%)
Residents speaking Spanish at home (%)
Residents speaking Spanish at home - Born in the United States (%)
Residents speaking Spanish at home - Native, born elsewhere (%)
Residents speaking Spanish at home - Foreign born (%)
Residents speaking other language at home (%)
Residents speaking other language at home - Born in the United States (%)
Residents speaking other language at home - Native, born elsewhere (%)
Residents speaking other language at home - Foreign born (%)
Marital status - Never married (%)
Marital status - Now married (%)
Marital status - Separated (%)
Marital status - Widowed (%)
Marital status - Divorced (%)
Ancestries Reported - Arab (%)
Ancestries Reported - Czech (%)
Ancestries Reported - Danish (%)
Ancestries Reported - Dutch (%)
Ancestries Reported - English (%)
Ancestries Reported - French (%)
Ancestries Reported - French Canadian (%)
Ancestries Reported - German (%)
Ancestries Reported - Greek (%)
Ancestries Reported - Hungarian (%)
Ancestries Reported - Irish (%)
Ancestries Reported - Italian (%)
Ancestries Reported - Lithuanian (%)
Ancestries Reported - Norwegian (%)
Ancestries Reported - Polish (%)
Ancestries Reported - Portuguese (%)
Ancestries Reported - Russian (%)
Ancestries Reported - Scotch-Irish (%)
Ancestries Reported - Scottish (%)
Ancestries Reported - Slovak (%)
Ancestries Reported - Subsaharan African (%)
Ancestries Reported - Swedish (%)
Ancestries Reported - Swiss (%)
Ancestries Reported - Ukrainian (%)
Ancestries Reported - United States (%)
Ancestries Reported - Welsh (%)
Ancestries Reported - West Indian (%)
Ancestries Reported - Other (%)
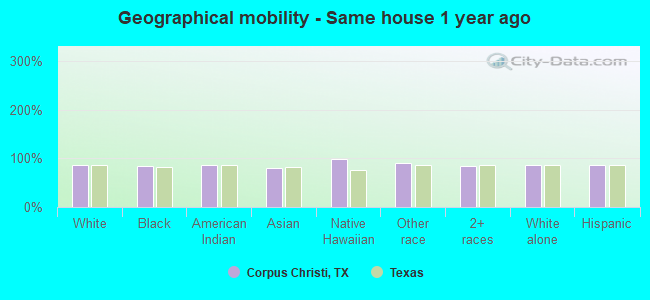
Geographical mobility - Same house 1 year ago (%)
Geographical mobility - Same house 1 year ago (%) - White
Geographical mobility - Same house 1 year ago (%) - Black or African American
Geographical mobility - Same house 1 year ago (%) - Asian
Geographical mobility - Same house 1 year ago (%) - Hispanic or Latino
Geographical mobility - Same house 1 year ago (%) - American Indian and Alaska Native
Geographical mobility - Same house 1 year ago (%) - Multirace
Geographical mobility - Same house 1 year ago (%) - Other Race
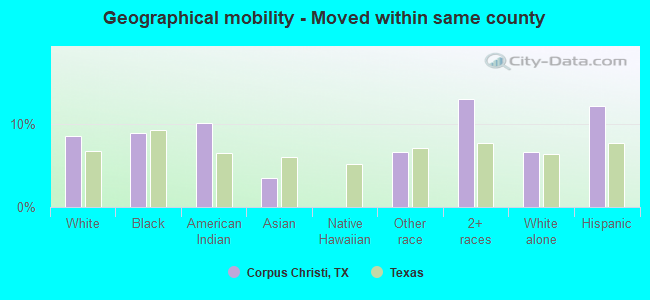
Geographical mobility - Moved within same county (%)
Geographical mobility - Moved within same county (%) - White
Geographical mobility - Moved within same county (%) - Black or African American
Geographical mobility - Moved within same county (%) - Asian
Geographical mobility - Moved within same county (%) - Hispanic or Latino
Geographical mobility - Moved within same county (%) - American Indian and Alaska Native
Geographical mobility - Moved within same county (%) - Multirace
Geographical mobility - Moved within same county (%) - Other Race
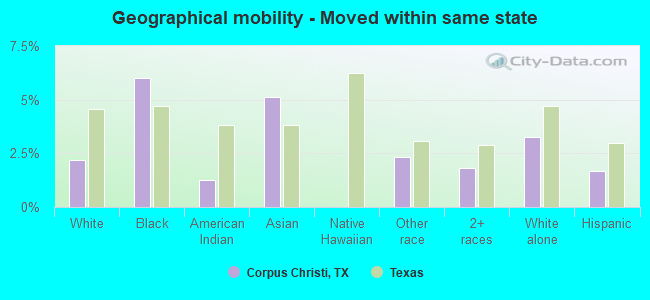
Geographical mobility - Moved from different county within same state (%)
Geographical mobility - Moved from different county within same state (%) - White
Geographical mobility - Moved from different county within same state (%) - Black or African American
Geographical mobility - Moved from different county within same state (%) - Asian
Geographical mobility - Moved from different county within same state (%) - Hispanic or Latino
Geographical mobility - Moved from different county within same state (%) - American Indian and Alaska Native
Geographical mobility - Moved from different county within same state (%) - Multirace
Geographical mobility - Moved from different county within same state (%) - Other Race
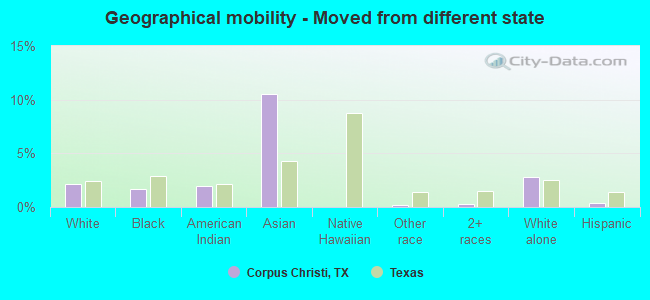
Geographical mobility - Moved from different state (%)
Geographical mobility - Moved from different state (%) - White
Geographical mobility - Moved from different state (%) - Black or African American
Geographical mobility - Moved from different state (%) - Asian
Geographical mobility - Moved from different state (%) - Hispanic or Latino
Geographical mobility - Moved from different state (%) - American Indian and Alaska Native
Geographical mobility - Moved from different state (%) - Multirace
Geographical mobility - Moved from different state (%) - Other Race
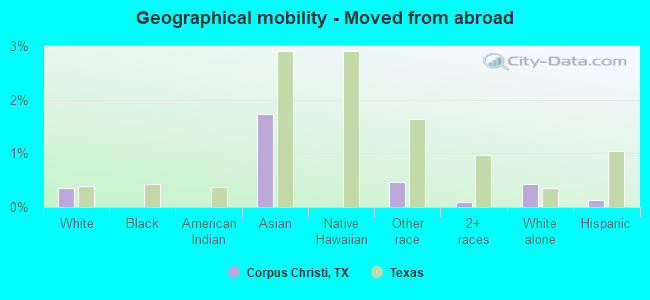
Geographical mobility - Moved from abroad (%)
Geographical mobility - Moved from abroad (%) - White
Geographical mobility - Moved from abroad (%) - Black or African American
Geographical mobility - Moved from abroad (%) - Asian
Geographical mobility - Moved from abroad (%) - Hispanic or Latino
Geographical mobility - Moved from abroad (%) - American Indian and Alaska Native
Geographical mobility - Moved from abroad (%) - Multirace
Geographical mobility - Moved from abroad (%) - Other Race
Place of birth for the foreign-born population - Ireland (%)
Place of birth for the foreign-born population - Denmark (%)
Place of birth for the foreign-born population - Norway (%)
Place of birth for the foreign-born population - Sweden (%)
Place of birth for the foreign-born population - United Kingdom (%)
Place of birth for the foreign-born population - England (%)
Place of birth for the foreign-born population - Scotland (%)
Place of birth for the foreign-born population - Other Northern Europe (%)
Place of birth for the foreign-born population - Austria (%)
Place of birth for the foreign-born population - Belgium (%)
Place of birth for the foreign-born population - France (%)
Place of birth for the foreign-born population - Germany (%)
Place of birth for the foreign-born population - Netherlands (%)
Place of birth for the foreign-born population - Switzerland (%)
Place of birth for the foreign-born population - Other Western Europe (%)
Place of birth for the foreign-born population - Greece (%)
Place of birth for the foreign-born population - Italy (%)
Place of birth for the foreign-born population - Portugal (%)
Place of birth for the foreign-born population - Spain (%)
Place of birth for the foreign-born population - Other Southern Europe (%)
Place of birth for the foreign-born population - Albania (%)
Place of birth for the foreign-born population - Belarus (%)
Place of birth for the foreign-born population - Bosnia and Herzegovina (%)
Place of birth for the foreign-born population - Bulgaria (%)
Place of birth for the foreign-born population - Croatia (%)
Place of birth for the foreign-born population - Czechoslovakia (%)
Place of birth for the foreign-born population - Hungary (%)
Place of birth for the foreign-born population - Latvia (%)
Place of birth for the foreign-born population - Lithuania (%)
Place of birth for the foreign-born population - North Macedonia (Macedonia) (%)
Place of birth for the foreign-born population - Moldova (%)
Place of birth for the foreign-born population - Poland (%)
Place of birth for the foreign-born population - Romania (%)
Place of birth for the foreign-born population - Russia (%)
Place of birth for the foreign-born population - Serbia (%)
Place of birth for the foreign-born population - Ukraine (%)
Place of birth for the foreign-born population - Other Eastern Europe (%)
Place of birth for the foreign-born population - China (%)
Place of birth for the foreign-born population - Hong Kong (%)
Place of birth for the foreign-born population - Taiwan (%)
Place of birth for the foreign-born population - Japan (%)
Place of birth for the foreign-born population - Korea (%)
Place of birth for the foreign-born population - Other Eastern Asia (%)
Place of birth for the foreign-born population - Afghanistan (%)
Place of birth for the foreign-born population - Bangladesh (%)
Place of birth for the foreign-born population - India (%)
Place of birth for the foreign-born population - Iran (%)
Place of birth for the foreign-born population - Kazakhstan (%)
Place of birth for the foreign-born population - Nepal (%)
Place of birth for the foreign-born population - Pakistan (%)
Place of birth for the foreign-born population - Sri Lanka (%)
Place of birth for the foreign-born population - Uzbekistan (%)
Place of birth for the foreign-born population - Other South Central Asia (%)
Place of birth for the foreign-born population - Burma (%)
Place of birth for the foreign-born population - Cambodia (%)
Place of birth for the foreign-born population - Indonesia (%)
Place of birth for the foreign-born population - Laos (%)
Place of birth for the foreign-born population - Malaysia (%)
Place of birth for the foreign-born population - Philippines (%)
Place of birth for the foreign-born population - Singapore (%)
Place of birth for the foreign-born population - Thailand (%)
Place of birth for the foreign-born population - Vietnam (%)
Place of birth for the foreign-born population - Other South Eastern Asia (%)
Place of birth for the foreign-born population - Armenia (%)
Place of birth for the foreign-born population - Iraq (%)
Place of birth for the foreign-born population - Israel (%)
Place of birth for the foreign-born population - Jordan (%)
Place of birth for the foreign-born population - Kuwait (%)
Place of birth for the foreign-born population - Lebanon (%)
Place of birth for the foreign-born population - Saudi Arabia (%)
Place of birth for the foreign-born population - Syria (%)
Place of birth for the foreign-born population - Turkey (%)
Place of birth for the foreign-born population - Yemen (%)
Place of birth for the foreign-born population - Other Western Asia (%)
Place of birth for the foreign-born population - Eritrea (%)
Place of birth for the foreign-born population - Ethiopia (%)
Place of birth for the foreign-born population - Kenya (%)
Place of birth for the foreign-born population - Somalia (%)
Place of birth for the foreign-born population - Uganda (%)
Place of birth for the foreign-born population - Zimbabwe (%)
Place of birth for the foreign-born population - Other Eastern Africa (%)
Place of birth for the foreign-born population - Cameroon (%)
Place of birth for the foreign-born population - Congo (%)
Place of birth for the foreign-born population - Democratic Republic of Congo (Zaire) (%)
Place of birth for the foreign-born population - Other Middle Africa (%)
Place of birth for the foreign-born population - Egypt (%)
Place of birth for the foreign-born population - Morocco (%)
Place of birth for the foreign-born population - Sudan (%)
Place of birth for the foreign-born population - Other Northern Africa (%)
Place of birth for the foreign-born population - South Africa (%)
Place of birth for the foreign-born population - Other Southern Africa (%)
Place of birth for the foreign-born population - Cabo Verde (%)
Place of birth for the foreign-born population - Ghana (%)
Place of birth for the foreign-born population - Liberia (%)
Place of birth for the foreign-born population - Nigeria (%)
Place of birth for the foreign-born population - Senegal (%)
Place of birth for the foreign-born population - Sierra Leone (%)
Place of birth for the foreign-born population - Other Western Africa (%)
Place of birth for the foreign-born population - Australia (%)
Place of birth for the foreign-born population - New Zealand (%)
Place of birth for the foreign-born population - Fiji (%)
Place of birth for the foreign-born population - Micronesia (%)
Place of birth for the foreign-born population - Bahamas (%)
Place of birth for the foreign-born population - Barbados (%)
Place of birth for the foreign-born population - Cuba (%)
Place of birth for the foreign-born population - Dominica (%)
Place of birth for the foreign-born population - Dominican Republic (%)
Place of birth for the foreign-born population - Grenada (%)
Place of birth for the foreign-born population - Haiti (%)
Place of birth for the foreign-born population - Jamaica (%)
Place of birth for the foreign-born population - St. Vincent and the Grenadines (%)
Place of birth for the foreign-born population - Trinidad and Tobago (%)
Place of birth for the foreign-born population - West Indies (%)
Place of birth for the foreign-born population - Other Caribbean (%)
Place of birth for the foreign-born population - Belize (%)
Place of birth for the foreign-born population - Costa Rica (%)
Place of birth for the foreign-born population - El Salvador (%)
Place of birth for the foreign-born population - Guatemala (%)
Place of birth for the foreign-born population - Honduras (%)
Place of birth for the foreign-born population - Mexico (%)
Place of birth for the foreign-born population - Nicaragua (%)
Place of birth for the foreign-born population - Panama (%)
Place of birth for the foreign-born population - Other Central America (%)
Place of birth for the foreign-born population - Argentina (%)
Place of birth for the foreign-born population - Bolivia (%)
Place of birth for the foreign-born population - Brazil (%)
Place of birth for the foreign-born population - Chile (%)
Place of birth for the foreign-born population - Colombia (%)
Place of birth for the foreign-born population - Ecuador (%)
Place of birth for the foreign-born population - Guyana (%)
Place of birth for the foreign-born population - Peru (%)
Place of birth for the foreign-born population - Uruguay (%)
Place of birth for the foreign-born population - Venezuela (%)
Place of birth for the foreign-born population - Other South America (%)
Place of birth for the foreign-born population - Canada (%)
Place of birth for the foreign-born population - Other Northern America (%)
Place of birth for the foreign-born population - Other (%)
According to 2022 data, the most numerous races in Corpus Christi, TX are Hispanic (204,622 residents), White alone (86,182 residents), and Black alone (11,532 residents). 66.7% of Corpus Christi residents speak English at home. 9.6% of Corpus Christi, TX residents are foreign-born (6.6% born in Latin America, 1.8% born in Asia), which is 77.2% less than the foreign-born rate of 17.0% across the entire state of Texas.
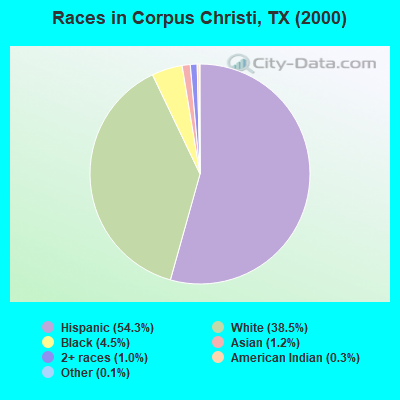
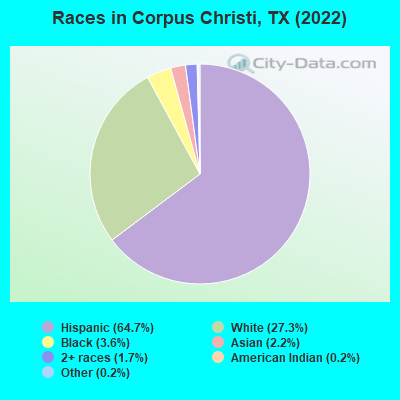
Race distribution in Corpus Christi
2000 2022
150,737 54.3% Hispanic 106,901 38.5% White alone 12,404 4.5% Black alone 3,382 1.2% Asian alone 2,787 1.0% Two or more races 822 0.3% American Indian alone 296 0.1% Other race alone 125 0.05% Native Hawaiian and Other
204,622 64.7% Hispanic 86,182 27.3% White alone 11,532 3.6% Black alone 6,895 2.2% Asian alone 5,274 1.7% Two or more races 698 0.2% Other race alone 772 0.2% American Indian alone 253 0.08% Native Hawaiian and Other
2000 2022
10,933,313 52.4% White alone 6,669,666 32.0% Hispanic 2,364,255 11.3% Black alone 554,445 2.7% Asian alone 230,567 1.1% Two or more races 68,859 0.3% American Indian alone 19,958 0.10% Other race alone 10,757 0.05% Native Hawaiian and Other
12,070,642 40.2% Hispanic 11,683,430 38.9% White alone 3,508,706 11.7% Black alone 1,608,173 5.4% Asian alone 956,560 3.2% Two or more races 125,763 0.4% Other race alone 47,023 0.2% American Indian alone 29,275 0.10% Native Hawaiian and Other
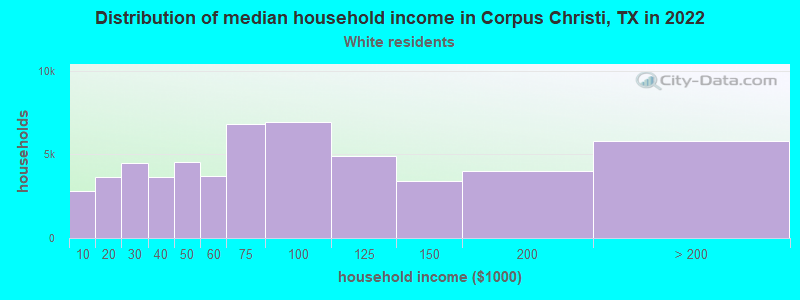
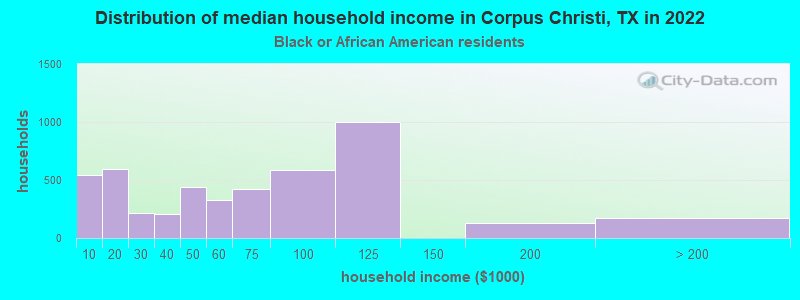
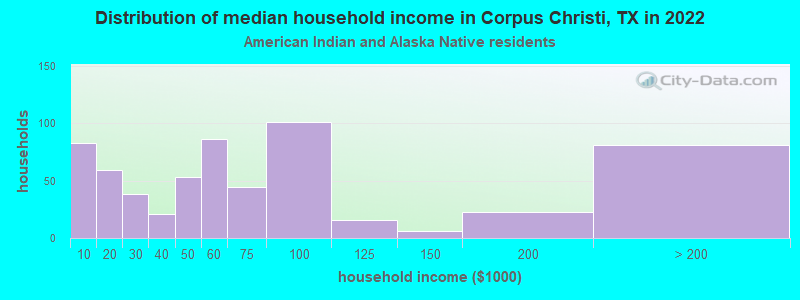
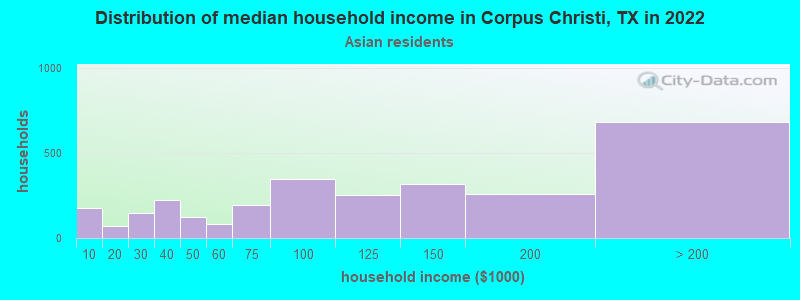
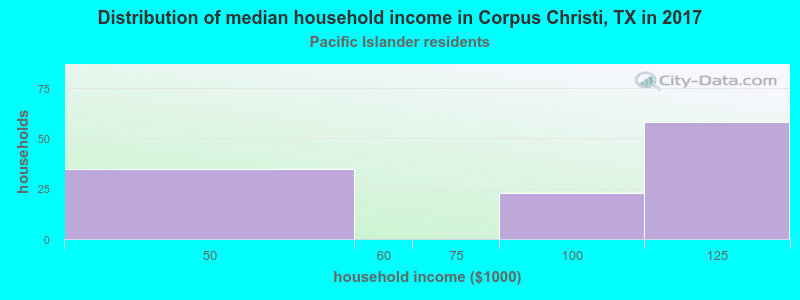
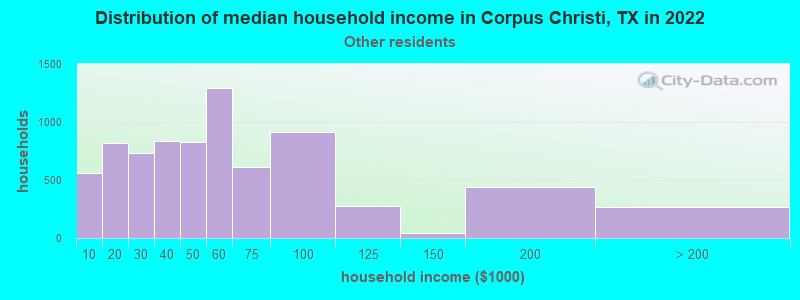
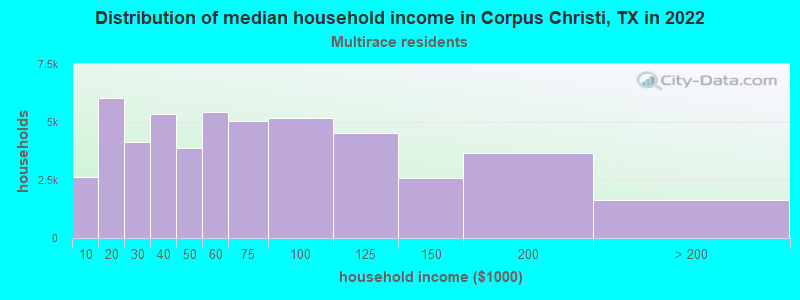
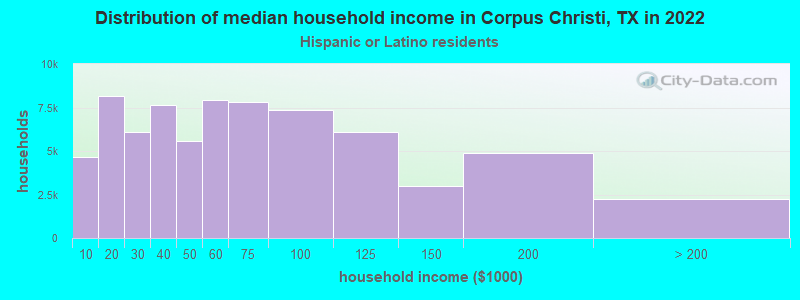
Income and house value in Corpus Christi Median household income in 2022 $78,388 White non-Hispanic householders$59,167 Black householders$55,591 American Indian and Alaska Native householders$86,802 Asian householders$50,209 Some other race householders$54,947 Two or more races householders$53,962 Hispanic or Latino race householdersMedian 2022 house value $253,658 White Non-Hispanic householders$170,472 Black or African American householders$237,255 American Indian or Alaska Native householders $340,651 Asian householders$532,799 Native Hawaiian and other Pacific Islander householders$157,291 Some other race householders$170,472 Two or more races householders$161,392 Hispanic or Latino householders
Median age by race in Corpus Christi
39.1 Median age for White residents38.0 40.2 30.7 Median age for Black or African American residents28.0 33.0 40.0 Median age for American Indian / Alaska Native residents45.2 35.7 44.2 Median age for Asian residents43.8 45.3 67.6 Median age for Native Hawaiian / Pacific Islander residents-666,666,666.0 67.7 34.8 Median age for Other race residents35.2 34.7 34.5 Median age for Two or more races residents32.7 36.8 43.8 Median age for White alone residents41.9 45.3 33.5 Median age for Hispanic or Latino residents32.2 34.9
Owner/renter occupied households by race in Corpus Christi
House owners and renters - White residents 34,484 63.1% Owner occupied20,209 36.9% Renter occupiedHouse owners and renters - Black or African American residents 2,212 47.8% Owner occupied2,420 52.2% Renter occupiedHouse owners and renters - American Indian / Alaska Native residents 297 44.1% Owner occupied377 55.9% Renter occupiedHouse owners and renters - Asian residents 1,430 59.4% Owner occupied976 40.6% Renter occupiedHouse owners and renters - Native Hawaiian / Pacific Islander residents 54 57.4% Owner occupied40 42.6% Renter occupiedHouse owners and renters - Other race residents 4,360 57.2% Owner occupied3,267 42.8% Renter occupiedHouse owners and renters - Two or more races residents 27,270 54.5% Owner occupied22,809 45.5% Renter occupiedHouse owners and renters - White alone residents 25,827 64.6% Owner occupied14,165 35.4% Renter occupiedHouse owners and renters - Hispanic or Latino residents 39,131 54.8% Owner occupied32,314 45.2% Renter occupied
Language usage in Corpus Christi
English speakers - Total 66.7% of residents of Corpus Christi speak English at home.
30.3% of residents speak Spanish at home 70,848 78.7% Speak English very well19,136 21.3% Speak English less than very well3.0% of residents speak other language at home 6,158 69.9% Speak English very well2,655 30.1% Speak English less than very well
English speakers - Born in the United States 85.9% of residents of Corpus Christi speak English at home.
12.0% of residents speak Spanish at home 5,147 86.9% Speak English very well773 13.1% Speak English less than very well2.1% of residents speak other language at home 916 90.2% Speak English very well99 9.8% Speak English less than very well
English speakers - Native, born elsewhere 62.2% of residents of Corpus Christi speak English at home.
32.4% of residents speak Spanish at home 858 65.2% Speak English very well458 34.8% Speak English less than very well5.3% of residents speak other language at home 125 57.9% Speak English very well91 42.1% Speak English less than very well
English speakers - Foreign-born 19.0% of residents of Corpus Christi speak English at home.
56.0% of residents speak Spanish at home 5,773 39.7% Speak English very well8,763 60.3% Speak English less than very well25.0% of residents speak other language at home 4,100 63.3% Speak English very well2,380 36.7% Speak English less than very well
White (Caucasian) - Speak only English Native:
84.7% (100,366)Foreign-born:
30.6% (1,174)
White (Caucasian) - Speak another language Native:
15.3% (18,108)Foreign-born:
69.4% (2,666)
Black or African American - Speak only English Native:
96.5% (10,849)Foreign-born:
40.8% (260)
Black or African American - Speak another language Native:
3.5% (388)Foreign-born:
57.8% (368)
American Indian / Alaska Native - Speak another language Native:
45.1% (539)Foreign-born:
98.9% (88)
Asian - Speak only English Native:
57.7% (1,116)Foreign-born:
15.0% (767)
Asian - Speak another language Native:
42.3% (818)Foreign-born:
85.0% (4,354)
Native Hawaiian / Pacific Islander - Speak only English Native:
47.4% (45)Foreign-born:
48.2% (89)
Native Hawaiian / Pacific Islander - Speak another language Native:
53.9% (51)Foreign-born:
7.5% (14)
Other race - Speak only English Native:
51.6% (9,366)Foreign-born:
2.1% (68)
Other race - Speak another language Native:
48.4% (8,799)Foreign-born:
97.9% (3,164)
Two or more races - Speak only English Native:
59.2% (70,126)Foreign-born:
21.6% (2,750)
Two or more races - Speak another language Native:
40.8% (48,418)Foreign-born:
78.4% (9,991)
White alone - Speak only English Native:
96.1% (75,968)Foreign-born:
45.8% (1,174)
White alone - Speak another language Native:
3.9% (3,073)Foreign-born:
54.2% (1,387)
Hispanic or Latino - Speak only English Native:
58.2% (101,459)Foreign-born:
15.9% (2,738)
Hispanic or Latino - Speak another language Native:
41.8% (72,755)Foreign-born:
84.1% (14,490)
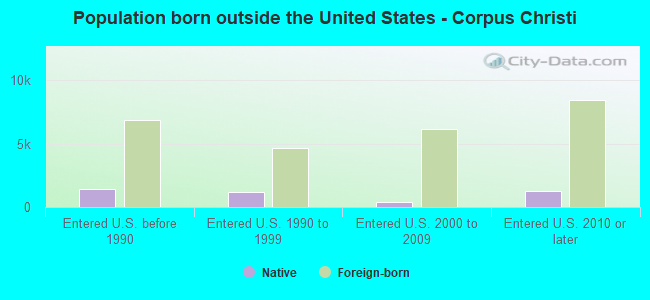
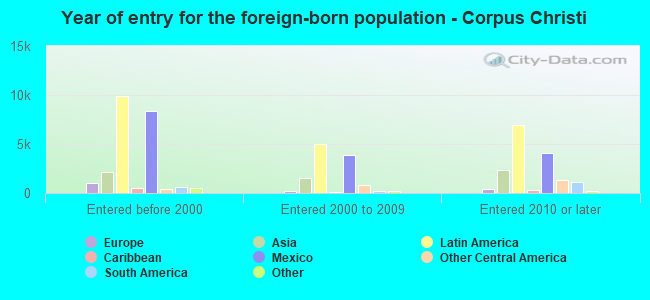
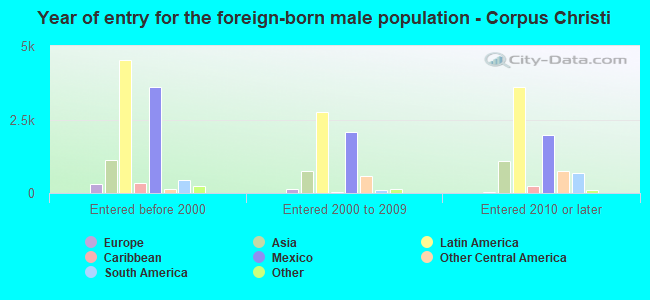
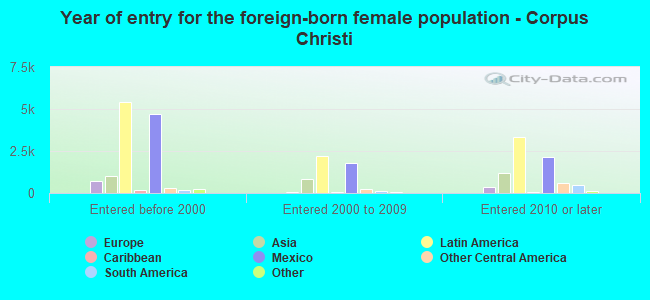
Foreign-born residents in Corpus Christi 30,351 residents are foreign born (6.6% Latin America , 1.8% Asia ).
This city:
9.6%Texas:
17.1%
Marital status for residents in Corpus Christi Marital status - White (Caucasian) population 15 years and over
Males 35.8% Never married50.6% Now married0.9% Separated3.4% Widowed9.3% DivorcedFemales 27.3% Never married49.3% Now married2.2% Separated9.1% Widowed12.1% DivorcedWomen who gave birth in the past 12 months Now married:
66.9% (1,023)Unmarried:
33.1% (507)
Women who did not give birth in the past 12 months Now married:
48.2% (13,676)Unmarried:
51.8% (14,699)
Marital status - Black or African American population 15 years and over
Males 49.0% Never married34.1% Now married4.0% Separated1.7% Widowed11.2% DivorcedFemales 40.0% Never married50.9% Now married0.0% Separated1.6% Widowed7.5% DivorcedWomen who gave birth in the past 12 months Now married:
94.1% (827)Unmarried:
5.9% (52)
Women who did not give birth in the past 12 months Now married:
37.2% (1,054)Unmarried:
62.8% (1,776)
Marital status - American Indian / Alaska Native population 15 years and over
Males 40.8% Never married45.5% Now married0.0% Separated6.6% Widowed7.1% DivorcedFemales 40.3% Never married34.4% Now married0.0% Separated13.9% Widowed11.4% DivorcedWomen who gave birth in the past 12 months Now married:
100.0% (34)Unmarried:
0.0% (0)
Women who did not give birth in the past 12 months Now married:
29.7% (99)Unmarried:
70.3% (234)
Marital status - Asian population 15 years and over
Males 44.9% Never married55.1% Now married0.0% Separated0.0% Widowed0.0% DivorcedFemales 33.6% Never married50.7% Now married0.0% Separated9.8% Widowed5.8% DivorcedWomen who gave birth in the past 12 months Now married:
67.5% (108)Unmarried:
32.5% (52)
Women who did not give birth in the past 12 months Now married:
55.3% (1,147)Unmarried:
44.7% (925)
Marital status - Native Hawaiian / Pacific Islander population 15 years and over
Males 85.4% Never married14.6% Now married0.0% Separated0.0% Widowed0.0% DivorcedFemales 0.0% Never married44.8% Now married0.0% Separated0.0% Widowed55.2% DivorcedMarital status - Other race population 15 years and over
Males 47.1% Never married37.4% Now married1.6% Separated2.4% Widowed11.5% DivorcedFemales 31.3% Never married45.7% Now married4.8% Separated8.8% Widowed9.4% DivorcedWomen who gave birth in the past 12 months Now married:
100.0% (100)Unmarried:
0.0% (0)
Women who did not give birth in the past 12 months Now married:
49.2% (2,428)Unmarried:
50.8% (2,504)
Marital status - Two or more races population 15 years and over
Males 41.9% Never married44.8% Now married1.9% Separated2.1% Widowed9.3% DivorcedFemales 38.7% Never married37.5% Now married2.9% Separated8.8% Widowed12.0% DivorcedWomen who gave birth in the past 12 months Now married:
39.8% (1,098)Unmarried:
60.2% (1,662)
Women who did not give birth in the past 12 months Now married:
31.7% (9,705)Unmarried:
68.3% (20,918)
Marital status - White alone, not Hispanic / Latino population 15 years and over
Males 30.3% Never married55.8% Now married1.3% Separated2.5% Widowed10.1% DivorcedFemales 23.0% Never married50.1% Now married2.8% Separated9.7% Widowed14.4% DivorcedWomen who gave birth in the past 12 months Now married:
90.2% (597)Unmarried:
9.8% (65)
Women who did not give birth in the past 12 months Now married:
49.2% (8,305)Unmarried:
50.8% (8,583)
Marital status - Hispanic or Latino population 15 years and over
Males 44.1% Never married42.6% Now married1.5% Separated2.8% Widowed9.0% DivorcedFemales 37.9% Never married40.9% Now married2.7% Separated8.5% Widowed10.0% DivorcedWomen who gave birth in the past 12 months Now married:
57.3% (2,351)Unmarried:
42.7% (1,752)
Women who did not give birth in the past 12 months Now married:
37.0% (17,381)Unmarried:
63.0% (29,655)
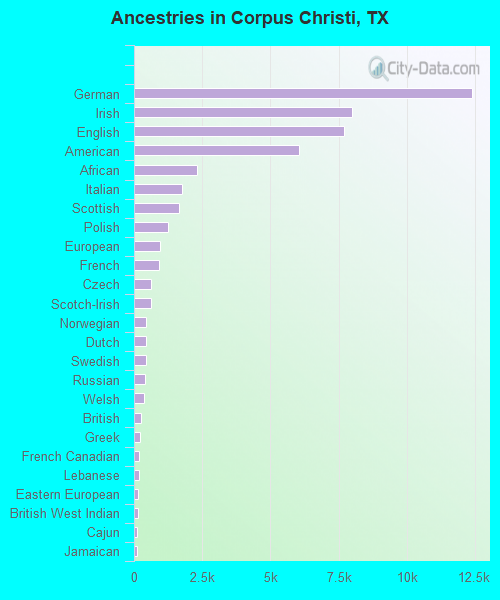
Ancestries in Corpus Christi
12,386 5.3% German7,973 3.4% Irish7,686 3.3% English6,047 2.6% American2,326 1.0% African1,743 0.7% Italian1,631 0.7% Scottish1,262 0.5% Polish941 0.4% European927 0.4% French613 0.3% Czech612 0.3% Scotch-Irish451 0.2% Norwegian446 0.2% Dutch439 0.2% Swedish395 0.2% Russian366 0.2% Welsh245 0.1% British224 0.10% Greek179 0.08% French Canadian166 0.07% Lebanese143 0.06% Eastern European138 0.06% British West Indian125 0.05% Cajun115 0.05% Jamaican114 0.05% Canadian110 0.05% Palestinian108 0.05% Iranian101 0.04% Czechoslovakian101 0.04% Turkish100 0.04% Hungarian90 0.04% Danish77 0.03% Nigerian74 0.03% Portuguese73 0.03% Armenian62 0.03% Romanian59 0.03% Barbadian58 0.02% Austrian54 0.02% Scandinavian54 0.02% Slovak51 0.02% Finnish46 0.02% Brazilian40 0.02% Swiss36 0.02% Ukrainian31 0.01% Lithuanian23 0.01% Syrian22 0.01% Serbian21 0.01% Slavic21 0.01% Haitian19 0.01% Pennsylvania German17 0.01% Bulgarian17 0.01% Ugandan14 0.01% Northern European14 0.01% Croatian12 0.01% Latvian12 0.01% Egyptian12 0.01% Zimbabwean12 0.01% Yugoslavian
Geographical mobility in Corpus Christi Same house 1 year ago 112,508 86.7% White (Caucasian)11,510 83.4% Black or African American1,212 86.6% American Indian / Alaska Native6,633 80.5% Asian286 98.2% Native Hawaiian / Pacific Islander19,757 90.4% Other race116,772 84.8% Two or more races74,115 86.9% White alone, not Hispanic / Latino172,865 85.6% Hispanic or LatinoMoved within same county 11,173 8.6% White / Caucasian1,236 9.0% Black or African American142 10.1% American Indian / Alaska Native292 3.5% Asian1,447 6.6% Other race17,966 13.0% Two or more races5,686 6.7% White alone, not Hispanic / Latino24,752 12.3% Hispanic or LatinoMoved within same state 2,855 2.2% White / Caucasian831 6.0% Black or African American18 1.3% American Indian / Alaska Native421 5.1% Asian506 2.3% Other race2,476 1.8% Two or more races2,765 3.2% White alone, not Hispanic / Latino3,396 1.7% Hispanic or LatinoMoved from different state 2,817 2.2% White / Caucasian230 1.7% Black or African American27 1.9% American Indian / Alaska Native870 10.6% Asian44 0.2% Other race357 0.3% Two or more races2,411 2.8% White alone, not Hispanic / Latino767 0.4% Hispanic or LatinoMoved from abroad 462 0.4% White143 1.7% Asian102 0.5% Other race123 0.1% Two or more races358 0.4% White alone, not Hispanic / Latino276 0.1% Hispanic or Latino
Children Nativity (place of birth) in Corpus Christi
Children under 6 years - Living with two parents Both parents native 9,249 100.0% NativeBoth parents foreign-born 955 93.1% Native71 6.9% Foreign-bornOne native, one foreign-born parent 1,316 100.0% NativeChildren under 6 years - Living with one parent Native parent 11,201 100.0% NativeForeign-born parent 115 62.5% Native69 37.5% Foreign-bornChildren 6 to 17 years - Living with two parents Both parents native 23,055 100.0% NativeBoth parents foreign-born 1,165 56.5% Native897 43.5% Foreign-bornOne native, one foreign-born parent 2,110 97.9% Native46 2.1% Foreign-bornChildren 6 to 17 years - Living with one parent Native parent 18,231 100.0% NativeForeign-born parent 985 50.0% Native985 50.0% Foreign-born
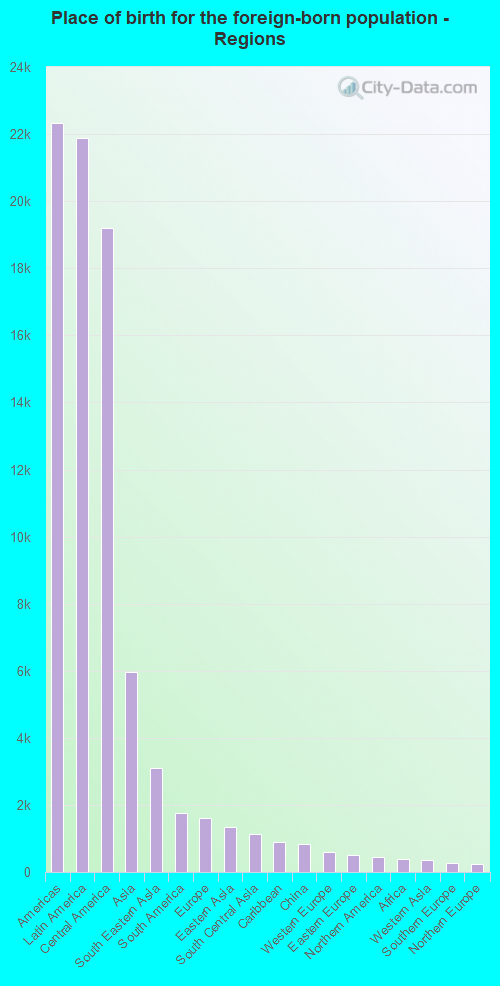
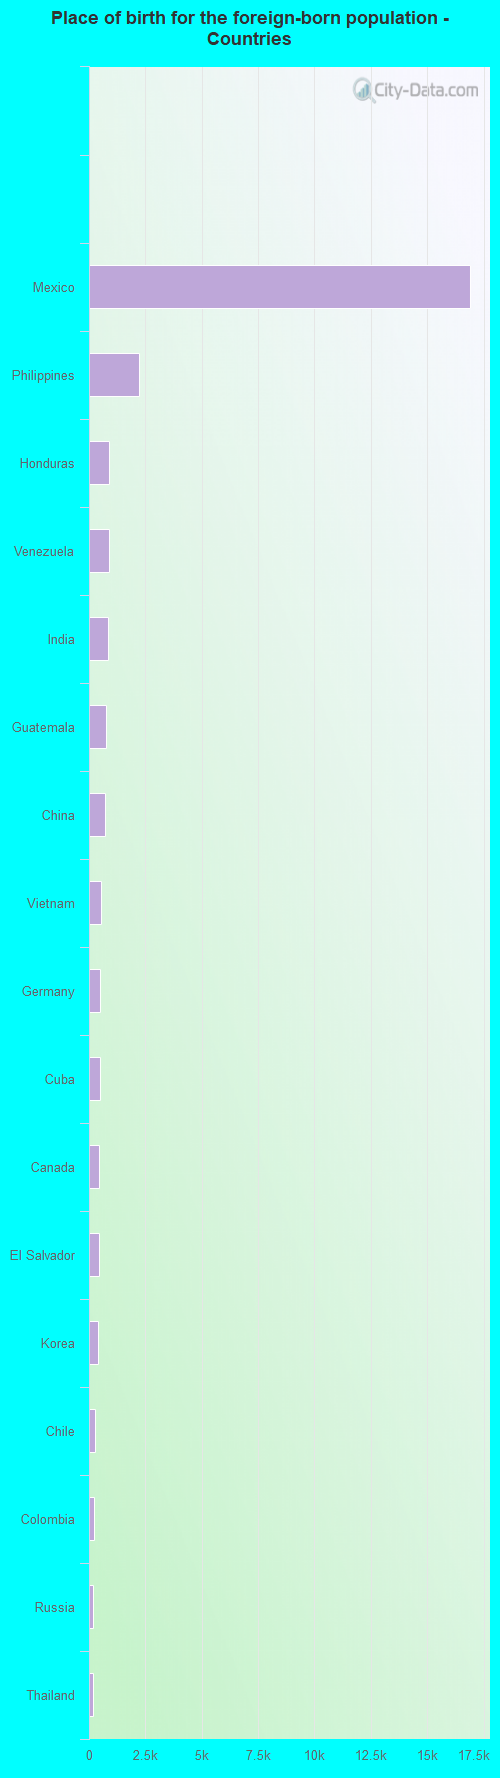
Place of birth for residents in Corpus Christi 22,331 Americas21,872 Latin America19,208 Central America5,953 Asia3,106 South Eastern Asia1,760 South America1,606 Europe1,333 Eastern Asia1,142 South Central Asia902 Caribbean847 China604 Western Europe508 Eastern Europe459 Northern America400 Africa371 Western Asia267 Southern Europe225 Northern Europe124 Western Africa97 Eastern Africa66 Northern Africa60 Oceania36 Middle Africa16 Australia and New Zealand Subregion16,894 Mexico2,225 Philippines886 Honduras881 Venezuela841 India750 Guatemala699 China534 Vietnam483 Germany482 Cuba459 Canada451 El Salvador395 Korea276 Chile242 Colombia182 Russia165 Thailand140 Spain138 Saudi Arabia136 Pakistan124 England124 Nigeria117 Dominican Republic116 Italy115 Panama115 Bangladesh109 Taiwan100 Brazil98 Ukraine94 Turkey90 Japan90 Trinidad and Tobago82 Poland82 Nicaragua78 Malaysia77 Ecuador54 Barbados54 Ireland53 Argentina51 Indonesia50 Switzerland48 Iran47 Bosnia and Herzegovina46 United Kingdom43 Fiji41 Israel38 Hong Kong38 St. Lucia35 Egypt34 Somalia31 Morocco30 Grenada29 Bulgaria29 United Arab Emirates27 Dominica26 Bolivia26 Laos26 Peru25 Uganda25 Syria23 Cambodia23 Netherlands22 Romania21 Zimbabwe21 Democratic Republic of Congo (Zaire)20 West Indies20 Guyana20 Jamaica19 Austria19 Bahamas19 Uruguay18 Iraq16 Australia15 Belgium14 Lebanon14 Cameroon11 Hungary10 France10 Portugal9 Tanzania9 Belarus8 Kuwait8 Czechoslovakia6 Kenya
Grandparents responsible for own grandchildren in Corpus Christi
Grandparents (30 to 59 years) White / Caucasian 480 50.4% Responsible for grandchildren472 49.6% Not responsible for grandchildrenBlack or African American 8 13.2% Responsible for grandchildren56 86.8% Not responsible for grandchildrenAmerican Indian / Alaska Native 24 100.0% Not responsible for grandchildrenAsian 38 100.0% Not responsible for grandchildrenOther race 198 46.8% Responsible for grandchildren225 53.2% Not responsible for grandchildrenTwo or more races 826 47.7% Responsible for grandchildren905 52.3% Not responsible for grandchildrenWhite alone, not Hispanic / Latino 338 54.9% Responsible for grandchildren278 45.1% Not responsible for grandchildrenHispanic or Latino 1,229 45.2% Responsible for grandchildren1,489 54.8% Not responsible for grandchildrenGrandparents (60 years and over) White / Caucasian 199 16.9% Responsible for grandchildren977 83.1% Not responsible for grandchildrenBlack or African American 9 7.9% Responsible for grandchildren106 92.1% Not responsible for grandchildrenAmerican Indian / Alaska Native 8 100.0% Not responsible for grandchildrenAsian 11 7.8% Responsible for grandchildren133 92.2% Not responsible for grandchildrenOther race 243 65.6% Responsible for grandchildren127 34.4% Not responsible for grandchildrenTwo or more races 375 23.7% Responsible for grandchildren1,209 76.3% Not responsible for grandchildrenWhite alone, not Hispanic / Latino 469 41.3% Responsible for grandchildren666 58.7% Not responsible for grandchildrenHispanic or Latino 426 20.6% Responsible for grandchildren1,638 79.4% Not responsible for grandchildren
Zip codes: 78370 , 78373 , 78374 , 78401 , 78402 , 78404 , 78405 , 78406 , 78407 , 78408 , 78409 , 78410 , 78411 , 78412 , 78413 , 78414 , 78415 , 78416 , 78417 , 78418 , 78419 .