Races in Worcester, Massachusetts (MA) Detailed Stats
Data:
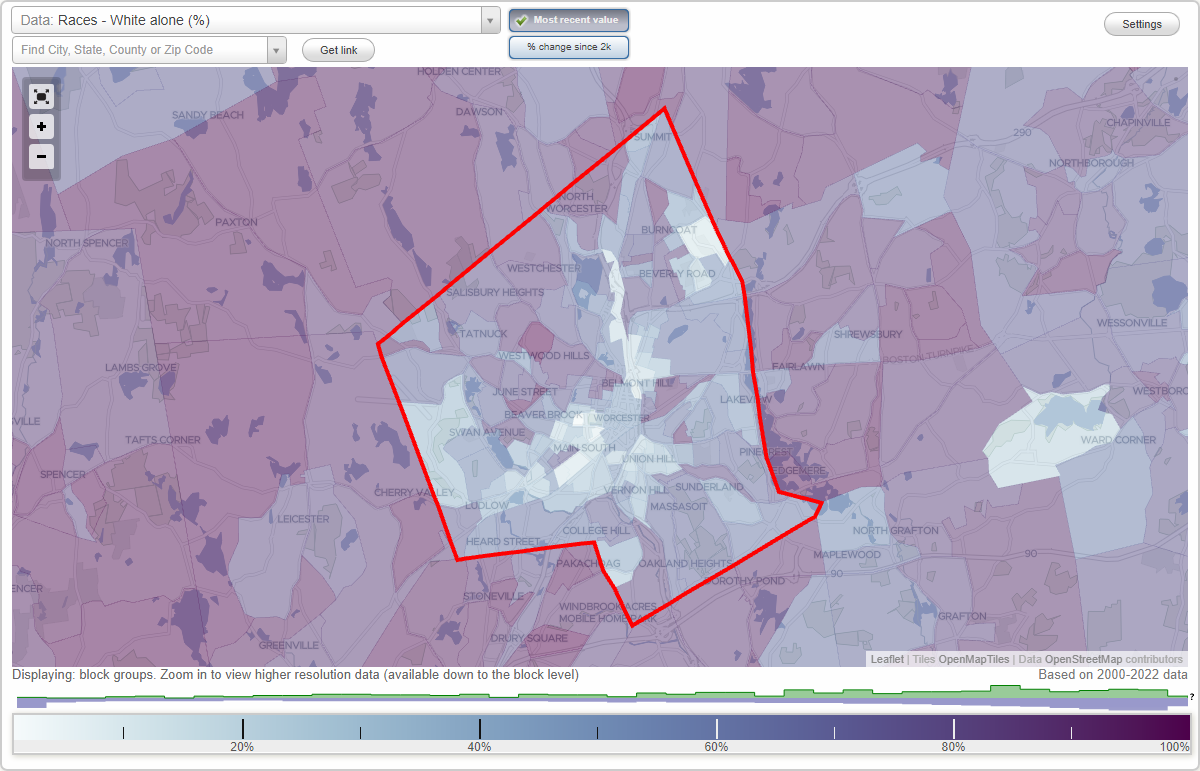
Races - White alone (%)
Races - White alone (% change since 2000)
Races - Black alone (%)
Races - Black alone (% change since 2000)
Races - American Indian alone (%)
Races - American Indian alone (% change since 2000)
Races - Asian alone (%)
Races - Asian alone (% change since 2000)
Races - Hispanic (%)
Races - Hispanic (% change since 2000)
Races - Native Hawaiian and Other Pacific Islander alone (%)
Races - Native Hawaiian and Other Pacific Islander alone (% change since 2000)
Races - Two or more races(%)
Races - Two or more races(% change since 2000)
Races - Other race alone (%)
Races - Other race alone (% change since 2000)
Racial diversity
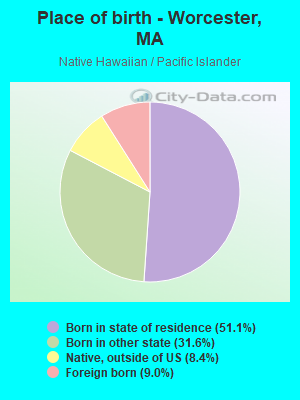
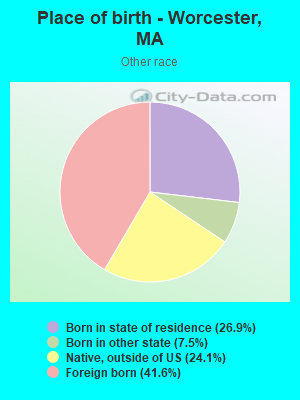
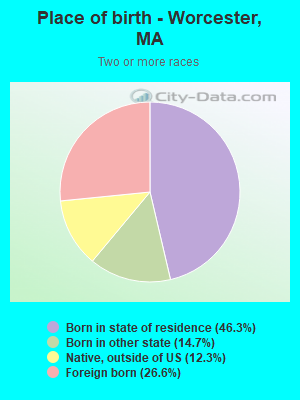
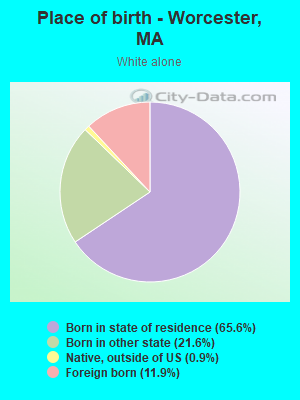
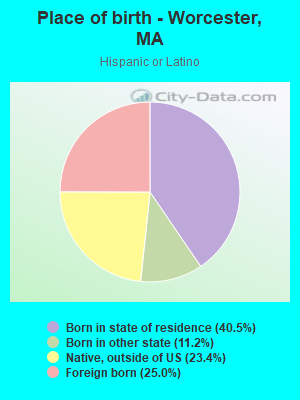
Place of birth - Born in state of residence (%)
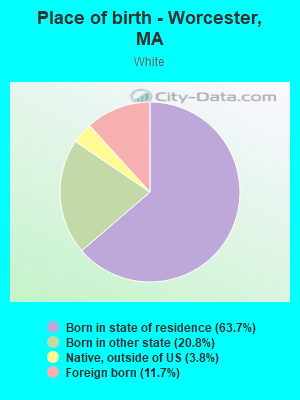
Place of birth - Born in state of residence (%) - White
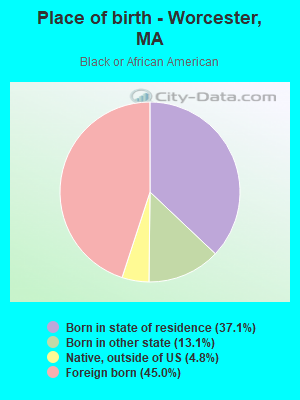
Place of birth - Born in state of residence (%) - Black or African American
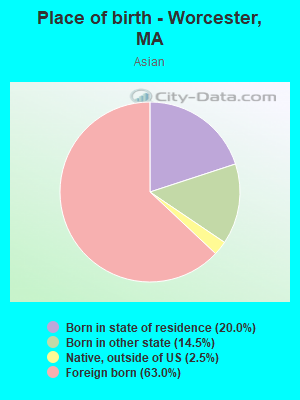
Place of birth - Born in state of residence (%) - Asian
Place of birth - Born in state of residence (%) - Hispanic or Latino
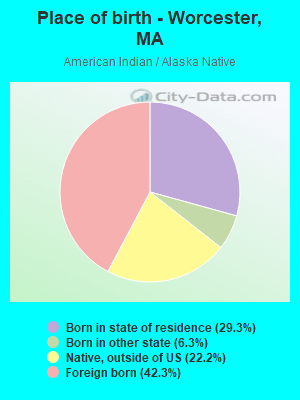
Place of birth - Born in state of residence (%) - American Indian and Alaska Native
Place of birth - Born in state of residence (%) - Multirace
Place of birth - Born in state of residence (%) - Other Race
Place of birth - Born in other state (%)
Place of birth - Born in other state (%) - White
Place of birth - Born in other state (%) - Black or African American
Place of birth - Born in other state (%) - Asian
Place of birth - Born in other state (%) - Hispanic or Latino
Place of birth - Born in other state (%) - American Indian and Alaska Native
Place of birth - Born in other state (%) - Multirace
Place of birth - Born in other state (%) - Other Race
Place of birth - Native, outside of US (%)
Place of birth - Native, outside of US (%) - White
Place of birth - Native, outside of US (%) - Black or African American
Place of birth - Native, outside of US (%) - Asian
Place of birth - Native, outside of US (%) - Hispanic or Latino
Place of birth - Native, outside of US (%) - American Indian and Alaska Native
Place of birth - Native, outside of US (%) - Multirace
Place of birth - Native, outside of US (%) - Other Race
Place of birth - Foreign born (%)
Place of birth - Foreign born (%) - White
Place of birth - Foreign born (%) - Black or African American
Place of birth - Foreign born (%) - Asian
Place of birth - Foreign born (%) - Hispanic or Latino
Place of birth - Foreign born (%) - American Indian and Alaska Native
Place of birth - Foreign born (%) - Multirace
Place of birth - Foreign born (%) - Other Race
Residents speaking English at home (%)
Residents speaking English at home - Born in the United States (%)
Residents speaking English at home - Native, born elsewhere (%)
Residents speaking English at home - Foreign born (%)
Residents speaking Spanish at home (%)
Residents speaking Spanish at home - Born in the United States (%)
Residents speaking Spanish at home - Native, born elsewhere (%)
Residents speaking Spanish at home - Foreign born (%)
Residents speaking other language at home (%)
Residents speaking other language at home - Born in the United States (%)
Residents speaking other language at home - Native, born elsewhere (%)
Residents speaking other language at home - Foreign born (%)
Marital status - Never married (%)
Marital status - Now married (%)
Marital status - Separated (%)
Marital status - Widowed (%)
Marital status - Divorced (%)
Ancestries Reported - Arab (%)
Ancestries Reported - Czech (%)
Ancestries Reported - Danish (%)
Ancestries Reported - Dutch (%)
Ancestries Reported - English (%)
Ancestries Reported - French (%)
Ancestries Reported - French Canadian (%)
Ancestries Reported - German (%)
Ancestries Reported - Greek (%)
Ancestries Reported - Hungarian (%)
Ancestries Reported - Irish (%)
Ancestries Reported - Italian (%)
Ancestries Reported - Lithuanian (%)
Ancestries Reported - Norwegian (%)
Ancestries Reported - Polish (%)
Ancestries Reported - Portuguese (%)
Ancestries Reported - Russian (%)
Ancestries Reported - Scotch-Irish (%)
Ancestries Reported - Scottish (%)
Ancestries Reported - Slovak (%)
Ancestries Reported - Subsaharan African (%)
Ancestries Reported - Swedish (%)
Ancestries Reported - Swiss (%)
Ancestries Reported - Ukrainian (%)
Ancestries Reported - United States (%)
Ancestries Reported - Welsh (%)
Ancestries Reported - West Indian (%)
Ancestries Reported - Other (%)
Geographical mobility - Same house 1 year ago (%)
Geographical mobility - Same house 1 year ago (%) - White
Geographical mobility - Same house 1 year ago (%) - Black or African American
Geographical mobility - Same house 1 year ago (%) - Asian
Geographical mobility - Same house 1 year ago (%) - Hispanic or Latino
Geographical mobility - Same house 1 year ago (%) - American Indian and Alaska Native
Geographical mobility - Same house 1 year ago (%) - Multirace
Geographical mobility - Same house 1 year ago (%) - Other Race
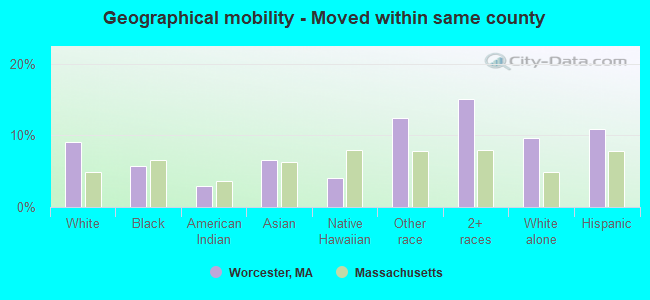
Geographical mobility - Moved within same county (%)
Geographical mobility - Moved within same county (%) - White
Geographical mobility - Moved within same county (%) - Black or African American
Geographical mobility - Moved within same county (%) - Asian
Geographical mobility - Moved within same county (%) - Hispanic or Latino
Geographical mobility - Moved within same county (%) - American Indian and Alaska Native
Geographical mobility - Moved within same county (%) - Multirace
Geographical mobility - Moved within same county (%) - Other Race
Geographical mobility - Moved from different county within same state (%)
Geographical mobility - Moved from different county within same state (%) - White
Geographical mobility - Moved from different county within same state (%) - Black or African American
Geographical mobility - Moved from different county within same state (%) - Asian
Geographical mobility - Moved from different county within same state (%) - Hispanic or Latino
Geographical mobility - Moved from different county within same state (%) - American Indian and Alaska Native
Geographical mobility - Moved from different county within same state (%) - Multirace
Geographical mobility - Moved from different county within same state (%) - Other Race
Geographical mobility - Moved from different state (%)
Geographical mobility - Moved from different state (%) - White
Geographical mobility - Moved from different state (%) - Black or African American
Geographical mobility - Moved from different state (%) - Asian
Geographical mobility - Moved from different state (%) - Hispanic or Latino
Geographical mobility - Moved from different state (%) - American Indian and Alaska Native
Geographical mobility - Moved from different state (%) - Multirace
Geographical mobility - Moved from different state (%) - Other Race
Geographical mobility - Moved from abroad (%)
Geographical mobility - Moved from abroad (%) - White
Geographical mobility - Moved from abroad (%) - Black or African American
Geographical mobility - Moved from abroad (%) - Asian
Geographical mobility - Moved from abroad (%) - Hispanic or Latino
Geographical mobility - Moved from abroad (%) - American Indian and Alaska Native
Geographical mobility - Moved from abroad (%) - Multirace
Geographical mobility - Moved from abroad (%) - Other Race
Place of birth for the foreign-born population - Ireland (%)
Place of birth for the foreign-born population - Denmark (%)
Place of birth for the foreign-born population - Norway (%)
Place of birth for the foreign-born population - Sweden (%)
Place of birth for the foreign-born population - United Kingdom (%)
Place of birth for the foreign-born population - England (%)
Place of birth for the foreign-born population - Scotland (%)
Place of birth for the foreign-born population - Other Northern Europe (%)
Place of birth for the foreign-born population - Austria (%)
Place of birth for the foreign-born population - Belgium (%)
Place of birth for the foreign-born population - France (%)
Place of birth for the foreign-born population - Germany (%)
Place of birth for the foreign-born population - Netherlands (%)
Place of birth for the foreign-born population - Switzerland (%)
Place of birth for the foreign-born population - Other Western Europe (%)
Place of birth for the foreign-born population - Greece (%)
Place of birth for the foreign-born population - Italy (%)
Place of birth for the foreign-born population - Portugal (%)
Place of birth for the foreign-born population - Spain (%)
Place of birth for the foreign-born population - Other Southern Europe (%)
Place of birth for the foreign-born population - Albania (%)
Place of birth for the foreign-born population - Belarus (%)
Place of birth for the foreign-born population - Bosnia and Herzegovina (%)
Place of birth for the foreign-born population - Bulgaria (%)
Place of birth for the foreign-born population - Croatia (%)
Place of birth for the foreign-born population - Czechoslovakia (%)
Place of birth for the foreign-born population - Hungary (%)
Place of birth for the foreign-born population - Latvia (%)
Place of birth for the foreign-born population - Lithuania (%)
Place of birth for the foreign-born population - North Macedonia (Macedonia) (%)
Place of birth for the foreign-born population - Moldova (%)
Place of birth for the foreign-born population - Poland (%)
Place of birth for the foreign-born population - Romania (%)
Place of birth for the foreign-born population - Russia (%)
Place of birth for the foreign-born population - Serbia (%)
Place of birth for the foreign-born population - Ukraine (%)
Place of birth for the foreign-born population - Other Eastern Europe (%)
Place of birth for the foreign-born population - China (%)
Place of birth for the foreign-born population - Hong Kong (%)
Place of birth for the foreign-born population - Taiwan (%)
Place of birth for the foreign-born population - Japan (%)
Place of birth for the foreign-born population - Korea (%)
Place of birth for the foreign-born population - Other Eastern Asia (%)
Place of birth for the foreign-born population - Afghanistan (%)
Place of birth for the foreign-born population - Bangladesh (%)
Place of birth for the foreign-born population - India (%)
Place of birth for the foreign-born population - Iran (%)
Place of birth for the foreign-born population - Kazakhstan (%)
Place of birth for the foreign-born population - Nepal (%)
Place of birth for the foreign-born population - Pakistan (%)
Place of birth for the foreign-born population - Sri Lanka (%)
Place of birth for the foreign-born population - Uzbekistan (%)
Place of birth for the foreign-born population - Other South Central Asia (%)
Place of birth for the foreign-born population - Burma (%)
Place of birth for the foreign-born population - Cambodia (%)
Place of birth for the foreign-born population - Indonesia (%)
Place of birth for the foreign-born population - Laos (%)
Place of birth for the foreign-born population - Malaysia (%)
Place of birth for the foreign-born population - Philippines (%)
Place of birth for the foreign-born population - Singapore (%)
Place of birth for the foreign-born population - Thailand (%)
Place of birth for the foreign-born population - Vietnam (%)
Place of birth for the foreign-born population - Other South Eastern Asia (%)
Place of birth for the foreign-born population - Armenia (%)
Place of birth for the foreign-born population - Iraq (%)
Place of birth for the foreign-born population - Israel (%)
Place of birth for the foreign-born population - Jordan (%)
Place of birth for the foreign-born population - Kuwait (%)
Place of birth for the foreign-born population - Lebanon (%)
Place of birth for the foreign-born population - Saudi Arabia (%)
Place of birth for the foreign-born population - Syria (%)
Place of birth for the foreign-born population - Turkey (%)
Place of birth for the foreign-born population - Yemen (%)
Place of birth for the foreign-born population - Other Western Asia (%)
Place of birth for the foreign-born population - Eritrea (%)
Place of birth for the foreign-born population - Ethiopia (%)
Place of birth for the foreign-born population - Kenya (%)
Place of birth for the foreign-born population - Somalia (%)
Place of birth for the foreign-born population - Uganda (%)
Place of birth for the foreign-born population - Zimbabwe (%)
Place of birth for the foreign-born population - Other Eastern Africa (%)
Place of birth for the foreign-born population - Cameroon (%)
Place of birth for the foreign-born population - Congo (%)
Place of birth for the foreign-born population - Democratic Republic of Congo (Zaire) (%)
Place of birth for the foreign-born population - Other Middle Africa (%)
Place of birth for the foreign-born population - Egypt (%)
Place of birth for the foreign-born population - Morocco (%)
Place of birth for the foreign-born population - Sudan (%)
Place of birth for the foreign-born population - Other Northern Africa (%)
Place of birth for the foreign-born population - South Africa (%)
Place of birth for the foreign-born population - Other Southern Africa (%)
Place of birth for the foreign-born population - Cabo Verde (%)
Place of birth for the foreign-born population - Ghana (%)
Place of birth for the foreign-born population - Liberia (%)
Place of birth for the foreign-born population - Nigeria (%)
Place of birth for the foreign-born population - Senegal (%)
Place of birth for the foreign-born population - Sierra Leone (%)
Place of birth for the foreign-born population - Other Western Africa (%)
Place of birth for the foreign-born population - Australia (%)
Place of birth for the foreign-born population - New Zealand (%)
Place of birth for the foreign-born population - Fiji (%)
Place of birth for the foreign-born population - Micronesia (%)
Place of birth for the foreign-born population - Bahamas (%)
Place of birth for the foreign-born population - Barbados (%)
Place of birth for the foreign-born population - Cuba (%)
Place of birth for the foreign-born population - Dominica (%)
Place of birth for the foreign-born population - Dominican Republic (%)
Place of birth for the foreign-born population - Grenada (%)
Place of birth for the foreign-born population - Haiti (%)
Place of birth for the foreign-born population - Jamaica (%)
Place of birth for the foreign-born population - St. Vincent and the Grenadines (%)
Place of birth for the foreign-born population - Trinidad and Tobago (%)
Place of birth for the foreign-born population - West Indies (%)
Place of birth for the foreign-born population - Other Caribbean (%)
Place of birth for the foreign-born population - Belize (%)
Place of birth for the foreign-born population - Costa Rica (%)
Place of birth for the foreign-born population - El Salvador (%)
Place of birth for the foreign-born population - Guatemala (%)
Place of birth for the foreign-born population - Honduras (%)
Place of birth for the foreign-born population - Mexico (%)
Place of birth for the foreign-born population - Nicaragua (%)
Place of birth for the foreign-born population - Panama (%)
Place of birth for the foreign-born population - Other Central America (%)
Place of birth for the foreign-born population - Argentina (%)
Place of birth for the foreign-born population - Bolivia (%)
Place of birth for the foreign-born population - Brazil (%)
Place of birth for the foreign-born population - Chile (%)
Place of birth for the foreign-born population - Colombia (%)
Place of birth for the foreign-born population - Ecuador (%)
Place of birth for the foreign-born population - Guyana (%)
Place of birth for the foreign-born population - Peru (%)
Place of birth for the foreign-born population - Uruguay (%)
Place of birth for the foreign-born population - Venezuela (%)
Place of birth for the foreign-born population - Other South America (%)
Place of birth for the foreign-born population - Canada (%)
Place of birth for the foreign-born population - Other Northern America (%)
Place of birth for the foreign-born population - Other (%)
Latest news about races in Worcester, MA collected exclusively by city-data.com from local newspapers, TV, and radio stations
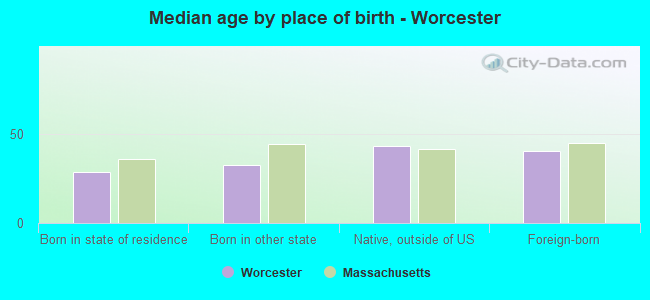
According to 2022 data, the most numerous races in Worcester, MA are White alone (100,528 residents), Hispanic (51,438 residents), and Asian alone (14,644 residents). 59.9% of Worcester residents speak English at home. 23.8% of Worcester, MA residents are foreign-born (8.3% born in Latin America, 6.0% born in Asia, 5.2% born in Africa, 3.6% born in Europe), which is 24.5% greater than the foreign-born rate of 18.0% across the entire state of Massachusetts.
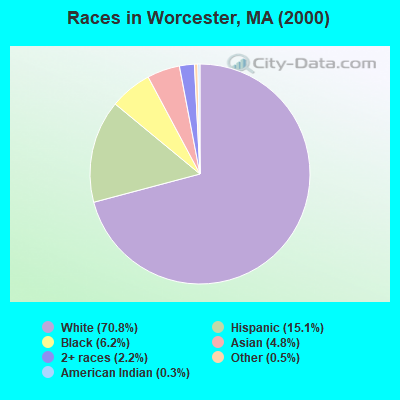
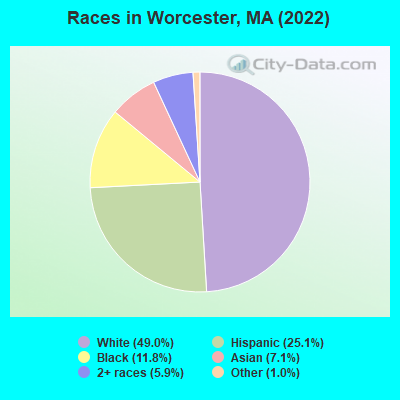
Race distribution in Worcester
2000 2022
122,211 70.8% White alone 26,155 15.1% Hispanic 10,762 6.2% Black alone 8,336 4.8% Asian alone 3,762 2.2% Two or more races 824 0.5% Other race alone 550 0.3% American Indian alone 48 0.03% Native Hawaiian and Other
100,528 49.0% White alone 51,438 25.1% Hispanic 24,304 11.8% Black alone 14,644 7.1% Asian alone 12,101 5.9% Two or more races 2,152 1.0% Other race alone 150 0.07% American Indian alone
2000 2022
5,198,359 81.9% White alone 428,729 6.8% Hispanic 318,329 5.0% Black alone 236,786 3.7% Asian alone 110,338 1.7% Two or more races 43,586 0.7% Other race alone 11,264 0.2% American Indian alone 1,706 0.03% Native Hawaiian and Other
4,676,627 67.0% White alone 911,038 13.0% Hispanic 501,463 7.2% Asian alone 459,740 6.6% Black alone 341,889 4.9% Two or more races 84,403 1.2% Other race alone 5,838 0.08% American Indian alone 976 0.01% Native Hawaiian and Other
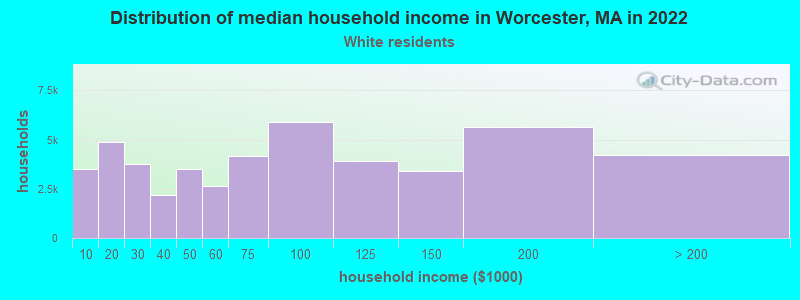
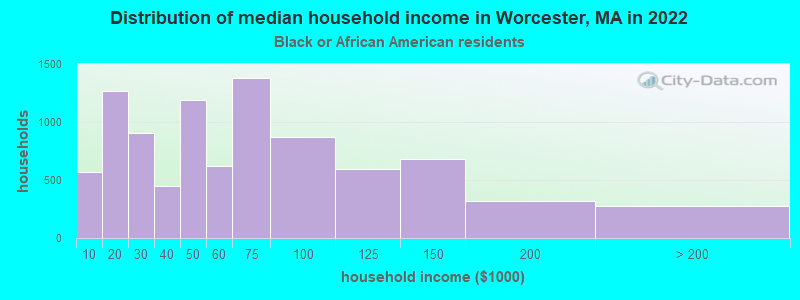
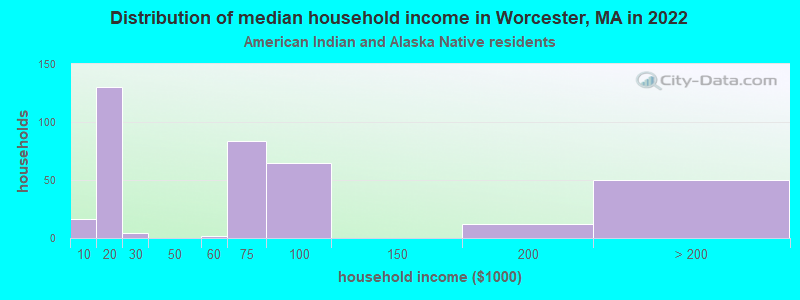
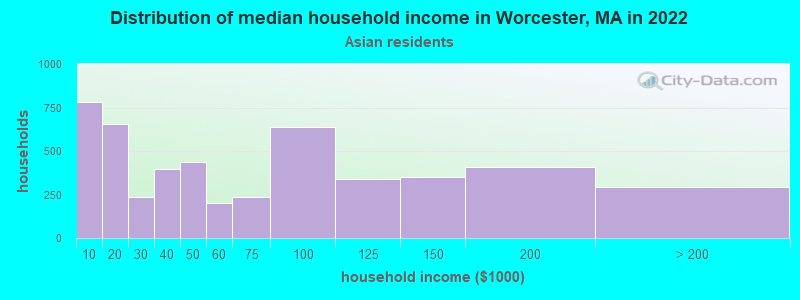
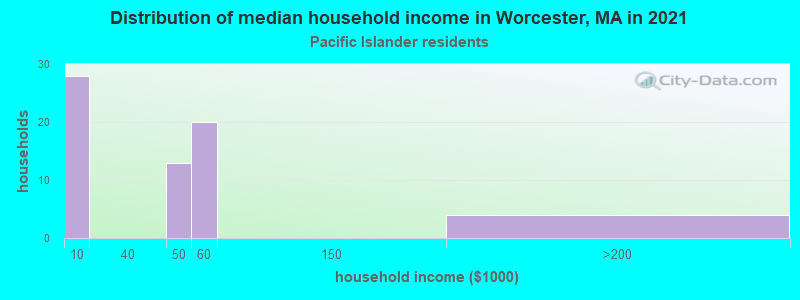
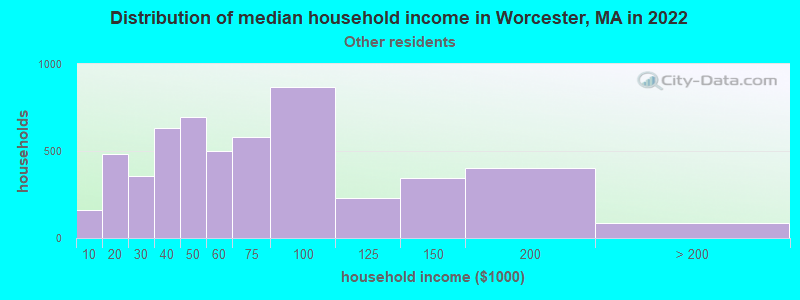
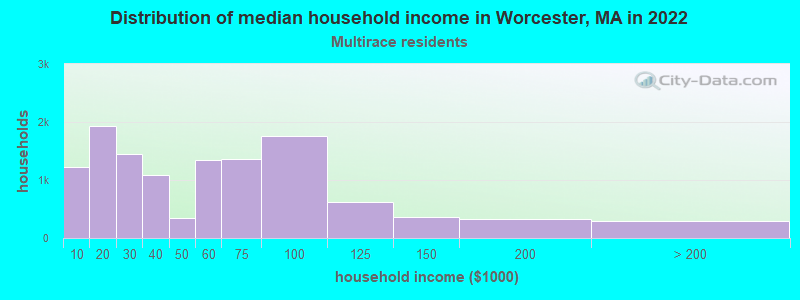
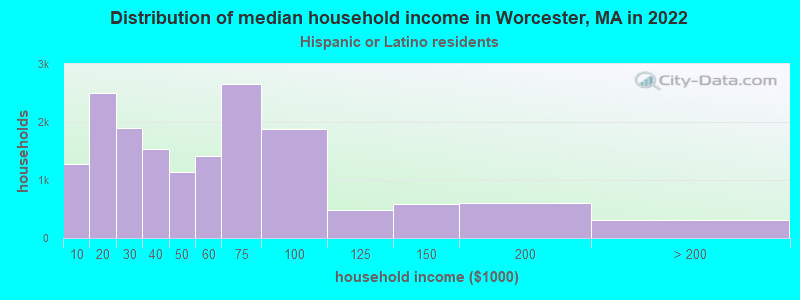
Income and house value in Worcester Median household income in 2022 $75,153 White non-Hispanic householders$56,474 Black householders$49,031 Asian householders$57,386 Some other race householders$50,052 Two or more races householders$47,634 Hispanic or Latino race householdersMedian 2022 house value $367,899 White Non-Hispanic householders$335,654 Black or African American householders$300,645 American Indian or Alaska Native householders $367,285 Asian householdersover $1,000,000 Native Hawaiian and other Pacific Islander householders$306,480 Some other race householders$415,191 Two or more races householders$361,450 Hispanic or Latino householders
Median age by race in Worcester
36.6 Median age for White residents34.1 39.4 32.0 Median age for Black or African American residents29.9 32.9 33.4 Median age for American Indian / Alaska Native residents33.4 -666,666,666.0 30.4 Median age for Asian residents28.6 33.1 25.3 Median age for Native Hawaiian / Pacific Islander residents-666,666,666.0 9.3 31.3 Median age for Other race residents31.9 31.1 26.9 Median age for Two or more races residents25.2 28.9 38.0 Median age for White alone residents34.8 40.8 28.5 Median age for Hispanic or Latino residents26.1 30.7
Owner/renter occupied households by race in Worcester
House owners and renters - White residents 22,241 46.5% Owner occupied25,623 53.5% Renter occupiedHouse owners and renters - Black or African American residents 2,565 28.1% Owner occupied6,557 71.9% Renter occupiedHouse owners and renters - American Indian / Alaska Native residents 166 42.0% Owner occupied229 58.0% Renter occupiedHouse owners and renters - Asian residents 1,932 38.9% Owner occupied3,040 61.1% Renter occupiedHouse owners and renters - Native Hawaiian / Pacific Islander residents 15 11.0% Owner occupied122 89.0% Renter occupiedHouse owners and renters - Other race residents 2,083 35.9% Owner occupied3,714 64.1% Renter occupiedHouse owners and renters - Two or more races residents 1,933 16.0% Owner occupied10,172 84.0% Renter occupiedHouse owners and renters - White alone residents 21,759 48.2% Owner occupied23,389 51.8% Renter occupiedHouse owners and renters - Hispanic or Latino residents 3,392 20.8% Owner occupied12,885 79.2% Renter occupied
Language usage in Worcester
English speakers - Total 59.9% of residents of Worcester speak English at home.
19.6% of residents speak Spanish at home 21,949 57.6% Speak English very well16,190 42.4% Speak English less than very well20.5% of residents speak other language at home 20,798 52.2% Speak English very well19,082 47.8% Speak English less than very well
English speakers - Born in the United States 81.7% of residents of Worcester speak English at home.
11.3% of residents speak Spanish at home 3,020 77.4% Speak English very well880 22.6% Speak English less than very well7.0% of residents speak other language at home 2,082 85.5% Speak English very well354 14.5% Speak English less than very well
English speakers - Native, born elsewhere 18.6% of residents of Worcester speak English at home.
74.2% of residents speak Spanish at home 5,153 48.6% Speak English very well5,452 51.4% Speak English less than very well7.2% of residents speak other language at home 1,026 100.0% Speak English very well
English speakers - Foreign-born 13.2% of residents of Worcester speak English at home.
24.2% of residents speak Spanish at home 3,607 29.9% Speak English very well8,467 70.1% Speak English less than very well62.6% of residents speak other language at home 13,647 43.8% Speak English very well17,541 56.2% Speak English less than very well
White (Caucasian) - Speak only English Native:
89.9% (83,950)Foreign-born:
12.3% (1,548)
White (Caucasian) - Speak another language Native:
10.1% (9,408)Foreign-born:
87.7% (10,993)
Black or African American - Speak only English Native:
79.8% (9,498)Foreign-born:
28.8% (3,316)
Black or African American - Speak another language Native:
20.2% (2,410)Foreign-born:
71.2% (8,190)
American Indian / Alaska Native - Speak only English Native:
26.2% (153)Foreign-born:
0.3% (1)
American Indian / Alaska Native - Speak another language Native:
94.0% (549)Foreign-born:
100.0% (398)
Asian - Speak only English Native:
40.2% (1,725)Foreign-born:
6.7% (611)
Asian - Speak another language Native:
59.8% (2,568)Foreign-born:
93.3% (8,561)
Native Hawaiian / Pacific Islander - Speak only English Native:
52.7% (96)Foreign-born:
79.7% (24)
Native Hawaiian / Pacific Islander - Speak another language Native:
47.7% (87)Foreign-born:
17.4% (5)
Other race - Speak only English Native:
27.1% (2,595)Foreign-born:
11.5% (781)
Other race - Speak another language Native:
72.9% (6,974)Foreign-born:
88.5% (6,010)
Two or more races - Speak only English Native:
48.0% (12,045)Foreign-born:
3.2% (315)
Two or more races - Speak another language Native:
52.0% (13,028)Foreign-born:
96.8% (9,456)
White alone - Speak only English Native:
94.1% (81,193)Foreign-born:
12.1% (1,410)
White alone - Speak another language Native:
5.9% (5,125)Foreign-born:
87.9% (10,282)
Hispanic or Latino - Speak only English Native:
31.5% (10,963)Foreign-born:
5.1% (635)
Hispanic or Latino - Speak another language Native:
68.5% (23,841)Foreign-born:
94.9% (11,933)
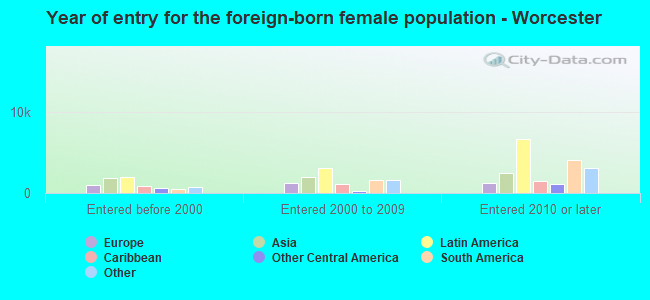
Foreign-born residents in Worcester 48,911 residents are foreign born (8.3% Latin America , 6.0% Asia , 5.2% Africa , 3.6% Europe ).
This city:
23.8%Massachusetts:
17.6%
Marital status for residents in Worcester Marital status - White (Caucasian) population 15 years and over
Males 54.8% Never married33.3% Now married1.1% Separated3.1% Widowed7.6% DivorcedFemales 45.8% Never married32.4% Now married1.0% Separated8.7% Widowed12.1% DivorcedWomen who gave birth in the past 12 months Now married:
48.1% (682)Unmarried:
51.9% (737)
Women who did not give birth in the past 12 months Now married:
26.2% (7,211)Unmarried:
73.8% (20,270)
Marital status - Black or African American population 15 years and over
Males 43.0% Never married41.6% Now married2.9% Separated3.0% Widowed9.5% DivorcedFemales 51.0% Never married28.7% Now married4.2% Separated8.2% Widowed7.9% DivorcedWomen who gave birth in the past 12 months Now married:
80.1% (402)Unmarried:
19.9% (100)
Women who did not give birth in the past 12 months Now married:
33.0% (2,319)Unmarried:
67.0% (4,707)
Marital status - American Indian / Alaska Native population 15 years and over
Males 59.6% Never married16.3% Now married0.0% Separated11.3% Widowed12.9% DivorcedFemales 56.8% Never married23.7% Now married0.8% Separated12.4% Widowed6.4% DivorcedWomen who gave birth in the past 12 months Now married:
80.0% (19)Unmarried:
20.0% (5)
Women who did not give birth in the past 12 months Now married:
1.3% (2)Unmarried:
98.7% (184)
Marital status - Asian population 15 years and over
Males 42.4% Never married53.5% Now married0.6% Separated0.7% Widowed2.8% DivorcedFemales 43.3% Never married39.8% Now married1.0% Separated6.7% Widowed9.1% DivorcedWomen who gave birth in the past 12 months Now married:
42.6% (103)Unmarried:
57.4% (139)
Women who did not give birth in the past 12 months Now married:
31.5% (1,482)Unmarried:
68.5% (3,220)
Marital status - Native Hawaiian / Pacific Islander population 15 years and over
Males 57.0% Never married0.0% Now married0.0% Separated15.1% Widowed27.9% DivorcedFemales 57.9% Never married9.5% Now married0.0% Separated0.0% Widowed32.6% DivorcedWomen who gave birth in the past 12 months Now married:
0.0% (0)Unmarried:
100.0% (16)
Women who did not give birth in the past 12 months Now married:
0.0% (0)Unmarried:
100.0% (42)
Marital status - Other race population 15 years and over
Males 50.2% Never married34.7% Now married8.5% Separated0.0% Widowed6.6% DivorcedFemales 42.7% Never married34.0% Now married1.9% Separated6.2% Widowed15.2% DivorcedWomen who gave birth in the past 12 months Now married:
24.6% (41)Unmarried:
75.4% (126)
Women who did not give birth in the past 12 months Now married:
40.4% (1,748)Unmarried:
59.6% (2,580)
Marital status - Two or more races population 15 years and over
Males 59.6% Never married27.2% Now married2.1% Separated0.0% Widowed11.2% DivorcedFemales 48.0% Never married25.5% Now married7.9% Separated8.4% Widowed10.1% DivorcedWomen who gave birth in the past 12 months Now married:
59.3% (201)Unmarried:
40.7% (138)
Women who did not give birth in the past 12 months Now married:
29.9% (2,951)Unmarried:
70.1% (6,933)
Marital status - White alone, not Hispanic / Latino population 15 years and over
Males 53.5% Never married34.6% Now married0.6% Separated3.4% Widowed7.8% DivorcedFemales 45.1% Never married32.7% Now married1.0% Separated9.0% Widowed12.2% DivorcedWomen who gave birth in the past 12 months Now married:
50.2% (493)Unmarried:
49.8% (490)
Women who did not give birth in the past 12 months Now married:
26.2% (6,840)Unmarried:
73.8% (19,244)
Marital status - Hispanic or Latino population 15 years and over
Males 58.0% Never married27.1% Now married5.9% Separated0.0% Widowed9.0% DivorcedFemales 47.1% Never married26.8% Now married6.4% Separated6.9% Widowed12.9% DivorcedWomen who gave birth in the past 12 months Now married:
28.4% (280)Unmarried:
71.6% (706)
Women who did not give birth in the past 12 months Now married:
34.6% (4,169)Unmarried:
65.4% (7,872)
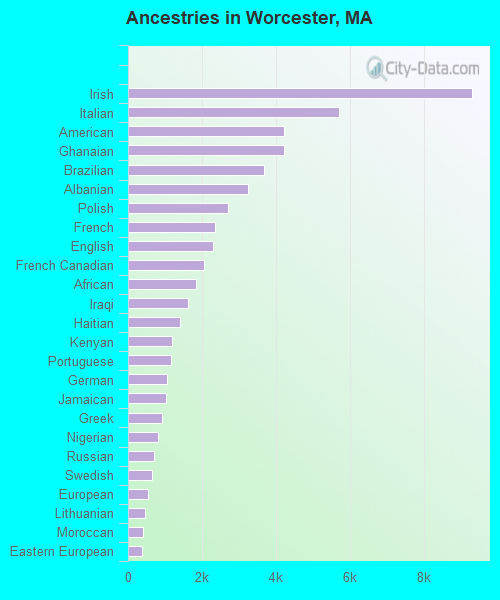
Ancestries in Worcester
9,297 8.4% Irish5,708 5.2% Italian4,230 3.8% American4,220 3.8% Ghanaian3,674 3.3% Brazilian3,247 2.9% Albanian2,712 2.5% Polish2,340 2.1% French2,309 2.1% English2,044 1.8% French Canadian1,850 1.7% African1,630 1.5% Iraqi1,419 1.3% Haitian1,192 1.1% Kenyan1,166 1.1% Portuguese1,058 1.0% German1,035 0.9% Jamaican907 0.8% Greek817 0.7% Nigerian705 0.6% Russian640 0.6% Swedish537 0.5% European462 0.4% Lithuanian395 0.4% Moroccan380 0.3% Eastern European366 0.3% Lebanese347 0.3% Canadian319 0.3% Syrian303 0.3% Scottish286 0.3% Armenian227 0.2% Arab220 0.2% Norwegian197 0.2% Trinidadian and Tobagonian170 0.2% Finnish169 0.2% Jordanian156 0.1% Somali147 0.1% Scotch-Irish129 0.1% Liberian126 0.1% British116 0.1% Cape Verdean115 0.1% Northern European113 0.1% Dutch108 0.10% West Indian106 0.10% Slovene101 0.09% Ukrainian90 0.08% Serbian71 0.06% Iranian70 0.06% Guyanese70 0.06% Welsh66 0.06% Ethiopian65 0.06% Afghan63 0.06% Danish62 0.06% Zimbabwean61 0.06% Austrian55 0.05% Romanian54 0.05% Swiss51 0.05% Israeli41 0.04% Turkish31 0.03% Macedonian29 0.03% Czech26 0.02% South African23 0.02% Ugandan23 0.02% Palestinian23 0.02% Scandinavian22 0.02% Belgian19 0.02% Hungarian19 0.02% Yugoslavian11 0.01% British West Indian10 0.01% Assyrian10 0.01% Slavic10 0.01% Bulgarian9 0.01% Egyptian8 0.01% Sudanese
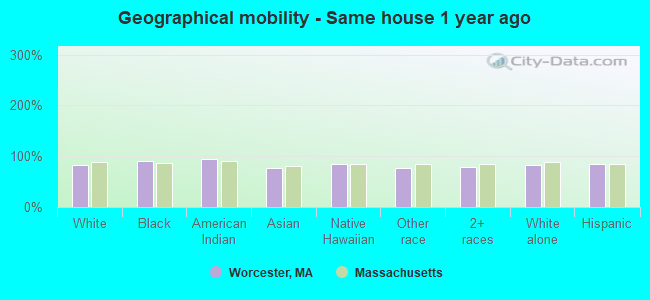
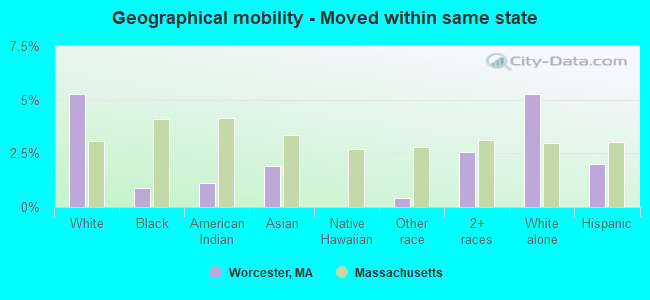
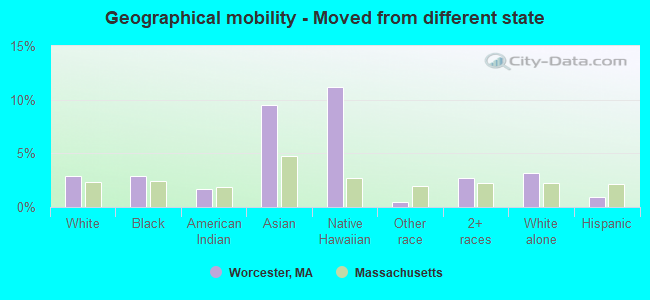
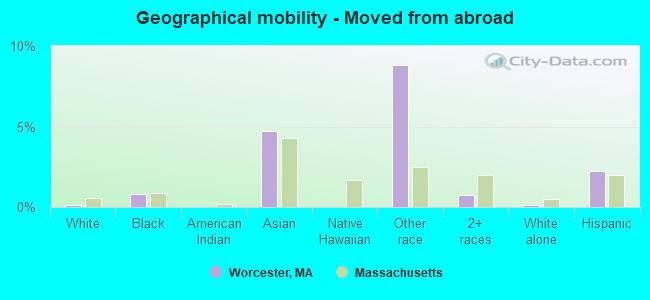
Geographical mobility in Worcester Same house 1 year ago 89,655 82.6% White (Caucasian)22,830 89.7% Black or African American1,043 94.7% American Indian / Alaska Native11,327 77.3% Asian193 85.4% Native Hawaiian / Pacific Islander13,629 77.8% Other race29,154 78.9% Two or more races81,839 81.8% White alone, not Hispanic / Latino42,478 83.9% Hispanic or LatinoMoved within same county 9,850 9.1% White / Caucasian1,450 5.7% Black or African American33 3.0% American Indian / Alaska Native957 6.5% Asian9 4.0% Native Hawaiian / Pacific Islander2,190 12.5% Other race5,581 15.1% Two or more races9,688 9.7% White alone, not Hispanic / Latino5,518 10.9% Hispanic or LatinoMoved within same state 5,729 5.3% White / Caucasian223 0.9% Black or African American12 1.1% American Indian / Alaska Native279 1.9% Asian70 0.4% Other race954 2.6% Two or more races5,256 5.3% White alone, not Hispanic / Latino1,017 2.0% Hispanic or LatinoMoved from different state 3,158 2.9% White / Caucasian730 2.9% Black or African American19 1.7% American Indian / Alaska Native1,398 9.5% Asian25 11.2% Native Hawaiian / Pacific Islander85 0.5% Other race982 2.7% Two or more races3,129 3.1% White alone, not Hispanic / Latino490 1.0% Hispanic or LatinoMoved from abroad 118 0.1% White213 0.8% Black or African American687 4.7% Asian1,541 8.8% Other race283 0.8% Two or more races118 0.1% White alone, not Hispanic / Latino1,128 2.2% Hispanic or Latino
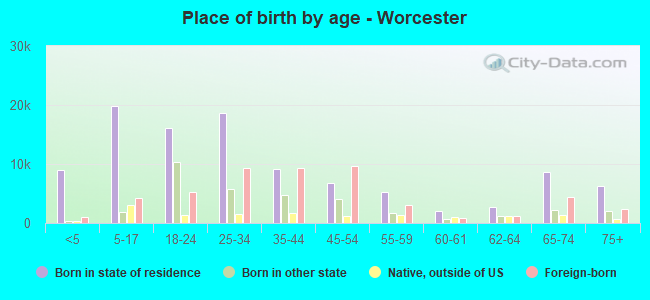
Children Nativity (place of birth) in Worcester
Children under 6 years - Living with two parents Both parents native 2,530 100.0% NativeBoth parents foreign-born 2,992 75.2% Native985 24.8% Foreign-bornOne native, one foreign-born parent 1,028 100.0% NativeChildren under 6 years - Living with one parent Native parent 3,583 100.0% NativeForeign-born parent 1,366 68.0% Native643 32.0% Foreign-bornChildren 6 to 17 years - Living with two parents Both parents native 3,002 100.0% NativeBoth parents foreign-born 3,713 64.8% Native2,017 35.2% Foreign-bornOne native, one foreign-born parent 2,941 97.4% Native78 2.6% Foreign-bornChildren 6 to 17 years - Living with one parent Native parent 8,170 100.0% NativeForeign-born parent 3,384 63.7% Native1,925 36.3% Foreign-born
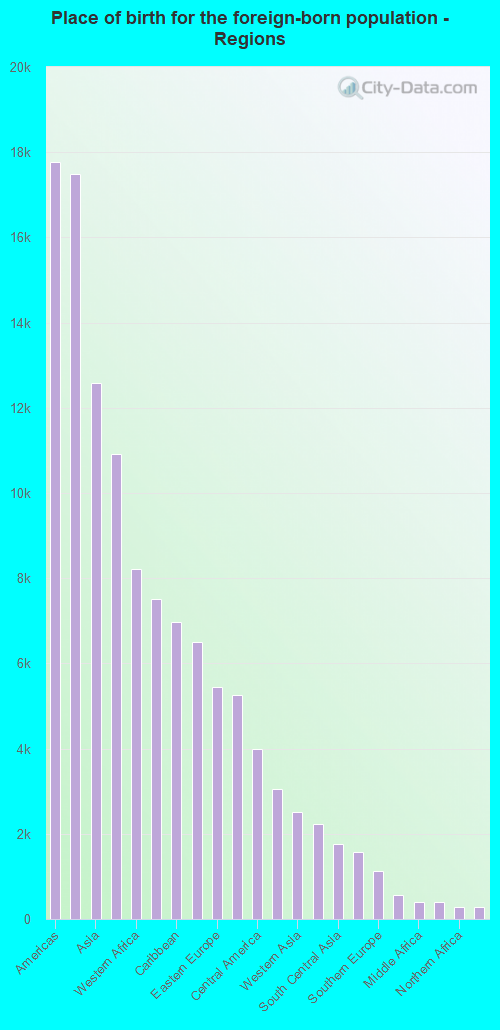
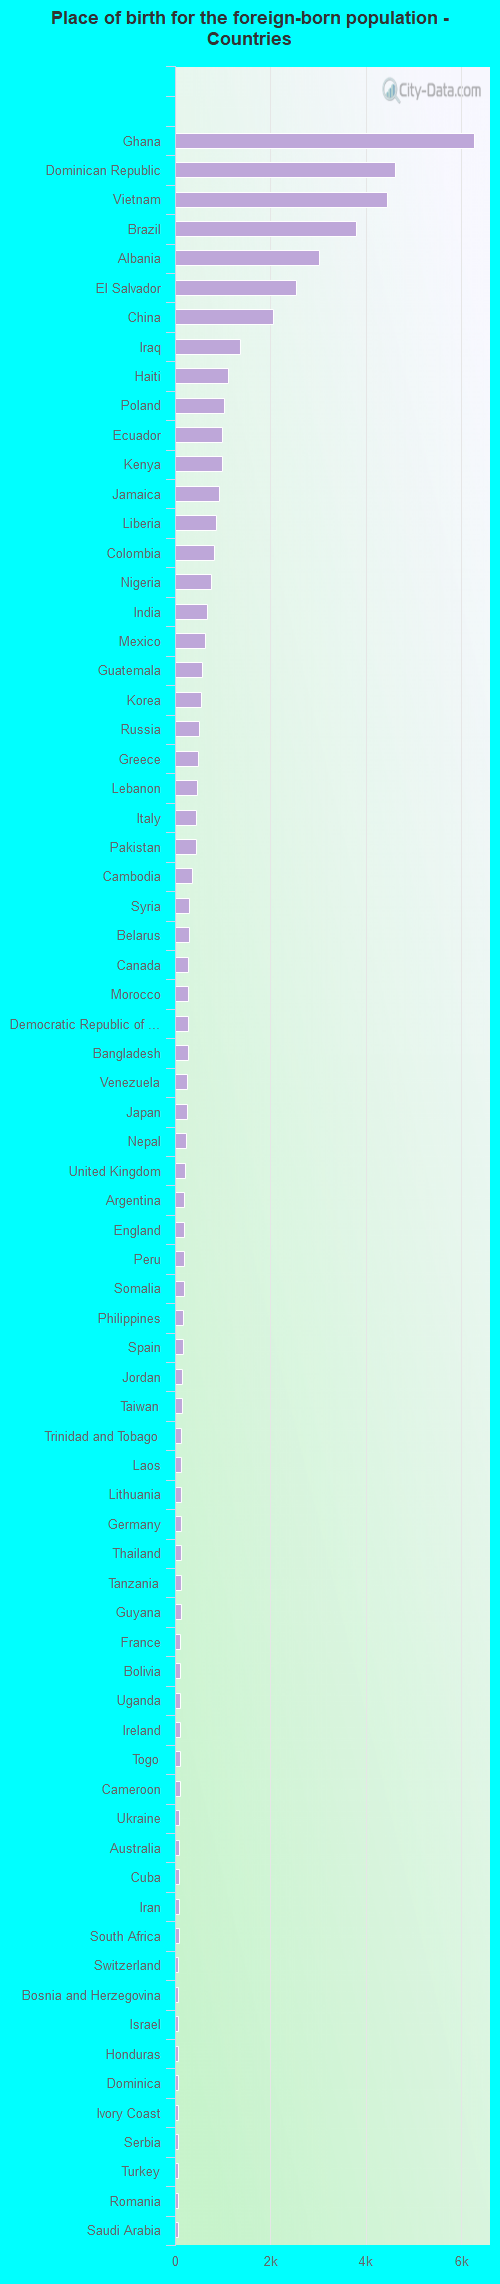
Place of birth for residents in Worcester 17,764 Americas17,488 Latin America12,589 Asia10,920 Africa8,209 Western Africa7,522 Europe6,974 Caribbean6,514 South America5,443 Eastern Europe5,265 South Eastern Asia3,999 Central America3,042 Eastern Asia2,511 Western Asia2,230 China1,768 South Central Asia1,568 Eastern Africa1,126 Southern Europe559 Northern Europe404 Middle Africa392 Western Europe290 Northern Africa276 Northern America114 Oceania114 Australia and New Zealand Subregion75 Southern Africa6,266 Ghana4,617 Dominican Republic4,446 Vietnam3,787 Brazil3,019 Albania2,525 El Salvador2,063 China1,362 Iraq1,113 Haiti1,019 Poland991 Ecuador977 Kenya915 Jamaica851 Liberia821 Colombia761 Nigeria661 India621 Mexico566 Guatemala548 Korea495 Russia484 Greece453 Lebanon439 Italy433 Pakistan350 Cambodia290 Syria288 Belarus276 Canada274 Morocco273 Democratic Republic of Congo (Zaire)267 Bangladesh249 Venezuela246 Japan235 Nepal208 United Kingdom193 Argentina191 England187 Peru184 Somalia168 Philippines160 Spain154 Jordan137 Taiwan129 Trinidad and Tobago121 Laos120 Lithuania119 Germany119 Thailand119 Tanzania116 Guyana115 France114 Bolivia114 Uganda112 Ireland112 Togo95 Cameroon90 Ukraine90 Australia86 Cuba81 Iran75 South Africa72 Switzerland71 Bosnia and Herzegovina71 Israel71 Honduras70 Dominica70 Ivory Coast68 Serbia64 Turkey59 Romania57 Saudi Arabia50 Panama50 Indonesia44 Bhutan43 Portugal43 Senegal41 Kazakhstan40 Austria37 Nicaragua36 Chile34 Belgium33 Kuwait31 Ethiopia29 Hong Kong24 New Zealand24 Cabo Verde22 North Macedonia (Macedonia)22 Latvia20 Scotland19 Eritrea14 Uruguay13 Congo13 Sweden11 Denmark10 Netherlands10 Singapore10 Bulgaria8 Egypt8 Moldova7 Sierra Leone7 Sudan7 Hungary6 Costa Rica5 Barbados4 Sri Lanka1 Norway
Grandparents responsible for own grandchildren in Worcester
Grandparents (30 to 59 years) White / Caucasian 45 14.8% Responsible for grandchildren260 85.2% Not responsible for grandchildrenBlack or African American 49 38.4% Responsible for grandchildren78 61.6% Not responsible for grandchildrenAmerican Indian / Alaska Native 27 96.2% Responsible for grandchildren1 3.8% Not responsible for grandchildrenAsian 65 41.5% Responsible for grandchildren92 58.5% Not responsible for grandchildrenOther race 69 42.7% Responsible for grandchildren92 57.3% Not responsible for grandchildrenTwo or more races 148 58.0% Responsible for grandchildren107 42.0% Not responsible for grandchildrenWhite alone, not Hispanic / Latino 45 14.8% Responsible for grandchildren260 85.2% Not responsible for grandchildrenHispanic or Latino 285 59.6% Responsible for grandchildren193 40.4% Not responsible for grandchildrenGrandparents (60 years and over) White / Caucasian 572 48.1% Responsible for grandchildren617 51.9% Not responsible for grandchildrenBlack or African American 130 36.7% Responsible for grandchildren224 63.3% Not responsible for grandchildrenAmerican Indian / Alaska Native 47 100.0% Not responsible for grandchildrenAsian 13 5.3% Responsible for grandchildren233 94.7% Not responsible for grandchildrenOther race 45 26.5% Responsible for grandchildren126 73.5% Not responsible for grandchildrenTwo or more races 8 5.7% Responsible for grandchildren126 94.3% Not responsible for grandchildrenWhite alone, not Hispanic / Latino 572 48.1% Responsible for grandchildren617 51.9% Not responsible for grandchildrenHispanic or Latino 84 17.2% Responsible for grandchildren404 82.8% Not responsible for grandchildren
Zip codes: 01545 , 01583 , 01602 , 01603 , 01604 , 01605 , 01606 , 01607 , 01608 , 01609 , 01610 .