Estimated zip code population in 2022: 19,875 Zip code population in 2010: 17,711 Zip code population in 2000: 16,458
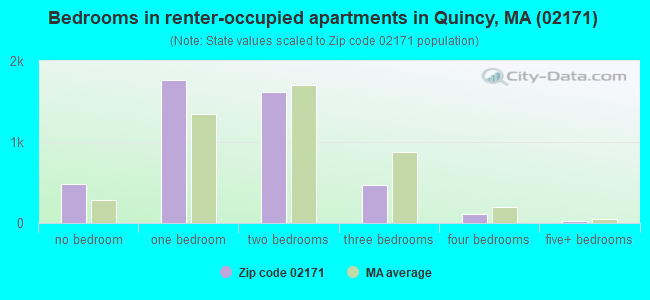
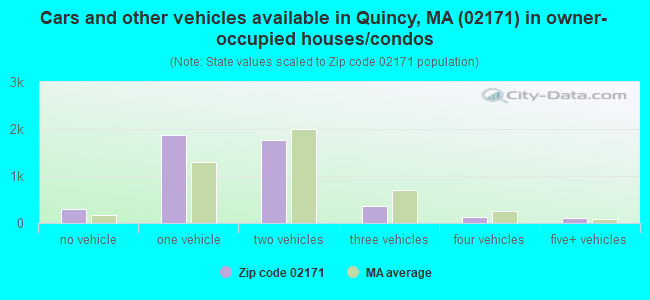
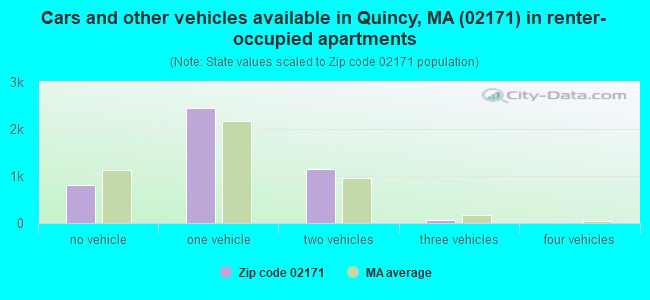
Houses and condos: 9,501 Renter-occupied apartments: 4,477
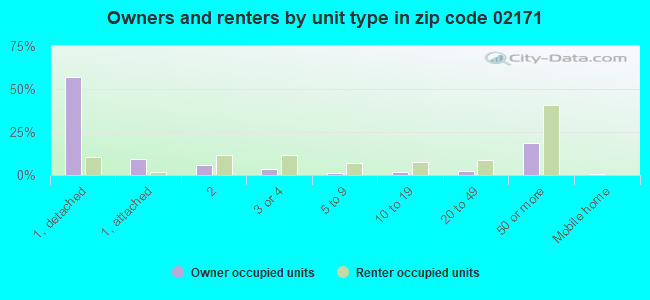
% of renters here:
50%
State:
38%
March 2022 cost of living index in zip code 02171: 136.8 (high, U.S. average is 100)
Land area: 2.5 sq. mi. Water area: 1.9 sq. mi.
Population density: 8,096 people per square mile
(high).
OSM Map
Google Map
MSN Map
OSM Map
General Map
Google Map
MSN Map
OSM Map
Google Map
MSN Map
OSM Map
Google Map
MSN Map
Please wait while loading the map...
Real estate property taxes paid for housing units in 2022:
This zip code:
1.0% ($6,581)
Massachusetts:
1.0% ($5,536)
Median real estate property taxes paid for housing units with mortgages in 2022: $6,330 (1.0%) Median real estate property taxes paid for housing units with no mortgage in 2022: $6,964 (1.1%)
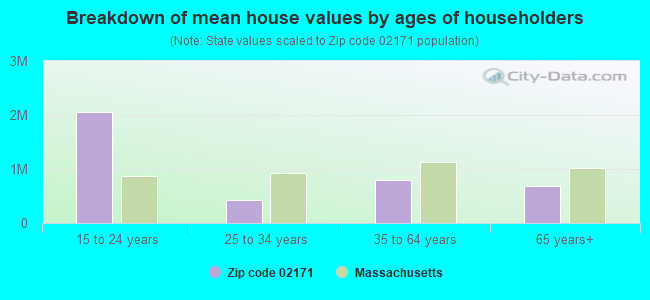
Estimated median house/condo value in 2022: $662,436
02171:
$662,436
Massachusetts:
$534,700
According to our research of Massachusetts and other state lists, there were 4 registered sex offenders living in 02171 zip code as of April 27, 2024. The ratio of all residents to sex offenders in zip code 02171 is 4,539 to 1. The ratio of registered sex offenders to all residents in this zip code is much lower than the state average.
Median resident age:
This zip code:
41.5 years
Massachusetts median age:
40.3 years
Average household size:
This zip code:
2.2 people
Massachusetts:
2.4 people
Averages for the 2020 tax year for zip code 02171, filed in 2021:
Average Adjusted Gross Income (AGI) in 2020: $86,898 (Individual Income Tax Returns)
Here:
$86,898
State:
$105,130
Salary/wage: $72,892 (reported on 83.4% of returns)
Here:
$72,892
State:
$82,951
(% of AGI for various income ranges: 1134.6% for AGIs below $25k, 3675.1% for AGIs $25k-50k, 6858.6% for AGIs $50k-75k, 10610.0% for AGIs $75k-100k, 19211.9% for AGIs $100k-200k, 102250.0% for AGIs over 200k)
Taxable interest for individuals: $1,666 (reported on 37.8% of returns)
This zip code:
$1,666
Massachusetts:
$2,361
(% of AGI for various income ranges: 24.6% for AGIs below $25k, 28.7% for AGIs $25k-50k, 47.1% for AGIs $50k-75k, 68.7% for AGIs $75k-100k, 144.9% for AGIs $100k-200k, 1597.1% for AGIs over 200k)
Ordinary dividends: $4,950 (reported on 25.3% of returns)
Here:
$4,950
State:
$10,365
(% of AGI for various income ranges: 34.3% for AGIs below $25k, 36.0% for AGIs $25k-50k, 65.6% for AGIs $50k-75k, 105.8% for AGIs $75k-100k, 381.5% for AGIs $100k-200k, 3307.6% for AGIs over 200k)
Net capital gain/loss in AGI: +$25,424 (reported on 24.0% of returns)
Here:
+$25,424
State:
+$48,178
(% of AGI for various income ranges: 15.4% for AGIs below $25k, 56.4% for AGIs $25k-50k, 89.5% for AGIs $50k-75k, 192.5% for AGIs $75k-100k, 810.1% for AGIs $100k-200k, 25854.3% for AGIs over 200k)
Profit/loss from business: +$14,541 (reported on 14.2% of returns)
Here:
+$14,541
State:
+$20,792
(% of AGI for various income ranges: 135.3% for AGIs below $25k, 154.6% for AGIs $25k-50k, 192.0% for AGIs $50k-75k, 192.7% for AGIs $75k-100k, 539.5% for AGIs $100k-200k, 3913.8% for AGIs over 200k)
Taxable individual retirement arrangement distribution: $23,615 (reported on 7.9% of returns)
02171:
$23,615
Massachusetts:
$22,790
(% of AGI for various income ranges: 59.5% for AGIs below $25k, 72.2% for AGIs $25k-50k, 188.4% for AGIs $50k-75k, 279.9% for AGIs $75k-100k, 757.0% for AGIs $100k-200k, 2766.2% for AGIs over 200k)
Self-employed (Keogh) retirement plans: $20,150 (reported on 0.6% of returns)
02171:
$20,150
Massachusetts:
$26,868
(% of AGI for various income ranges: 46.6% for AGIs $100k-200k, 351.4% for AGIs over 200k)
Total itemized deductions: $26,442 (reported on 11.7% of returns)
Here:
$26,442
State:
$36,722
(% of AGI for various income ranges: 88.2% for AGIs below $25k, 132.0% for AGIs $25k-50k, 290.0% for AGIs $50k-75k, 505.2% for AGIs $75k-100k, 1186.2% for AGIs $100k-200k, 4842.4% for AGIs over 200k)
Charity contributions: $4,073 (reported on 9.2% of returns)
Here:
$4,073
State:
$12,529
(% of AGI for various income ranges: 3.2% for AGIs below $25k, 8.5% for AGIs $25k-50k, 17.8% for AGIs $50k-75k, 57.2% for AGIs $75k-100k, 120.4% for AGIs $100k-200k, 942.4% for AGIs over 200k)
Taxes paid: $9,078 (reported on 11.7% of returns)
02171:
$9,078
State:
$8,782
(% of AGI for various income ranges: 26.2% for AGIs below $25k, 39.4% for AGIs $25k-50k, 103.9% for AGIs $50k-75k, 193.0% for AGIs $75k-100k, 449.8% for AGIs $100k-200k, 1437.1% for AGIs over 200k)
Earned income credit: $1,670 (reported on 10.7% of returns)
Here:
$1,670
State:
$1,909
(% of AGI for various income ranges: 65.9% for AGIs below $25k, 49.4% for AGIs $25k-50k)
Percentage of individuals using paid preparers for their 2020 taxes: 91.7%
Here:
92%
State:
92%
(% for various income ranges: 90.1% for AGIs below $25k, 91.6% for AGIs $25k-50k, 92.1% for AGIs $50k-75k, 92.8% for AGIs $75k-100k, 92.5% for AGIs $100k-200k, 93.6% for AGIs over 200k)
Averages for the 2012 tax year for zip code 02171, filed in 2013:
Average Adjusted Gross Income (AGI) in 2012: $63,811 (Individual Income Tax Returns)
Here:
$63,811
State:
$81,425
Salary/wage: $57,387 (reported on 85.1% of returns)
Here:
$57,387
State:
$64,752
(% of AGI for various income ranges: 75.2% for AGIs below $25k, 82.5% for AGIs $25k-50k, 80.9% for AGIs $50k-75k, 80.3% for AGIs $75k-100k, 81.2% for AGIs $100k-200k, 62.1% for AGIs over 200k)
Taxable interest for individuals: $1,090 (reported on 41.6% of returns)
This zip code:
$1,090
Massachusetts:
$2,136
(% of AGI for various income ranges: 1.0% for AGIs below $25k, 0.7% for AGIs $25k-50k, 0.6% for AGIs $50k-75k, 0.6% for AGIs $75k-100k, 0.4% for AGIs $100k-200k, 1.2% for AGIs over 200k)
Ordinary dividends: $3,519 (reported on 22.6% of returns)
Here:
$3,519
State:
$9,473
(% of AGI for various income ranges: 1.4% for AGIs below $25k, 0.9% for AGIs $25k-50k, 1.0% for AGIs $50k-75k, 1.0% for AGIs $75k-100k, 1.0% for AGIs $100k-200k, 2.0% for AGIs over 200k)
Net capital gain/loss in AGI: +$10,986 (reported on 17.4% of returns)
Here:
+$10,986
State:
+$31,437
(% of AGI for various income ranges: 0.2% for AGIs $25k-50k, 0.2% for AGIs $50k-75k, 0.3% for AGIs $75k-100k, 1.0% for AGIs $100k-200k, 11.6% for AGIs over 200k)
Profit/loss from business: +$15,942 (reported on 12.1% of returns)
Here:
+$15,942
State:
+$20,662
(% of AGI for various income ranges: 7.9% for AGIs below $25k, 3.6% for AGIs $25k-50k, 2.1% for AGIs $50k-75k, 2.5% for AGIs $75k-100k, 2.3% for AGIs $100k-200k, 3.2% for AGIs over 200k)
Taxable individual retirement arrangement distribution: $18,354 (reported on 9.4% of returns)
02171:
$18,354
Massachusetts:
$18,892
(% of AGI for various income ranges: 3.3% for AGIs below $25k, 1.9% for AGIs $25k-50k, 2.3% for AGIs $50k-75k, 2.5% for AGIs $75k-100k, 2.8% for AGIs $100k-200k, 3.3% for AGIs over 200k)
Self-employment retirement plans: $18,740 (reported on 0.5% of returns)
02171:
$18,740
Massachusetts:
$20,669
Total itemized deductions: $22,102 (19% of AGI, reported on 34.5% of returns)
Here:
$22,102
State:
$28,907
Here:
19.0% of AGI
State:
18.2% of AGI
(% of AGI for various income ranges: 10.5% for AGIs below $25k, 8.9% for AGIs $25k-50k, 10.7% for AGIs $50k-75k, 12.7% for AGIs $75k-100k, 14.5% for AGIs $100k-200k, 11.6% for AGIs over 200k)
Charity contributions: $2,133 (reported on 27.7% of returns)
Here:
$2,133
State:
$4,208
(% of AGI for various income ranges: 0.5% for AGIs below $25k, 0.6% for AGIs $25k-50k, 0.9% for AGIs $50k-75k, 1.0% for AGIs $75k-100k, 1.1% for AGIs $100k-200k, 1.1% for AGIs over 200k)
Taxes paid: $10,231 (reported on 34.4% of returns)
02171:
$10,231
State:
$13,303
(% of AGI for various income ranges: 3.0% for AGIs below $25k, 3.1% for AGIs $25k-50k, 4.2% for AGIs $50k-75k, 5.5% for AGIs $75k-100k, 7.0% for AGIs $100k-200k, 6.8% for AGIs over 200k)
Earned income credit: $1,801 (reported on 14.1% of returns)
Here:
$1,801
State:
$1,971
(% of AGI for various income ranges: 4.8% for AGIs below $25k, 0.7% for AGIs $25k-50k)
Percentage of individuals using paid preparers for their 2012 taxes: 54.4%
Here:
54%
State:
56%
(% for various income ranges: 54.8% for AGIs below $25k, 50.0% for AGIs $25k-50k, 52.1% for AGIs $50k-75k, 54.9% for AGIs $75k-100k, 58.3% for AGIs $100k-200k, 75.7% for AGIs over 200k)
Averages for the 2004 tax year for zip code 02171, filed in 2005:
Average Adjusted Gross Income (AGI) in 2004: $54,837 (Individual Income Tax Returns)
Here:
$54,837
State:
$62,877
Salary/wage: $48,581 (reported on 85.2% of returns)
Here:
$48,581
State:
$52,969
(% of AGI for various income ranges: 104.9% for AGIs below $10k, 73.3% for AGIs $10k-25k, 82.9% for AGIs $25k-50k, 82.6% for AGIs $50k-75k, 85.4% for AGIs $75k-100k, 65.6% for AGIs over 100k)
Taxable interest for individuals: $1,595 (reported on 56.4% of returns)
This zip code:
$1,595
Massachusetts:
$1,945
(% of AGI for various income ranges: 5.2% for AGIs below $10k, 3.0% for AGIs $10k-25k, 1.4% for AGIs $25k-50k, 1.2% for AGIs $50k-75k, 1.2% for AGIs $75k-100k, 1.8% for AGIs over 100k)
Taxable dividends: $2,422 (reported on 27.5% of returns)
Here:
$2,422
State:
$5,323
(% of AGI for various income ranges: 2.9% for AGIs below $10k, 1.6% for AGIs $10k-25k, 0.8% for AGIs $25k-50k, 0.9% for AGIs $50k-75k, 0.9% for AGIs $75k-100k, 1.5% for AGIs over 100k)
Net capital gain/loss: +$13,513 (reported on 22.2% of returns)
Here:
+$13,513
State:
+$20,377
(% of AGI for various income ranges: -1.8% for AGIs below $10k, -0.1% for AGIs $10k-25k, -0.1% for AGIs $25k-50k, 0.5% for AGIs $50k-75k, 1.3% for AGIs $75k-100k, 12.4% for AGIs over 100k)
Profit/loss from business: +$17,091 (reported on 11.7% of returns)
Here:
+$17,091
State:
+$17,837
(% of AGI for various income ranges: 12.3% for AGIs below $10k, 6.7% for AGIs $10k-25k, 2.8% for AGIs $25k-50k, 2.3% for AGIs $50k-75k, 2.2% for AGIs $75k-100k, 4.4% for AGIs over 100k)
IRA payment deduction: $3,354 (reported on 3.1% of returns)
02171:
$3,354
Massachusetts:
$3,100
(% of AGI for various income ranges: 0.4% for AGIs $10k-25k, 0.4% for AGIs $25k-50k, 0.2% for AGIs $50k-75k, 0.2% for AGIs $75k-100k, 0.1% for AGIs over 100k)
Self-employed pension: $15,600 (reported on 1.0% of returns)
Here:
$15,600
Massachusetts:
$14,516
Total itemized deductions: $19,667 (20% of AGI, reported on 36.8% of returns)
Here:
$19,667
State:
$22,573
Here:
20.1% of AGI
State:
19.5% of AGI
(% of AGI for various income ranges: 14.4% for AGIs below $10k, 11.2% for AGIs $10k-25k, 11.0% for AGIs $25k-50k, 13.4% for AGIs $50k-75k, 16.0% for AGIs $75k-100k, 13.6% for AGIs over 100k)
Charity contributions deductions: $2,347 (2% of AGI, reported on 32.4% of returns)
Here:
$2,347
State:
$3,295
Here:
2.3% of AGI
State:
2.7% of AGI
(% of AGI for various income ranges: 0.8% for AGIs below $10k, 0.8% for AGIs $10k-25k, 0.9% for AGIs $25k-50k, 1.3% for AGIs $50k-75k, 1.6% for AGIs $75k-100k, 1.7% for AGIs over 100k)
Total tax: $9,596 (reported on 80.3% of returns)
02171:
$9,596
State:
$11,494
(% of AGI for various income ranges: 3.4% for AGIs below $10k, 4.6% for AGIs $10k-25k, 8.4% for AGIs $25k-50k, 11.4% for AGIs $50k-75k, 12.4% for AGIs $75k-100k, 19.9% for AGIs over 100k)
Earned income credit: $1,390 (reported on 11.4% of returns)
Here:
$1,390
State:
$1,518
Percentage of individuals using paid preparers for their 2004 taxes: 55.3%
Here:
55%
State:
58%
(% for various income ranges: 45.7% for AGIs below $10k, 55.7% for AGIs $10k-25k, 51.7% for AGIs $25k-50k, 56.5% for AGIs $50k-75k, 60.9% for AGIs $75k-100k, 71.9% for AGIs over 100k)
Likely homosexual households (counted as self-reported same-sex unmarried-partner households)
Lesbian couples: 0.1% of all households
Gay men: 0.1% of all households
Household received Food Stamps/SNAP in the past 12 months: 1,177 Household did not receive Food Stamps/SNAP in the past 12 months: 7,744
Women who had a birth in the past 12 months: 102 (107 now married, 0 unmarried) Women who did not have a birth in the past 12 months: 4,556 (1,790 now married, 2,758 unmarried)
Housing units in zip code 02171 with a mortgage: 2,564 (262 second mortgage, 267 both second mortgage and home equity loan) Houses without a mortgage: 20
Median monthly owner costs for units with a mortgage: $2,816 Median monthly owner costs for units without a mortgage: $1,079
Residents with income below the poverty level in 2022:
This zip code:
11.9%
Whole state:
10.4%
Residents with income below 50% of the poverty level in 2022:
This zip code:
7.3%
Whole state:
5.1%
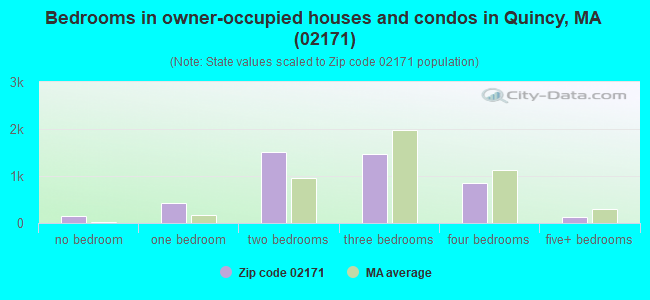
Median number of rooms in houses and condos:
Here:
5.6
State:
6.5
Median number of rooms in apartments:
Here:
3.4
State:
4.0
Notable locations in this zip code not listed on our city pages
Notable locations in zip code 02171: Boston Harbor Marina (A), Quincy Fire Department Station 2 (B), Quincy Fire Department Station 7 (C), North Quincy Branch Library Thomas Crane Public Library (D). Display/hide their locations on the map
Churches in zip code 02171 include: Sacred Heart Church (A), Memorial Congregational Church (B), Good Shepherd Lutheran Church (C), First Church of Squantum Congregation (D). Display/hide their locations on the map
1,910 married couples with children.
483 single-parent households (101 men, 382 women).
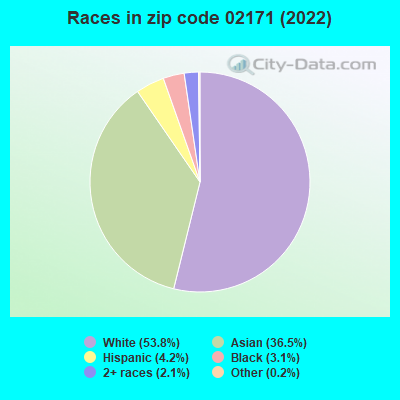
58.1% of residents of 02171 zip code speak English at home.
2.8% of residents speak Spanish at home (77% very well, 8% well, 14% not well, 1% not at all).
5.6% of residents speak other Indo-European language at home (63% very well, 25% well, 8% not well, 5% not at all).
31.8% of residents speak Asian or Pacific Island language at home (36% very well, 25% well, 28% not well, 10% not at all).
2.6% of residents speak other language at home (64% very well, 33% well, 2% not well, 1% not at all).
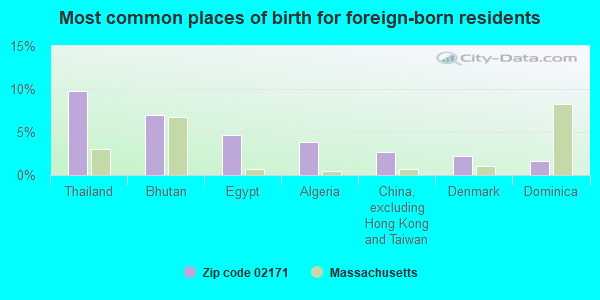
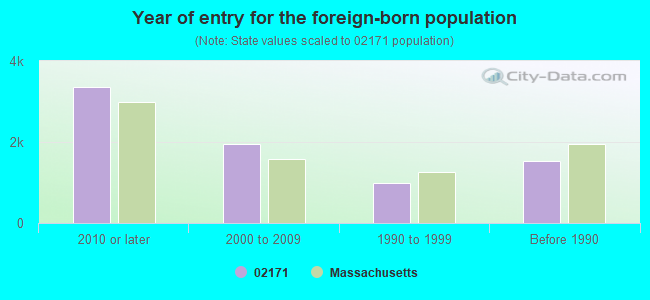
Foreign born population: 7,526 (37.9%) (55.2% of them are naturalized citizens)
Major facilities with environmental interests located in this zip code:
AFLATOXIN TESTING LABS (5 HAYWARD ST in QUINCY, MA)
AIR MINOR (AIRS/AFS) CRITERIA AND HAZARDOUS AIR POLLUTANT INVENTORY (Inventory of air pollution sources) (Resource Conservation and Recovery Act (tracking hazardous waste)) Business SIC classification: REAL ESTATE AGENTS AND MANAGERS Organizations: SHUSTER LABS (CONTACT/OPERATOR)
, SHUSTER V HERBERT INC DIV OF HAUSER CHEM (CONTACT/OWNER)
Alternative names: DEVON REALTY TRUST, SHUSTER HERBERT V INC DIV HAUSER CHEM
ATLANTIC MIDDLE (86 HOLLIS AVENUE in QUINCY, MA)
(National Center for Education Statistics) - STATE ID-243305 Organizations: QUINCY (SCHOOL DISTRICT)
MONTCLAIR (8 BELMONT STREET in QUINCY, MA)
(National Center for Education Statistics) - STATE ID-243065 Organizations: QUINCY (SCHOOL DISTRICT)
NORTH QUINCY HIGH SCHOOL (316 HANCOCK STREET in QUINCY, MA)
(National Center for Education Statistics) - STATE ID-243510
BOSTON GEAR DIVISION (14 HAYWARD STREET in QUINCY, MA)
AIR MINOR (AIRS/AFS) Conditionally Exempt Small Quantity Generators, less than 100 kg/month of hazardous waste (Resource Conservation and Recovery Act (tracking hazardous waste)) - notification Business SIC classification: SPEED CHANGERS, INDUSTRIAL HIGH-SPEED DRIVES, AND GEARS Business NAICS classification: SPEED CHANGER, INDUSTRIAL HIGH-SPEED DRIVE, AND GEAR MANUFACTURING. Organizations: BOSTON GEAR INCOM INTERNATIONAL INC (CONTACT/OWNER)
Alternative names: BOSTON GEAR INCOM INTERNATIONAL INC
MATHEWSON CORPORATION (2 HANCOCK ST in QUINCY, MA)
AIR MINOR (AIRS/AFS) Small Quantity Generators, between 100 kg and 1000 kg of hazardous waste/month (Resource Conservation and Recovery Act (tracking hazardous waste)) - notification Business SIC classification: FABRICATED METAL PRODUCTS Business NAICS classification: OTHER ENGINE EQUIPMENT MANUFACTURING. Organizations: R M MATHEWSON (CONTACT/OWNER)
BROOKS PHARMACY (475 HANCOCK ST in QUINCY, MA)
(Resource Conservation and Recovery Act (tracking hazardous waste)) Organizations: MAXI DRUG INC (CONTACT/OWNER)
Alternative names: BROOKS PHARMACY 561, OSCO DRUG NO 0364
ARCH GEAR WORKS INC (97-103 HOLMES ST in QUINCY, MA)
(Resource Conservation and Recovery Act (tracking hazardous waste)) Business NAICS classification: SPEED CHANGER, INDUSTRIAL HIGH-SPEED DRIVE, AND GEAR MANUFACTURING. Organizations: ARCH FAMILY (CONTACT/OWNER)
AYERS BROS AUTO BODY INC (44 OB EAST SQUANTUM ST in QUINCY, MA)
BAY SHORE APARTMENTS (175 QUINCY SHORE DRIVE in QUINCY, MA)
AIR MINOR (AIRS/AFS) CRITERIA AND HAZARDOUS AIR POLLUTANT INVENTORY (Inventory of air pollution sources) Business SIC classification: OPERATORS OF APARTMENT BUILDINGS Alternative names: BAY SHORE APTS
BOSTON SCIENTIFIC CORP (500 COMMANDER SHEA BLVD in QUINCY, MA)
AIR MINOR (AIRS/AFS) CRITERIA AND HAZARDOUS AIR POLLUTANT INVENTORY (Inventory of air pollution sources) Business SIC classification: MANAGEMENT SERVICES
COASTAL AIR HEAT & REFRIGERATION (745 E. SQUANTUM ST in QUINCY, MA)
AIR MINOR (AIRS/AFS) ENFORCEMENT/COMPLIANCE ACTIVITY (Integrated Compliance Information System) Business SIC classification: WARM AIR HEATING AND AIR-CONDITIONING EQUIPMENT AND SUPPLIES
Housing units lacking complete plumbing facilities: 0.2% Housing units lacking complete kitchen facilities: 0.7%
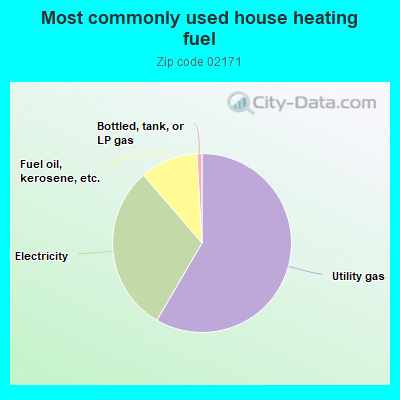
58.3%Utility gas
30.2%Electricity
10.4%Fuel oil, kerosene, etc.
0.9%Bottled, tank, or LP gas
Population in 1990: 18,251.
Place of birth for U.S.-born residents:
This state: 9,444
Northeast: 1,531
Midwest: 308
South: 517
West: 381
63% of the 02171 zip code residents lived in the same house 5 years ago. Out of people who lived in different houses, 51% lived in this county. Out of people who lived in different counties, 50% lived in Massachusetts.
86% of the 02171 zip code residents lived in the same house 1 year ago. Out of people who lived in different houses, 29% moved from this county. Out of people who lived in different houses, 34% moved from different county within same state. Out of people who lived in different houses, 21% moved from different state. Out of people who lived in different houses, 21% moved from abroad.
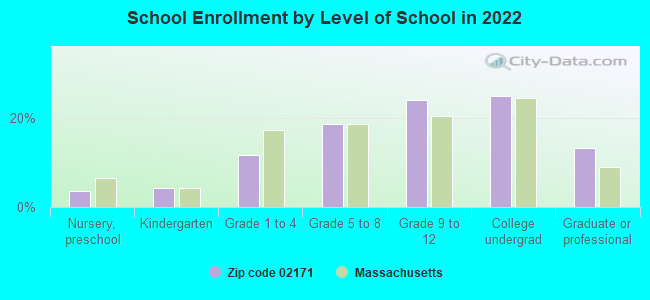
Private vs. public school enrollment:
Students in private schools in grades 1 to 8 (elementary and middle school): 57
Here:
4.9%
Massachusetts:
10.3%
Students in private schools in grades 9 to 12 (high school): 172
Here:
18.3%
Massachusetts:
12.3%
Students in private undergraduate colleges: 443
Here:
45.4%
Massachusetts:
51.2%
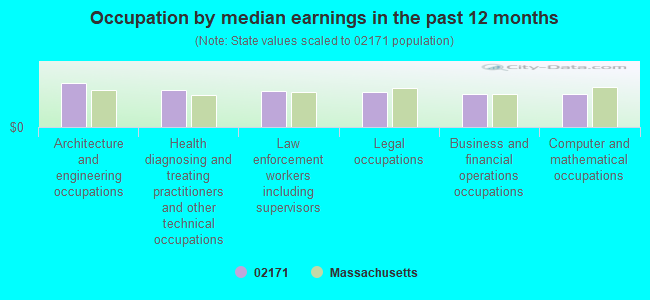
Occupation by median earnings in the past 12 months ($)
125,092Architecture and engineering occupations
104,082Health diagnosing and treating practitioners and other technical occupations
101,226Law enforcement workers including supervisors
99,154Legal occupations
94,535Business and financial operations occupations
93,000Computer and mathematical occupations
Companies with federal contracts located in this zip code:
KERRI MCDONOUGH (72 ELLIOT AVENUE in QUINCY, MA; small business)
$40,800 with Navy for Dentistry Services. Taking place in CA. Signed on 2001-01-30. Completion date: 2001-09-30.
GARWETH CORPORATION (144 QUINCY SHORE DRIVE SUI in QUINCY, MA; small business)
$7,500 with Army for Construction of Structures and Facilities -- Electronic and Communications Facilities. Signed on 2001-09-21. Completion date: 2001-11-09.
Top industries in this zip code by the number of employees in 2005:
Finance and Insurance: Direct Health and Medical Insurance Carriers (500-999 employees: 2 establishments, 20-49 employees: 1 establishment)
Finance and Insurance: Trust, Fiduciary, and Custody Activities (over 1000: 1)
Health Care and Social Assistance: Vocational Rehabilitation Services (500-999: 1)
2002 - 2018 National Fire Incident Reporting System (NFIRS) incidents
According to the data from the years 2002 - 2018 the average number of fires per year is 105. The highest number of fire incidents - 146 took place in 2002, and the least - 85 in 2009. The data has a declining trend.
When looking into fire subcategories, the most reports belonged to: Structure Fires (54.5%), and Outside Fires (36.3%).
Fire incident types reported to NFIRS in Zip Code 02171


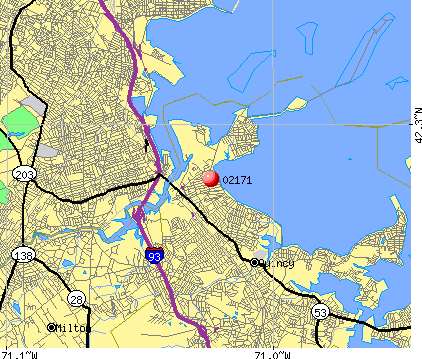 Nearest zip codes: 02122, 02170, 02125, 02127, 02169, 02124.


 According to the data from the years 2002 - 2018 the average number of fires per year is 105. The highest number of fire incidents - 146 took place in 2002, and the least - 85 in 2009. The data has a declining trend.
 When looking into fire subcategories, the most reports belonged to: Structure Fires (54.5%), and Outside Fires (36.3%).