Estimated zip code population in 2022: 15,016 Zip code population in 2010: 13,982 Zip code population in 2000: 13,999
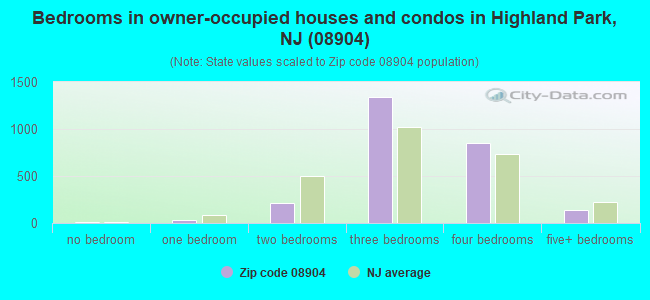
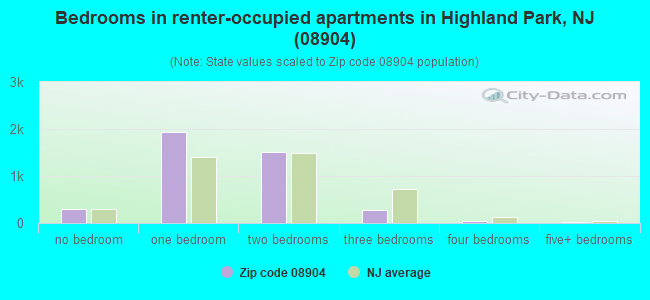
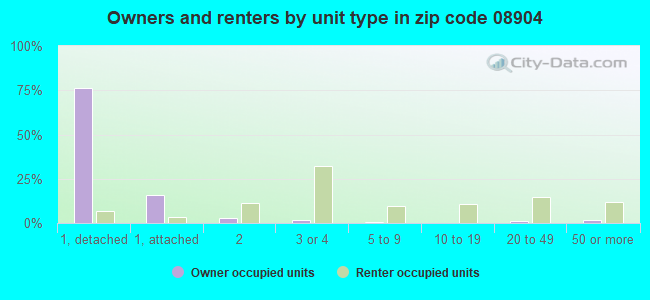
Houses and condos: 6,995 Renter-occupied apartments: 4,040
% of renters here:
61%
State:
35%
March 2022 cost of living index in zip code 08904: 120.3 (high, U.S. average is 100)
Land area: 1.8 sq. mi. Water area: 0.0 sq. mi.
Population density: 8,289 people per square mile
(high).
OSM Map
Google Map
MSN Map
OSM Map
General Map
Google Map
MSN Map
OSM Map
Google Map
MSN Map
OSM Map
Google Map
MSN Map
Please wait while loading the map...
Real estate property taxes paid for housing units in 2022:
This zip code:
2.1% ($9,521)
New Jersey:
2.1% ($8,897)
Median real estate property taxes paid for housing units with mortgages in 2022: $9,557 (2.1%) Median real estate property taxes paid for housing units with no mortgage in 2022: $9,483 (2.3%)
Estimated median house/condo value in 2022: $449,736
08904:
$449,736
New Jersey:
$428,900
According to our research of New Jersey and other state lists, there was 1 registered sex offender living in 08904 zip code as of April 26, 2024. The ratio of all residents to sex offenders in zip code 08904 is 14,449 to 1. The ratio of registered sex offenders to all residents in this zip code is much lower than the state average.
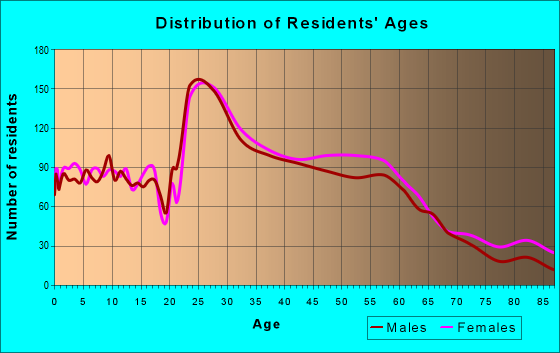
Median resident age:
This zip code:
34.6 years
New Jersey median age:
40.4 years
Average household size:
This zip code:
2.2 people
New Jersey:
2.6 people
Averages for the 2020 tax year for zip code 08904, filed in 2021:
Average Adjusted Gross Income (AGI) in 2020: $88,975 (Individual Income Tax Returns)
Here:
$88,975
State:
$95,247
Salary/wage: $77,077 (reported on 83.6% of returns)
Here:
$77,077
State:
$80,635
(% of AGI for various income ranges: 1254.8% for AGIs below $25k, 3866.7% for AGIs $25k-50k, 7330.1% for AGIs $50k-75k, 10734.1% for AGIs $75k-100k, 20769.7% for AGIs $100k-200k, 82086.8% for AGIs over 200k)
Taxable interest for individuals: $2,116 (reported on 36.6% of returns)
This zip code:
$2,116
New Jersey:
$2,414
(% of AGI for various income ranges: 26.7% for AGIs below $25k, 32.4% for AGIs $25k-50k, 44.9% for AGIs $50k-75k, 76.6% for AGIs $75k-100k, 328.8% for AGIs $100k-200k, 1015.0% for AGIs over 200k)
Ordinary dividends: $8,986 (reported on 31.2% of returns)
Here:
$8,986
State:
$8,057
(% of AGI for various income ranges: 47.7% for AGIs below $25k, 56.5% for AGIs $25k-50k, 132.0% for AGIs $50k-75k, 255.0% for AGIs $75k-100k, 908.9% for AGIs $100k-200k, 5238.6% for AGIs over 200k)
Net capital gain/loss in AGI: +$15,163 (reported on 28.5% of returns)
Here:
+$15,163
State:
+$25,022
(% of AGI for various income ranges: 58.0% for AGIs below $25k, 53.8% for AGIs $25k-50k, 121.7% for AGIs $50k-75k, 268.0% for AGIs $75k-100k, 769.5% for AGIs $100k-200k, 10686.8% for AGIs over 200k)
Profit/loss from business: +$17,613 (reported on 18.5% of returns)
Here:
+$17,613
State:
+$18,035
(% of AGI for various income ranges: 152.3% for AGIs below $25k, 224.1% for AGIs $25k-50k, 235.3% for AGIs $50k-75k, 381.6% for AGIs $75k-100k, 784.8% for AGIs $100k-200k, 4991.8% for AGIs over 200k)
Taxable individual retirement arrangement distribution: $24,949 (reported on 7.5% of returns)
08904:
$24,949
New Jersey:
$21,558
(% of AGI for various income ranges: 26.0% for AGIs below $25k, 57.2% for AGIs $25k-50k, 148.7% for AGIs $50k-75k, 280.9% for AGIs $75k-100k, 754.7% for AGIs $100k-200k, 2542.7% for AGIs over 200k)
Self-employed (Keogh) retirement plans: $21,800 (reported on 1.4% of returns)
08904:
$21,800
New Jersey:
$30,844
(% of AGI for various income ranges: 87.8% for AGIs $100k-200k, 735.5% for AGIs over 200k)
Total itemized deductions: $32,987 (reported on 12.2% of returns)
Here:
$32,987
State:
$32,863
(% of AGI for various income ranges: 81.0% for AGIs below $25k, 203.5% for AGIs $25k-50k, 344.4% for AGIs $50k-75k, 671.1% for AGIs $75k-100k, 1458.9% for AGIs $100k-200k, 5227.3% for AGIs over 200k)
Charity contributions: $8,980 (reported on 10.2% of returns)
Here:
$8,980
State:
$7,880
(% of AGI for various income ranges: 4.5% for AGIs below $25k, 22.3% for AGIs $25k-50k, 33.4% for AGIs $50k-75k, 78.4% for AGIs $75k-100k, 291.6% for AGIs $100k-200k, 1800.9% for AGIs over 200k)
Taxes paid: $9,396 (reported on 12.1% of returns)
08904:
$9,396
State:
$9,183
(% of AGI for various income ranges: 23.3% for AGIs below $25k, 45.1% for AGIs $25k-50k, 126.6% for AGIs $50k-75k, 249.8% for AGIs $75k-100k, 455.6% for AGIs $100k-200k, 1191.8% for AGIs over 200k)
Earned income credit: $1,860 (reported on 11.0% of returns)
Here:
$1,860
State:
$2,148
(% of AGI for various income ranges: 72.5% for AGIs below $25k, 49.8% for AGIs $25k-50k)
Percentage of individuals using paid preparers for their 2020 taxes: 92.1%
Here:
92%
State:
92%
(% for various income ranges: 90.2% for AGIs below $25k, 92.1% for AGIs $25k-50k, 92.4% for AGIs $50k-75k, 91.4% for AGIs $75k-100k, 93.8% for AGIs $100k-200k, 94.7% for AGIs over 200k)
Averages for the 2012 tax year for zip code 08904, filed in 2013:
Average Adjusted Gross Income (AGI) in 2012: $74,965 (Individual Income Tax Returns)
Here:
$74,965
State:
$79,688
Salary/wage: $65,144 (reported on 84.6% of returns)
Here:
$65,144
State:
$68,122
(% of AGI for various income ranges: 76.1% for AGIs below $25k, 85.6% for AGIs $25k-50k, 80.4% for AGIs $50k-75k, 76.3% for AGIs $75k-100k, 76.7% for AGIs $100k-200k, 61.7% for AGIs over 200k)
Taxable interest for individuals: $1,936 (reported on 44.6% of returns)
This zip code:
$1,936
New Jersey:
$2,193
(% of AGI for various income ranges: 2.0% for AGIs below $25k, 0.8% for AGIs $25k-50k, 0.9% for AGIs $50k-75k, 1.3% for AGIs $75k-100k, 1.0% for AGIs $100k-200k, 1.4% for AGIs over 200k)
Ordinary dividends: $8,067 (reported on 31.6% of returns)
Here:
$8,067
State:
$6,828
(% of AGI for various income ranges: 3.2% for AGIs below $25k, 1.1% for AGIs $25k-50k, 2.1% for AGIs $50k-75k, 2.8% for AGIs $75k-100k, 3.0% for AGIs $100k-200k, 5.4% for AGIs over 200k)
Net capital gain/loss in AGI: +$9,217 (reported on 23.3% of returns)
Here:
+$9,217
State:
+$15,358
(% of AGI for various income ranges: 0.5% for AGIs $50k-75k, 0.8% for AGIs $75k-100k, 0.8% for AGIs $100k-200k, 8.0% for AGIs over 200k)
Profit/loss from business: +$18,456 (reported on 17.3% of returns)
Here:
+$18,456
State:
+$19,577
(% of AGI for various income ranges: 8.9% for AGIs below $25k, 3.6% for AGIs $25k-50k, 3.1% for AGIs $50k-75k, 2.8% for AGIs $75k-100k, 4.4% for AGIs $100k-200k, 4.7% for AGIs over 200k)
Taxable individual retirement arrangement distribution: $21,090 (reported on 9.6% of returns)
08904:
$21,090
New Jersey:
$18,214
(% of AGI for various income ranges: 1.8% for AGIs below $25k, 1.2% for AGIs $25k-50k, 1.8% for AGIs $50k-75k, 2.9% for AGIs $75k-100k, 2.6% for AGIs $100k-200k, 3.9% for AGIs over 200k)
Self-employment retirement plans: $22,855 (reported on 1.7% of returns)
08904:
$22,855
New Jersey:
$24,511
Total itemized deductions: $29,978 (22% of AGI, reported on 39.3% of returns)
Here:
$29,978
State:
$30,827
Here:
22.2% of AGI
State:
21.2% of AGI
(% of AGI for various income ranges: 14.2% for AGIs below $25k, 10.2% for AGIs $25k-50k, 11.8% for AGIs $50k-75k, 16.2% for AGIs $75k-100k, 17.8% for AGIs $100k-200k, 17.4% for AGIs over 200k)
Charity contributions: $5,003 (reported on 33.4% of returns)
Here:
$5,003
State:
$3,451
(% of AGI for various income ranges: 0.8% for AGIs below $25k, 0.9% for AGIs $25k-50k, 1.1% for AGIs $50k-75k, 1.9% for AGIs $75k-100k, 2.2% for AGIs $100k-200k, 3.5% for AGIs over 200k)
Taxes paid: $15,590 (reported on 39.2% of returns)
08904:
$15,590
State:
$15,801
(% of AGI for various income ranges: 5.2% for AGIs below $25k, 3.6% for AGIs $25k-50k, 4.8% for AGIs $50k-75k, 7.5% for AGIs $75k-100k, 9.6% for AGIs $100k-200k, 10.5% for AGIs over 200k)
Earned income credit: $1,700 (reported on 10.1% of returns)
Here:
$1,700
State:
$2,182
(% of AGI for various income ranges: 3.7% for AGIs below $25k, 0.5% for AGIs $25k-50k)
Percentage of individuals using paid preparers for their 2012 taxes: 54.7%
Here:
55%
State:
65%
(% for various income ranges: 52.1% for AGIs below $25k, 50.3% for AGIs $25k-50k, 53.6% for AGIs $50k-75k, 57.4% for AGIs $75k-100k, 61.2% for AGIs $100k-200k, 65.1% for AGIs over 200k)
Averages for the 2004 tax year for zip code 08904, filed in 2005:
Average Adjusted Gross Income (AGI) in 2004: $63,168 (Individual Income Tax Returns)
Here:
$63,168
State:
$64,921
Salary/wage: $53,354 (reported on 83.5% of returns)
Here:
$53,354
State:
$57,755
(% of AGI for various income ranges: 143.4% for AGIs below $10k, 78.6% for AGIs $10k-25k, 87.2% for AGIs $25k-50k, 79.9% for AGIs $50k-75k, 80.3% for AGIs $75k-100k, 60.4% for AGIs over 100k)
Taxable interest for individuals: $2,418 (reported on 55.9% of returns)
This zip code:
$2,418
New Jersey:
$2,068
(% of AGI for various income ranges: 13.3% for AGIs below $10k, 3.2% for AGIs $10k-25k, 1.8% for AGIs $25k-50k, 2.4% for AGIs $50k-75k, 2.0% for AGIs $75k-100k, 1.9% for AGIs over 100k)
Taxable dividends: $5,981 (reported on 33.9% of returns)
Here:
$5,981
State:
$3,959
(% of AGI for various income ranges: 11.2% for AGIs below $10k, 1.9% for AGIs $10k-25k, 1.4% for AGIs $25k-50k, 2.3% for AGIs $50k-75k, 1.9% for AGIs $75k-100k, 4.2% for AGIs over 100k)
Net capital gain/loss: +$10,088 (reported on 27.0% of returns)
Here:
+$10,088
State:
+$13,591
(% of AGI for various income ranges: -4.6% for AGIs below $10k, -0.3% for AGIs $10k-25k, -0.2% for AGIs $25k-50k, 1.1% for AGIs $50k-75k, 1.1% for AGIs $75k-100k, 7.4% for AGIs over 100k)
Profit/loss from business: +$19,012 (reported on 15.7% of returns)
Here:
+$19,012
State:
+$17,520
(% of AGI for various income ranges: 15.2% for AGIs below $10k, 5.2% for AGIs $10k-25k, 2.8% for AGIs $25k-50k, 2.7% for AGIs $50k-75k, 2.6% for AGIs $75k-100k, 6.0% for AGIs over 100k)
IRA payment deduction: $3,064 (reported on 3.2% of returns)
08904:
$3,064
New Jersey:
$3,270
(% of AGI for various income ranges: 0.3% for AGIs $10k-25k, 0.3% for AGIs $25k-50k, 0.3% for AGIs $50k-75k, 0.2% for AGIs $75k-100k, 0.1% for AGIs over 100k)
Self-employed pension: $14,917 (reported on 1.9% of returns)
Here:
$14,917
New Jersey:
$17,258
(% of AGI for various income ranges: 0.3% for AGIs $50k-75k, 0.3% for AGIs $75k-100k, 0.7% for AGIs over 100k)
Total itemized deductions: $23,638 (21% of AGI, reported on 39.3% of returns)
Here:
$23,638
State:
$23,924
Here:
20.8% of AGI
State:
21.1% of AGI
(% of AGI for various income ranges: 29.7% for AGIs below $10k, 11.6% for AGIs $10k-25k, 11.0% for AGIs $25k-50k, 13.2% for AGIs $50k-75k, 15.3% for AGIs $75k-100k, 16.0% for AGIs over 100k)
Charity contributions deductions: $5,670 (4% of AGI, reported on 33.5% of returns)
Here:
$5,670
State:
$3,242
Here:
4.5% of AGI
State:
2.7% of AGI
(% of AGI for various income ranges: 1.5% for AGIs below $10k, 1.0% for AGIs $10k-25k, 1.4% for AGIs $25k-50k, 1.9% for AGIs $50k-75k, 2.1% for AGIs $75k-100k, 4.1% for AGIs over 100k)
Total tax: $11,816 (reported on 79.6% of returns)
08904:
$11,816
State:
$12,321
(% of AGI for various income ranges: 4.6% for AGIs below $10k, 4.7% for AGIs $10k-25k, 8.2% for AGIs $25k-50k, 10.5% for AGIs $50k-75k, 11.7% for AGIs $75k-100k, 19.4% for AGIs over 100k)
Earned income credit: $1,430 (reported on 8.0% of returns)
Here:
$1,430
State:
$1,711
Percentage of individuals using paid preparers for their 2004 taxes: 53.5%
Here:
53%
State:
65%
(% for various income ranges: 45.0% for AGIs below $10k, 52.4% for AGIs $10k-25k, 51.3% for AGIs $25k-50k, 55.4% for AGIs $50k-75k, 58.0% for AGIs $75k-100k, 63.9% for AGIs over 100k)
Likely homosexual households (counted as self-reported same-sex unmarried-partner households)
Lesbian couples: 0.1% of all households
Gay men: 0.3% of all households
Household received Food Stamps/SNAP in the past 12 months: 635 Household did not receive Food Stamps/SNAP in the past 12 months: 6,060
Women who had a birth in the past 12 months: 250 (149 now married, 99 unmarried) Women who did not have a birth in the past 12 months: 4,020 (1,266 now married, 2,762 unmarried)
Housing units in zip code 08904 with a mortgage: 1,633 (148 second mortgage, 9 home equity loan, 91 both second mortgage and home equity loan) Houses without a mortgage: 130
Median monthly owner costs for units with a mortgage: $2,887 Median monthly owner costs for units without a mortgage: $1,418
Residents with income below the poverty level in 2022:
This zip code:
10.5%
Whole state:
9.7%
Residents with income below 50% of the poverty level in 2022:
This zip code:
5.2%
Whole state:
5.2%
Median number of rooms in houses and condos:
Here:
6.9
State:
6.8
Median number of rooms in apartments:
Here:
3.5
State:
3.9
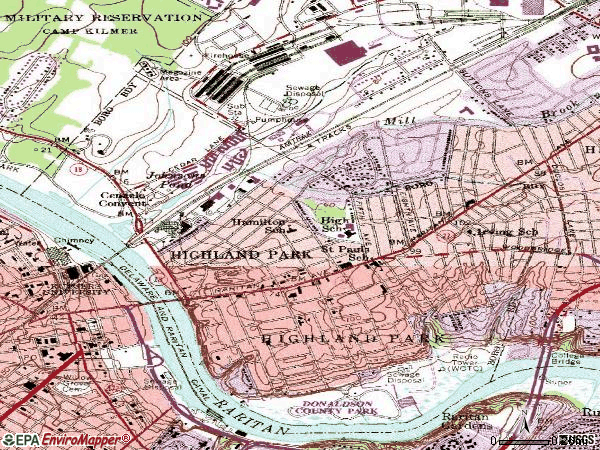
Notable locations in this zip code not listed on our city pages
Notable locations in zip code 08904: Highland Park First Aid Squad (A), Friendly Care Medical Transportation (B), Highland Park Fire Department (C), Highland Park Police Station (D). Display/hide their locations on the map
Churches in zip code 08904 include: All Nations Community Church (A), Greek Orthodox Church of Saint George (B), Synagogue of the Sephardic Congregation Etz Ahrim (C), All Saints Episcopal Church (D), Reformed Church of Highland Park (E), Saint Paul the Apostle Church (F), Trinity United Methodist Church (G), Cenacle Convent (H). Display/hide their locations on the map
1,910 married couples with children.
581 single-parent households (110 men, 471 women).
57.6% of residents of 08904 zip code speak English at home.
13.5% of residents speak Spanish at home (49% very well, 23% well, 24% not well, 3% not at all).
9.3% of residents speak other Indo-European language at home (75% very well, 20% well, 5% not well).
16.7% of residents speak Asian or Pacific Island language at home (60% very well, 31% well, 9% not well).
2.6% of residents speak other language at home (76% very well, 22% well, 2% not well).
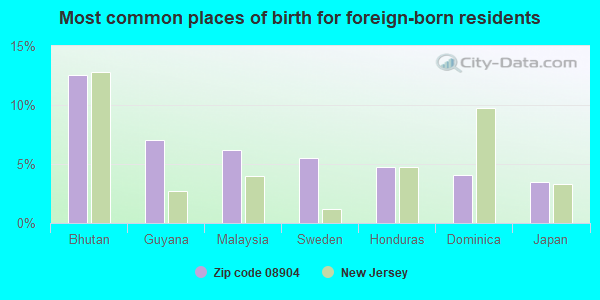
Foreign born population: 5,567 (37.1%) (42.1% of them are naturalized citizens)
This zip code:
37.1%
Whole state:
23.5%
13%Bhutan
7%Guyana
6%Malaysia
6%Sweden
5%Honduras
4%Dominica
3%Japan
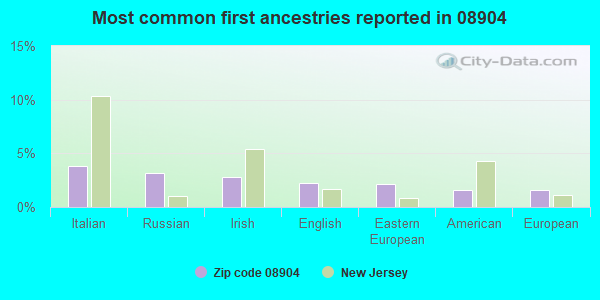
4%Italian
3%Russian
3%Irish
2%English
2%Eastern European
2%American
2%European
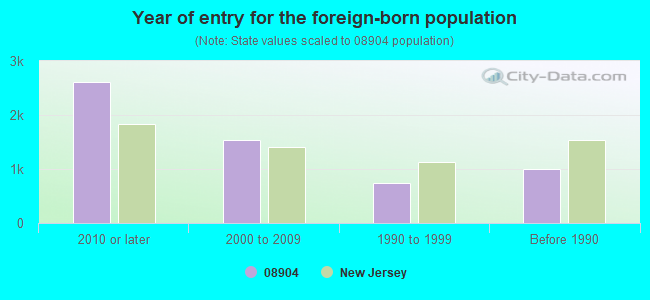
Year of entry for the foreign-born population
2,6152010 or later
1,5322000 to 2009
7491990 to 1999
1,005Before 1990
Major facilities with environmental interests located in this zip code:
HILLTOP MOBIL SERVICE STATION (60 RARITAN AVE in HIGHLAND PARK, NJ)
(Integrated Compliance Information System) - ICIS-02-2000-7505, FORMAL ENFORCEMENT ACTION, ICIS-02-2001-7505, STATE MASTER (New Jersey environmental info) - NJEMS-033393, STATE CLEANUP SITE, NJEMS-73894300000, EPCRA, NJEMS-A1997, AIR PROGRAM, NJEMS-NRG500000050, HAZARDOUS WASTE PROGRAM (Resource Conservation and Recovery Act (tracking hazardous waste)) Business SIC classification: GASOLINE SERVICE STATIONS Organizations: RACEWAY PETROLEUM INC, HILLTOP SERVICE INC, NON REGULATED (CONTACT/OWNER)
Alternative names: HILLTOP SERVICE INC, RACEWAY
HIGHLAND PARK BORO BD OF ED BARTLE SCHOOL (435 MANSFIELD ST in HIGHLAND PARK, NJ)
COMPLIANCE ACTIVITY (Tracking inspections of insecticide, fungicide, and rodenticide, and toxic substances) (National Center for Education Statistics) - STATE ID-085 STATE MASTER (New Jersey environmental info) - NJEMS-022089, STATE CLEANUP SITE, NJEMS-16545, AIR PROGRAM Business SIC classification: ELEMENTARY AND SECONDARY SCHOOLS Alternative names: HIGHLAND PARK BD OF ED
HIGHLAND PARK SERVICE CENTER (126 RARITAN AVE in HIGHLAND PARK, NJ)
(Integrated Compliance Information System) - ICIS-02-2002-7914, FORMAL ENFORCEMENT ACTION STATE MASTER (New Jersey environmental info) - NJEMS-032895, STATE CLEANUP SITE, NJEMS-53702100000, EPCRA, NJEMS-G1636, AIR PROGRAM (Resource Conservation and Recovery Act (tracking hazardous waste)) Business SIC classification: MANUFACTURING INDUSTRIES; GENERAL AUTOMOTIVE REPAIR SHOPS Organizations: HIGHLAND PARK SERVICE CENTER INC
HIGHLAND PARK BORO BD OF ED HIGH SCHOOL (102 NORTH 5TH AVENUE in HIGHLAND PARK, NJ)
(National Center for Education Statistics) - STATE ID-050 STATE MASTER (New Jersey environmental info) - NJEMS-022087, STATE CLEANUP SITE, NJEMS-16563, AIR PROGRAM Small Quantity Generators, between 100 kg and 1000 kg of hazardous waste/month (Resource Conservation and Recovery Act (tracking hazardous waste)) Business SIC classification: ELEMENTARY AND SECONDARY SCHOOLS Alternative names: HIGHLAND PARK HIGH SCHOOL
HIGHLAND PARK CLEANERS (412 RARITAN AVENUE in HIGHLAND PARK, NJ)
AIR MINOR (AIRS/AFS) STATE MASTER (New Jersey environmental info) - NJEMS-64122100000, EPCRA, NJEMS-L1509, AIR PROGRAM (Resource Conservation and Recovery Act (tracking hazardous waste)) Business SIC classification: DRYCLEANING PLANTS, EXCEPT RUG CLEANING Organizations: P&A BART CORP, EMBI CORP Alternative names: B & B CLEANERS & LAUNDRY SVC
HIGHLAND PARK BORO WATER DEPT (221 S 5TH AVE in HIGHLAND PARK BORO, NJ)
STATE MASTER (New Jersey environmental info) - NJEMS-1207001, DRINKING WATER PROGRAM, NJEMS-201997, National Pollutant Discharge Elimination System Permit, NJEMS-55040, WASTEWATER FACILITY National Pollutant Discharge Elimination System NON-MAJOR (Tracking pollutant discharge elimination systems) - permit
HIGHLAND PARK LAUNDRY & DRY CLEANING (65 WOODBRIDGE AVE FL 1 in HIGHLAND PARK, NJ)
STATE MASTER (New Jersey environmental info) - NJEMS-L1651, AIR PROGRAM (Resource Conservation and Recovery Act (tracking hazardous waste)) Business SIC classification: DRYCLEANING PLANTS, EXCEPT RUG CLEANING Organizations: CORE AMERICA INC
ALS PROFESIONAL CLEANERS (14 S 2ND AVE in HIGHLAND PARK, NJ)
STATE MASTER (New Jersey environmental info) - NJEMS-70764900000, EPCRA, NJEMS-L1503, AIR PROGRAM (Resource Conservation and Recovery Act (tracking hazardous waste)) Business SIC classification: DRYCLEANING PLANTS, EXCEPT RUG CLEANING Organizations: ALS PROFESSIONAL CLEANERS, EROS FASHION INC Alternative names: A L S PROFESSIONAL CLEANERS, ALS PROFFESIONAL CLEANERS
HIGHLAND PARK BORO BD OF ED HAMILTON CENTER SCHOOL (319 NORTH 3RD AVENUE in HIGHLAND PARK, NJ)
STATE MASTER (New Jersey environmental info) - NJEMS-012501, STATE CLEANUP SITE, NJEMS-16636, AIR PROGRAM (Resource Conservation and Recovery Act (tracking hazardous waste)) Business SIC classification: ELEMENTARY AND SECONDARY SCHOOLS Organizations: HIGHLAND PARK BORO BD OF ED CENTER SCHOOL Alternative names: HIGHLAND PARK BD OF ED
ACME AUTO BODY INC (184 WOODBRIDGE AVENUE in HIGHLAND PARK, NJ)
STATE MASTER (New Jersey environmental info) - NJEMS-30424400001, EPCRA, NJEMS-G1505, AIR PROGRAM (Resource Conservation and Recovery Act (tracking hazardous waste)) Business SIC classification: AUTO AND HOME SUPPLY STORES
AL MESCHI AUTO BODY INC (1153 STATE HIGHWAY 27 in HIGHLAND PARK, NJ)
STATE MASTER (New Jersey environmental info) - NJEMS-43355600000, EPCRA, NJEMS-G1517, AIR PROGRAM (Resource Conservation and Recovery Act (tracking hazardous waste)) Business SIC classification: TOP, BODY, AND UPHOLSTERY REPAIR SHOPS AND PAINT SHOPS
HIGHLAND PARK BORO BD OF ED IRVING ELEMENTARY SCHOOL (12 SOUTH 11TH STREET in HIGHLAND PARK, NJ)
STATE MASTER (New Jersey environmental info) - NJEMS-022088, STATE CLEANUP SITE, NJEMS-16564, AIR PROGRAM (Resource Conservation and Recovery Act (tracking hazardous waste)) Business SIC classification: ELEMENTARY AND SECONDARY SCHOOLS
FRAMES & UNIBODIES BY MODERN TREND (175 WOODBRIDGE AVE in HIGHLAND PARK, NJ)
STATE MASTER (New Jersey environmental info) - NJEMS-54971900000, EPCRA, NJEMS-G1615, AIR PROGRAM (Resource Conservation and Recovery Act (tracking hazardous waste)) Business SIC classification: TOP, BODY, AND UPHOLSTERY REPAIR SHOPS AND PAINT SHOPS
Housing units lacking complete plumbing facilities: 0.2% Housing units lacking complete kitchen facilities: 2.9%
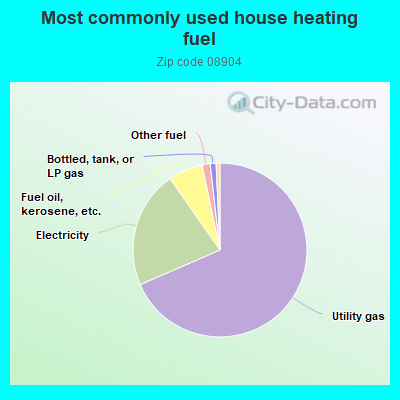
68.5%Utility gas
21.8%Electricity
6.4%Fuel oil, kerosene, etc.
1.5%Other fuel
1.1%Bottled, tank, or LP gas
0.7%No fuel used
Population in 1990: 13,165. Population change in the 1990s: +834 (+6.3%).
Place of birth for U.S.-born residents:
This state: 5,029
Northeast: 2,673
Midwest: 444
South: 801
West: 385
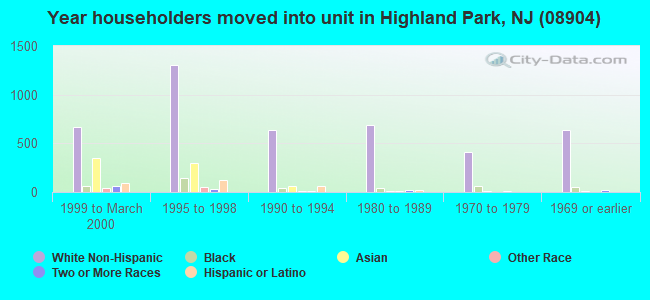
58% of the 08904 zip code residents lived in the same house 5 years ago. Out of people who lived in different houses, 51% lived in this county. Out of people who lived in different counties, 50% lived in New Jersey.
84% of the 08904 zip code residents lived in the same house 1 year ago. Out of people who lived in different houses, 45% moved from this county. Out of people who lived in different houses, 14% moved from different county within same state. Out of people who lived in different houses, 24% moved from different state. Out of people who lived in different houses, 18% moved from abroad.
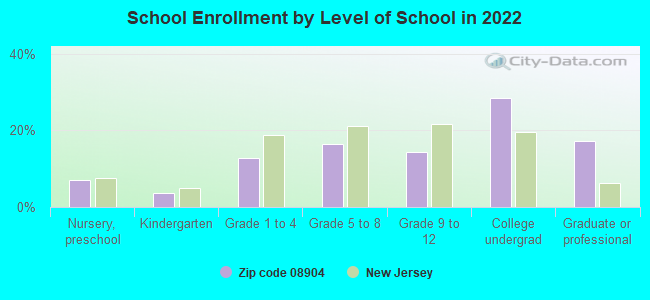
Private vs. public school enrollment:
Students in private schools in grades 1 to 8 (elementary and middle school): 231
Here:
19.0%
New Jersey:
12.3%
Students in private schools in grades 9 to 12 (high school): 117
Here:
19.3%
New Jersey:
13.1%
Students in private undergraduate colleges: 339
Here:
28.6%
New Jersey:
33.2%
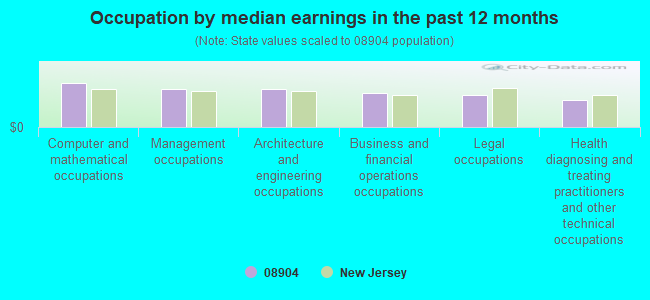
Occupation by median earnings in the past 12 months ($)
108,361Computer and mathematical occupations
93,981Management occupations
93,453Architecture and engineering occupations
83,556Business and financial operations occupations
77,717Legal occupations
67,114Health diagnosing and treating practitioners and other technical occupations
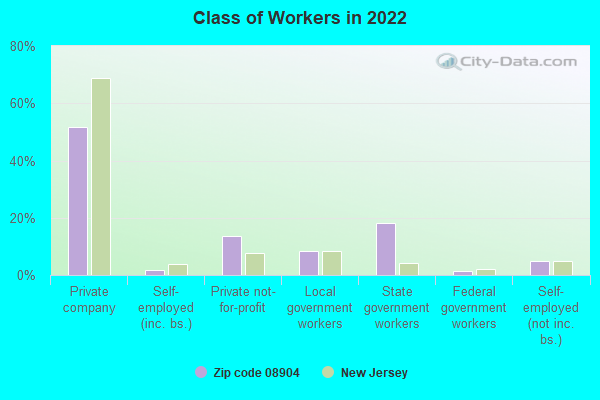
Companies with federal contracts located in this zip code:
DR. BARBARA TURPIN ( in HIGHLAND PARK, NJ; small business)
$15,000 with EPA for Other Professional Services. Signed on 2005-03-23. Completion date: 2005-12-27.
Top industries in this zip code by the number of employees in 2005:
Health Care and Social Assistance: Offices of Physicians (except Mental Health Specialists) (50-99 employees: 1 establishment, 20-49 employees: 1 establishment, 10-19 employees: 3 establishments, 5-9 employees: 4 establishments, 1-4 employees: 8 establishments)
Real Estate and Rental and Leasing: Lessors of Residential Buildings and Dwellings (20-49: 3, 10-19: 3, 5-9: 5, 1-4: 7)
Arts, Entertainment, and Recreation: Fitness and Recreational Sports Centers (100-249: 1, 5-9: 1, 1-4: 1)
Health Care and Social Assistance: Services for the Elderly and Persons with Disabilities (100-249: 1)
2003 - 2018 National Fire Incident Reporting System (NFIRS) incidents
Based on the data from the years 2003 - 2018 the average number of fire incidents per year is 34. The highest number of fire incidents - 55 took place in 2012, and the least - 12 in 2009. The data has a constant trend.
When looking into fire subcategories, the most reports belonged to: Structure Fires (68.6%), and Outside Fires (21.9%).
Fire incident types reported to NFIRS in Zip Code 08904


 Nearest zip codes: 08901, 08817, 08850, 08854, 08816, 08882.


 Based on the data from the years 2003 - 2018 the average number of fire incidents per year is 34. The highest number of fire incidents - 55 took place in 2012, and the least - 12 in 2009. The data has a constant trend.
 When looking into fire subcategories, the most reports belonged to: Structure Fires (68.6%), and Outside Fires (21.9%).