Estimated zip code population in 2022: 12,091 Zip code population in 2010: 11,910 Zip code population in 2000: 10,117
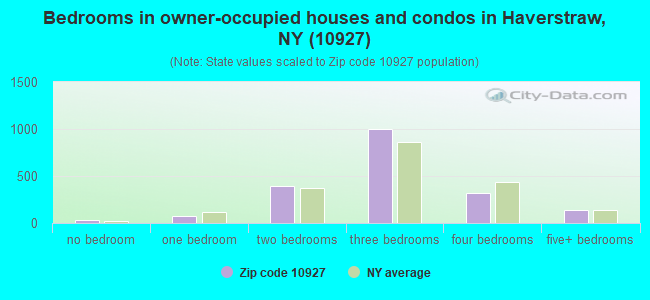
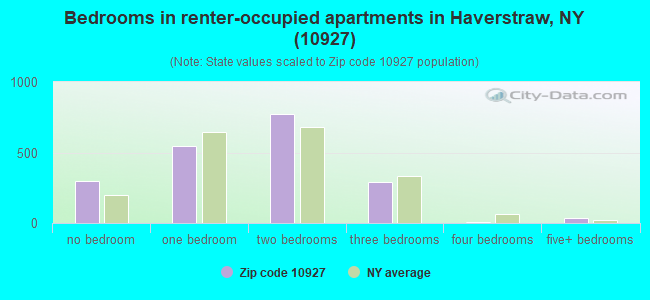
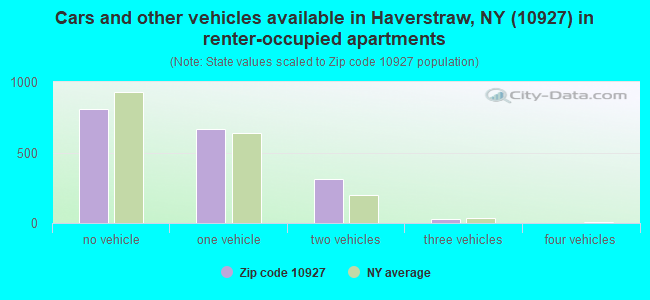
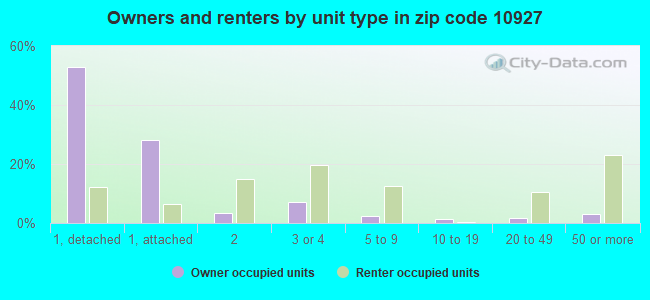
Houses and condos: 4,027 Renter-occupied apartments: 1,819
% of renters here:
48%
State:
46%
March 2022 cost of living index in zip code 10927: 131.5 (high, U.S. average is 100)
Land area: 2.0 sq. mi. Water area: 0.1 sq. mi.
Population density: 6,150 people per square mile
(high).
OSM Map
General Map
Google Map
MSN Map
OSM Map
General Map
Google Map
MSN Map
OSM Map
General Map
Google Map
MSN Map
OSM Map
General Map
Google Map
MSN Map
Please wait while loading the map...
Real estate property taxes paid for housing units in 2022:
This zip code:
2.9% ($9,678)
New York:
1.5% ($6,180)
Median real estate property taxes paid for housing units with mortgages in 2022: $9,539 (2.8%) Median real estate property taxes paid for housing units with no mortgage in 2022: $9,755 (2.8%)
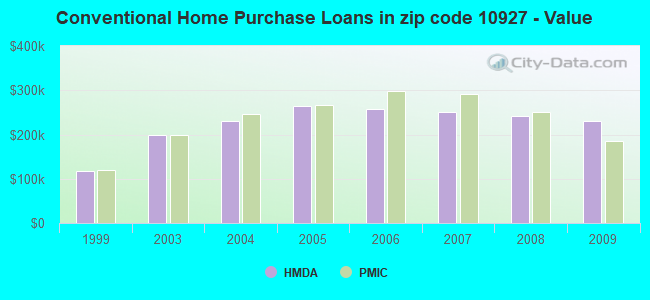
Estimated median house/condo value in 2022: $338,583
10927:
$338,583
New York:
$400,400
According to our research of New York and other state lists, there were 4 registered sex offenders living in 10927 zip code as of April 27, 2024. The ratio of all residents to sex offenders in zip code 10927 is 3,073 to 1. The ratio of registered sex offenders to all residents in this zip code is much lower than the state average.
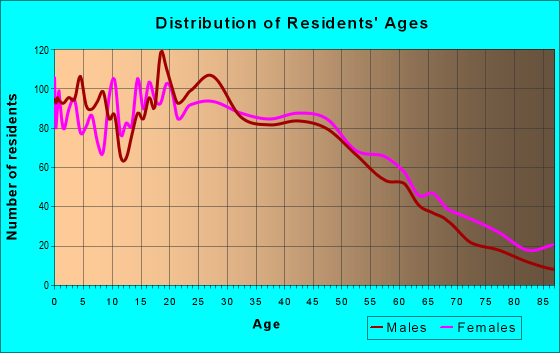
Median resident age:
This zip code:
37.5 years
New York median age:
40.0 years
Average household size:
This zip code:
3.1 people
New York:
2.5 people
Averages for the 2020 tax year for zip code 10927, filed in 2021:
Average Adjusted Gross Income (AGI) in 2020: $45,906 (Individual Income Tax Returns)
Here:
$45,906
State:
$90,930
Salary/wage: $39,954 (reported on 82.6% of returns)
Here:
$39,954
State:
$72,104
(% of AGI for various income ranges: 1154.8% for AGIs below $25k, 3307.0% for AGIs $25k-50k, 6693.4% for AGIs $50k-75k, 9928.0% for AGIs $75k-100k, 16561.9% for AGIs $100k-200k, 61057.5% for AGIs over 200k)
Taxable interest for individuals: $675 (reported on 18.3% of returns)
This zip code:
$675
New York:
$3,075
(% of AGI for various income ranges: 4.1% for AGIs below $25k, 3.0% for AGIs $25k-50k, 11.5% for AGIs $50k-75k, 42.4% for AGIs $75k-100k, 127.0% for AGIs $100k-200k, 400.0% for AGIs over 200k)
Ordinary dividends: $4,539 (reported on 8.5% of returns)
Here:
$4,539
State:
$11,095
(% of AGI for various income ranges: 9.1% for AGIs below $25k, 5.6% for AGIs $25k-50k, 40.5% for AGIs $50k-75k, 140.4% for AGIs $75k-100k, 263.7% for AGIs $100k-200k, 2405.0% for AGIs over 200k)
Net capital gain/loss in AGI: +$8,985 (reported on 8.4% of returns)
Here:
+$8,985
State:
+$44,925
(% of AGI for various income ranges: 2.5% for AGIs below $25k, 6.7% for AGIs $25k-50k, 27.7% for AGIs $50k-75k, 72.0% for AGIs $75k-100k, 454.8% for AGIs $100k-200k, 7985.0% for AGIs over 200k)
Profit/loss from business: +$8,434 (reported on 13.7% of returns)
Here:
+$8,434
State:
+$14,940
(% of AGI for various income ranges: 163.4% for AGIs below $25k, 79.6% for AGIs $25k-50k, 84.7% for AGIs $50k-75k, 239.6% for AGIs $75k-100k, 210.0% for AGIs $100k-200k, 3737.5% for AGIs over 200k)
Taxable individual retirement arrangement distribution: $16,895 (reported on 3.4% of returns)
10927:
$16,895
New York:
$19,609
(% of AGI for various income ranges: 14.0% for AGIs below $25k, 18.2% for AGIs $25k-50k, 77.3% for AGIs $50k-75k, 221.2% for AGIs $75k-100k, 440.0% for AGIs $100k-200k, 2282.5% for AGIs over 200k)
Total itemized deductions: $23,885 (reported on 7.0% of returns)
Here:
$23,885
State:
$39,326
(% of AGI for various income ranges: 39.8% for AGIs below $25k, 80.5% for AGIs $25k-50k, 312.6% for AGIs $50k-75k, 870.8% for AGIs $75k-100k, 1154.4% for AGIs $100k-200k, 3922.5% for AGIs over 200k)
Charity contributions: $4,355 (reported on 5.8% of returns)
Here:
$4,355
State:
$15,420
(% of AGI for various income ranges: 1.8% for AGIs below $25k, 8.1% for AGIs $25k-50k, 33.5% for AGIs $50k-75k, 86.0% for AGIs $75k-100k, 218.5% for AGIs $100k-200k, 1152.5% for AGIs over 200k)
Taxes paid: $9,022 (reported on 7.0% of returns)
10927:
$9,022
State:
$9,183
(% of AGI for various income ranges: 11.7% for AGIs below $25k, 34.1% for AGIs $25k-50k, 138.1% for AGIs $50k-75k, 356.4% for AGIs $75k-100k, 399.3% for AGIs $100k-200k, 1230.0% for AGIs over 200k)
Earned income credit: $2,407 (reported on 24.8% of returns)
Here:
$2,407
State:
$2,138
(% of AGI for various income ranges: 120.3% for AGIs below $25k, 96.0% for AGIs $25k-50k)
Percentage of individuals using paid preparers for their 2020 taxes: 96.0%
Here:
96%
State:
95%
(% for various income ranges: 93.8% for AGIs below $25k, 97.7% for AGIs $25k-50k, 97.6% for AGIs $50k-75k, 97.4% for AGIs $75k-100k, 95.7% for AGIs $100k-200k, 100.0% for AGIs over 200k)
Averages for the 2012 tax year for zip code 10927, filed in 2013:
Average Adjusted Gross Income (AGI) in 2012: $41,495 (Individual Income Tax Returns)
Here:
$41,495
State:
$77,088
Salary/wage: $35,945 (reported on 87.5% of returns)
Here:
$35,945
State:
$60,593
(% of AGI for various income ranges: 80.1% for AGIs below $25k, 90.0% for AGIs $25k-50k, 83.7% for AGIs $50k-75k, 84.0% for AGIs $75k-100k, 82.0% for AGIs $100k-200k, 39.4% for AGIs over 200k)
Taxable interest for individuals: $538 (reported on 19.2% of returns)
This zip code:
$538
New York:
$3,125
(% of AGI for various income ranges: 0.2% for AGIs below $25k, 0.2% for AGIs $25k-50k, 0.3% for AGIs $50k-75k, 0.2% for AGIs $75k-100k, 0.4% for AGIs $100k-200k, 0.1% for AGIs over 200k)
Ordinary dividends: $2,271 (reported on 8.3% of returns)
Here:
$2,271
State:
$10,299
(% of AGI for various income ranges: 0.4% for AGIs below $25k, 0.3% for AGIs $25k-50k, 0.5% for AGIs $50k-75k, 0.7% for AGIs $75k-100k, 0.6% for AGIs $100k-200k, 0.3% for AGIs over 200k)
Net capital gain/loss in AGI: +$10,543 (reported on 4.7% of returns)
Here:
+$10,543
State:
+$42,474
(% of AGI for various income ranges: 0.3% for AGIs $100k-200k, 6.2% for AGIs over 200k)
Profit/loss from business: +$8,789 (reported on 12.0% of returns)
Here:
+$8,789
State:
+$16,168
(% of AGI for various income ranges: 8.5% for AGIs below $25k, 1.8% for AGIs $25k-50k, 1.2% for AGIs $50k-75k, 0.8% for AGIs $75k-100k, 2.9% for AGIs $100k-200k)
Taxable individual retirement arrangement distribution: $13,335 (reported on 3.4% of returns)
10927:
$13,335
New York:
$17,621
(% of AGI for various income ranges: 0.6% for AGIs below $25k, 0.8% for AGIs $25k-50k, 1.4% for AGIs $50k-75k, 1.3% for AGIs $75k-100k, 2.7% for AGIs $100k-200k)
Total itemized deductions: $23,772 (26% of AGI, reported on 27.1% of returns)
Here:
$23,772
State:
$34,985
Here:
25.6% of AGI
State:
21.3% of AGI
(% of AGI for various income ranges: 6.8% for AGIs below $25k, 15.0% for AGIs $25k-50k, 18.6% for AGIs $50k-75k, 22.0% for AGIs $75k-100k, 20.7% for AGIs $100k-200k, 12.6% for AGIs over 200k)
Charity contributions: $2,246 (reported on 23.1% of returns)
Here:
$2,246
State:
$5,572
(% of AGI for various income ranges: 0.4% for AGIs below $25k, 1.1% for AGIs $25k-50k, 1.8% for AGIs $50k-75k, 1.9% for AGIs $75k-100k, 1.8% for AGIs $100k-200k, 0.8% for AGIs over 200k)
Taxes paid: $11,209 (reported on 27.1% of returns)
10927:
$11,209
State:
$18,656
(% of AGI for various income ranges: 2.7% for AGIs below $25k, 4.9% for AGIs $25k-50k, 8.2% for AGIs $50k-75k, 10.2% for AGIs $75k-100k, 10.5% for AGIs $100k-200k, 8.6% for AGIs over 200k)
Earned income credit: $2,502 (reported on 31.9% of returns)
Here:
$2,502
State:
$2,230
(% of AGI for various income ranges: 9.9% for AGIs below $25k, 1.6% for AGIs $25k-50k)
Percentage of individuals using paid preparers for their 2012 taxes: 79.5%
Here:
79%
State:
66%
(% for various income ranges: 80.6% for AGIs below $25k, 79.6% for AGIs $25k-50k, 73.2% for AGIs $50k-75k, 79.3% for AGIs $75k-100k, 80.0% for AGIs $100k-200k, 75.0% for AGIs over 200k)
Averages for the 2004 tax year for zip code 10927, filed in 2005:
Average Adjusted Gross Income (AGI) in 2004: $30,553 (Individual Income Tax Returns)
Here:
$30,553
State:
$59,519
Salary/wage: $29,988 (reported on 90.3% of returns)
Here:
$29,988
State:
$50,673
(% of AGI for various income ranges: 82.5% for AGIs below $10k, 87.1% for AGIs $10k-25k, 92.8% for AGIs $25k-50k, 89.8% for AGIs $50k-75k, 88.4% for AGIs $75k-100k, 82.6% for AGIs over 100k)
Taxable interest for individuals: $436 (reported on 29.7% of returns)
This zip code:
$436
New York:
$2,377
(% of AGI for various income ranges: 1.2% for AGIs below $10k, 0.6% for AGIs $10k-25k, 0.3% for AGIs $25k-50k, 0.3% for AGIs $50k-75k, 0.2% for AGIs $75k-100k, 0.4% for AGIs over 100k)
Taxable dividends: $1,064 (reported on 9.1% of returns)
Here:
$1,064
State:
$5,394
(% of AGI for various income ranges: 0.7% for AGIs below $10k, 0.4% for AGIs $10k-25k, 0.3% for AGIs $25k-50k, 0.2% for AGIs $50k-75k, 0.2% for AGIs $75k-100k, 0.5% for AGIs over 100k)
Net capital gain/loss: +$3,020 (reported on 5.3% of returns)
Here:
+$3,020
State:
+$23,581
(% of AGI for various income ranges: -0.3% for AGIs below $10k, 0.1% for AGIs $10k-25k, 0.1% for AGIs $25k-50k, 0.0% for AGIs $50k-75k, 0.1% for AGIs $75k-100k, 3.1% for AGIs over 100k)
Profit/loss from business: +$6,006 (reported on 10.1% of returns)
Here:
+$6,006
State:
+$13,809
(% of AGI for various income ranges: 15.1% for AGIs below $10k, 4.6% for AGIs $10k-25k, 0.8% for AGIs $25k-50k, 0.7% for AGIs $50k-75k, 0.7% for AGIs $75k-100k, 0.5% for AGIs over 100k)
IRA payment deduction: $3,000 (reported on 0.7% of returns)
10927:
$3,000
New York:
$3,115
Total itemized deductions: $17,348 (29% of AGI, reported on 27.8% of returns)
Here:
$17,348
State:
$25,864
Here:
29.1% of AGI
State:
21.9% of AGI
(% of AGI for various income ranges: 4.2% for AGIs below $10k, 6.0% for AGIs $10k-25k, 15.5% for AGIs $25k-50k, 22.4% for AGIs $50k-75k, 21.6% for AGIs $75k-100k, 18.5% for AGIs over 100k)
Charity contributions deductions: $2,242 (4% of AGI, reported on 24.6% of returns)
Here:
$2,242
State:
$4,439
Here:
3.6% of AGI
State:
3.6% of AGI
(% of AGI for various income ranges: 0.2% for AGIs below $10k, 0.6% for AGIs $10k-25k, 1.7% for AGIs $25k-50k, 2.6% for AGIs $50k-75k, 2.6% for AGIs $75k-100k, 2.3% for AGIs over 100k)
Total tax: $3,565 (reported on 63.4% of returns)
10927:
$3,565
State:
$11,730
(% of AGI for various income ranges: 2.9% for AGIs below $10k, 3.0% for AGIs $10k-25k, 5.6% for AGIs $25k-50k, 8.2% for AGIs $50k-75k, 9.8% for AGIs $75k-100k, 14.5% for AGIs over 100k)
Earned income credit: $1,807 (reported on 29.0% of returns)
Here:
$1,807
State:
$1,757
Percentage of individuals using paid preparers for their 2004 taxes: 83.9%
Here:
84%
State:
67%
(% for various income ranges: 85.2% for AGIs below $10k, 88.3% for AGIs $10k-25k, 81.4% for AGIs $25k-50k, 77.1% for AGIs $50k-75k, 81.2% for AGIs $75k-100k, 73.8% for AGIs over 100k)
Likely homosexual households (counted as self-reported same-sex unmarried-partner households)
Lesbian couples: 0.1% of all households
Gay men: 0.0% of all households
Household received Food Stamps/SNAP in the past 12 months: 898 Household did not receive Food Stamps/SNAP in the past 12 months: 2,903
Women who had a birth in the past 12 months: 313 (55 now married, 266 unmarried) Women who did not have a birth in the past 12 months: 2,281 (863 now married, 1,416 unmarried)
Housing units in zip code 10927 with a mortgage: 1,449 (38 second mortgage, 38 both second mortgage and home equity loan) Houses without a mortgage: 14
Median monthly owner costs for units with a mortgage: $2,729 Median monthly owner costs for units without a mortgage: $1,229
Residents with income below the poverty level in 2022:
This zip code:
13.5%
Whole state:
14.3%
Residents with income below 50% of the poverty level in 2022:
This zip code:
3.8%
Whole state:
6.8%
Median number of rooms in houses and condos:
Here:
5.8
State:
6.3
Median number of rooms in apartments:
Here:
3.8
State:
3.8
Notable locations in this zip code not listed on our city pages
Notable locations in zip code 10927: Snedeker Landing (A), Haverstraw King's Daughters Public Library Village Branch (B), Green Hills Estate Home for the Aged (C), Haverstraw Fire Department Relief Hose Company 3 (D), Haverstraw Fire Department Lady Warren Hose Company 5 (E), Haverstraw Fire Department (F). Display/hide their locations on the map
Churches in zip code 10927 include: Calvary Baptist Church (A), Central Presbyterian Church (B), Bricktown Gospel Fellowship Church (C), Charismatic Christian Church (D), Haverstraw Church of Christ (E), Elohim Church of God (F), Fairmont Baptist Church (G), Harvest Assembly of God Church (H), Kingdom Hall of Jehovah's Witnesses (I). Display/hide their locations on the map
In group quarters: 398 (-1 institutionalized population)
Size of family households: 728 2-persons, 674 3-persons, 635 4-persons, 454 5-persons, 173 6-persons, 102 7-or-more-persons
Size of nonfamily households: 767 1-person, 157 2-persons, 24 3-persons
1,384 married couples with children.
958 single-parent households (152 men, 806 women).
41.1% of residents of 10927 zip code speak English at home.
48.8% of residents speak Spanish at home (47% very well, 24% well, 18% not well, 10% not at all).
6.8% of residents speak other Indo-European language at home (29% very well, 55% well, 10% not well, 6% not at all).
2.7% of residents speak Asian or Pacific Island language at home (42% very well, 58% well).
0.3% of residents speak other language at home (100% very well).
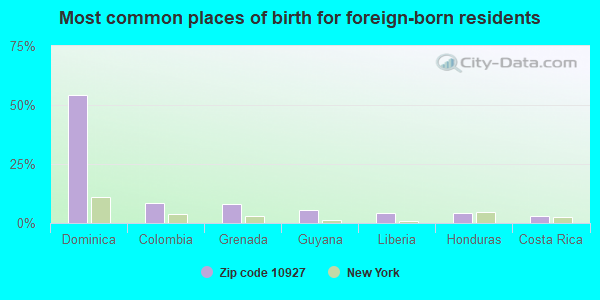
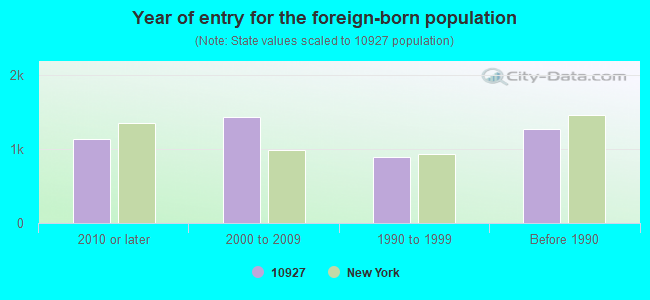
Foreign born population: 4,026 (33.3%) (53.0% of them are naturalized citizens)
This zip code:
33.3%
Whole state:
22.7%
54%Dominica
9%Colombia
8%Grenada
5%Guyana
4%Liberia
4%Honduras
3%Costa Rica
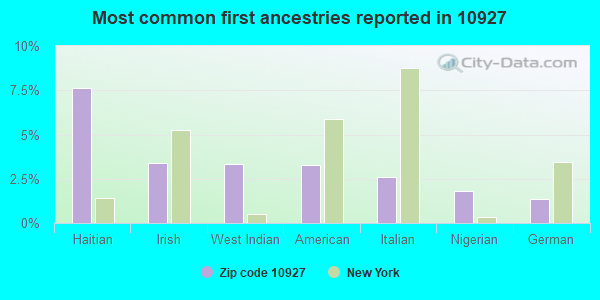
5%Haitian
5%West Indian
4%Irish
4%Italian
3%American
2%Nigerian
1%German
Year of entry for the foreign-born population
1,1342010 or later
1,4402000 to 2009
8951990 to 1999
1,278Before 1990
Facilities with environmental interests located in this zip code:
HAVERSTRAW LANDFILL (GRASSY POINT RD. in HAVERSTRAW, NY)
STATE MASTER (New York facility tracking) - SOLID WASTE PROGRAM, HAZARDOUS WASTE PROGRAM CRITERIA AND HAZARDOUS AIR POLLUTANT INVENTORY (Inventory of air pollution sources) Business SIC classification: REFUSE SYSTEMS Business NAICS classification: SOLID WASTE LANDFILL. Organizations: HAVERSTRAW - T (LEGALLY RESPONSIBLE PARTY)
GERALD F. NEARY ES ( in HAVERSTRAW, NY)
(National Center for Education Statistics) - STATE ID-500201060002 Organizations: HAVERSTRAW-STONY POINT CSD (NORTH RO (SCHOOL DISTRICT)
HAVERSTRAW MS ( in HAVERSTRAW, NY)
(National Center for Education Statistics) - STATE ID-500201060010 Organizations: HAVERSTRAW-STONY POINT CSD (NORTH RO (SCHOOL DISTRICT)
HAVERSTRAW QUARRY (362 SCRATCHUP RD in HAVERSTRAW, NY)
National Pollutant Discharge Elimination System NON-MAJOR (Tracking pollutant discharge elimination systems) - permit Business SIC classification: CRUSHED AND BROKEN STONE Organizations: TILCON NEW YORK INC (CONTACT/OWNER)
Alternative names: TILCON QUARRIES NEW YORK, INC
GIL AUTO CENTER (160 RTE 9W in HAVERSTRAW, NY)
(Resource Conservation and Recovery Act (tracking hazardous waste))
GRANT HARDWARE CO (240 RTE 9W in HAVERSTRAW, NY)
(Resource Conservation and Recovery Act (tracking hazardous waste))
HAVERSTRAW POST OFFICE (86 MAIN ST in HAVERSTRAW, NY) . Federal Facility
AIR MINOR (AIRS/AFS) Business SIC classification: UNITED STATES POSTAL SERVICE THIS INDUSTRY INCLUDES ALL ESTABLISHMENTS OF THE UNITED STATES POSTAL SERVICE. Alternative names: UNITED STATES POSTAL SERVICE
ALGONQUIN GAS TRANSMISSION CO - VALVE 14 (CALL HOLLOW RD EAST OF in HAVERSTRAW, NY)
Small Quantity Generators, between 100 kg and 1000 kg of hazardous waste/month (Resource Conservation and Recovery Act (tracking hazardous waste)) - notification Organizations: AGONQUIN GAS TRANSMISSION CO (CONTACT/OWNER)
HAVERSTRAW LF (RIVER RD in HAVERSTRAW, NY)
SUPERFUND (Superfund database)
Housing units lacking complete kitchen facilities: 1.7%
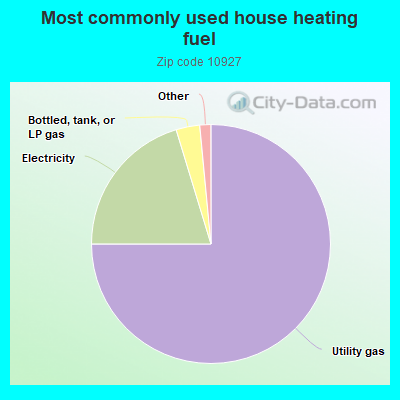
75.0%Utility gas
20.3%Electricity
3.2%Bottled, tank, or LP gas
0.7%Other fuel
0.7%No fuel used
Population in 1990: 9,438. Population change in the 1990s: +679 (+7.2%).
Place of birth for U.S.-born residents:
This state: 6,442
Northeast: 485
Midwest: 31
South: 296
West: 46
60% of the 10927 zip code residents lived in the same house 5 years ago. Out of people who lived in different houses, 83% lived in this county. Out of people who lived in different counties, 50% lived in New York.
83% of the 10927 zip code residents lived in the same house 1 year ago. Out of people who lived in different houses, 37% moved from this county. Out of people who lived in different houses, 44% moved from different county within same state. Out of people who lived in different houses, 17% moved from different state. Out of people who lived in different houses, 4% moved from abroad.
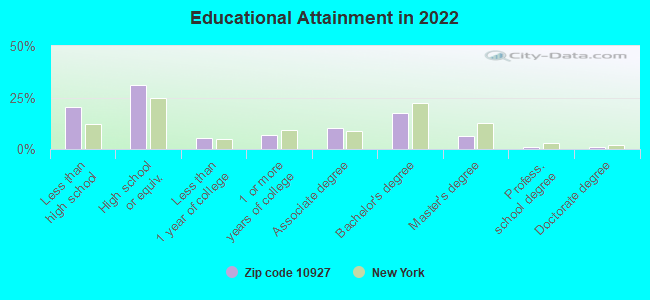
Private vs. public school enrollment:
Students in private schools in grades 1 to 8 (elementary and middle school): 62
Here:
5.1%
New York:
15.6%
Students in private schools in grades 9 to 12 (high school): 29
Here:
5.4%
New York:
15.0%
Students in private undergraduate colleges: 226
Here:
43.4%
New York:
39.2%
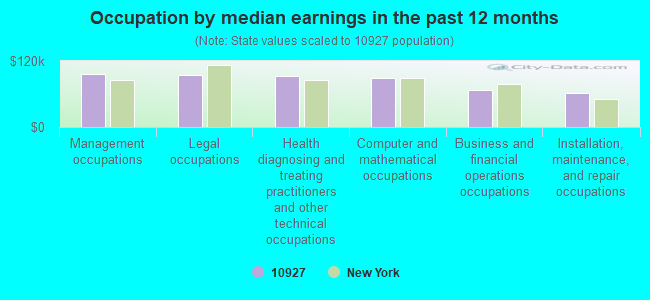
Occupation by median earnings in the past 12 months ($)
95,526Management occupations
94,380Legal occupations
92,775Health diagnosing and treating practitioners and other technical occupations
89,591Computer and mathematical occupations
67,258Business and financial operations occupations
61,386Installation, maintenance, and repair occupations
Companies with federal contracts located in this zip code:
HAVERSTRAW MOTOR SPORTS INC (64-66 RT 9W in HAVERSTRAW, NY; small business)
$47,575 with Air Force for Passenger Motor Vehicles. Signed on 2000-09-30. Completion date: 2000-09-29.
HAVERSTRAW MOWER AND RECREATIO (64 ROUTE 9W 66 in HAVERSTRAW, NY)
$47,575 with Air Force for Passenger Motor Vehicles. Signed on 2000-06-08. Completion date: 2000-07-08.
Top industries in this zip code by the number of employees in 2005:
Health Care and Social Assistance: Nursing Care Facilities (250-499 employees: 1 establishment)
2002 - 2018 National Fire Incident Reporting System (NFIRS) incidents
According to the data from the years 2002 - 2018 the average number of fire incidents per year is 23. The highest number of reported fire incidents - 63 took place in 2014, and the least - 1 in 2008. The data has a growing trend.
When looking into fire subcategories, the most incidents belonged to: Structure Fires (58.8%), and Outside Fires (24.5%).
Fire incident types reported to NFIRS in Zip Code 10927


 Nearest zip codes: 10993, 10923, 10956, 10920, 10984, 10548.
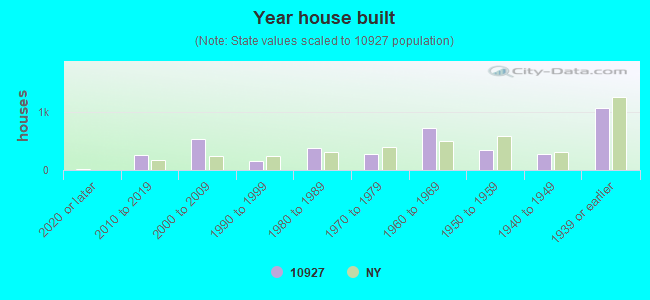


 According to the data from the years 2002 - 2018 the average number of fire incidents per year is 23. The highest number of reported fire incidents - 63 took place in 2014, and the least - 1 in 2008. The data has a growing trend.
 When looking into fire subcategories, the most incidents belonged to: Structure Fires (58.8%), and Outside Fires (24.5%).