Estimated zip code population in 2022: 27,472 Zip code population in 2010: 27,582 Zip code population in 2000: 27,001
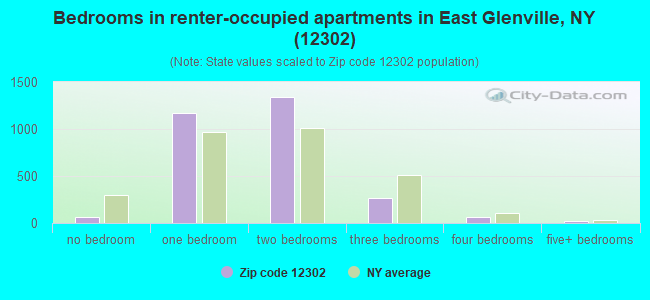
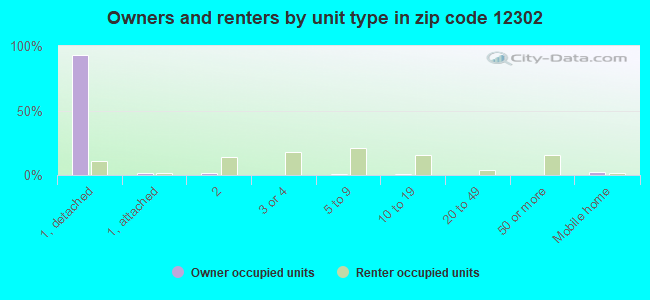
Houses and condos: 12,379 Renter-occupied apartments: 2,949
% of renters here:
26%
State:
46%
March 2022 cost of living index in zip code 12302: 105.4 (more than average, U.S. average is 100)
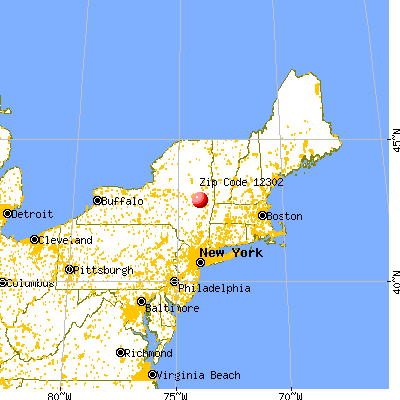
Land area: 42.3 sq. mi. Water area: 1.2 sq. mi.
Population density: 649 people per square mile
(low).
OSM Map
General Map
Google Map
MSN Map
OSM Map
General Map
Google Map
MSN Map
OSM Map
General Map
Google Map
MSN Map
OSM Map
General Map
Google Map
MSN Map
Please wait while loading the map...
Real estate property taxes paid for housing units in 2022:
This zip code:
2.3% ($5,296)
New York:
1.5% ($6,180)
Median real estate property taxes paid for housing units with mortgages in 2022: $5,771 (2.3%) Median real estate property taxes paid for housing units with no mortgage in 2022: $4,435 (2.1%)
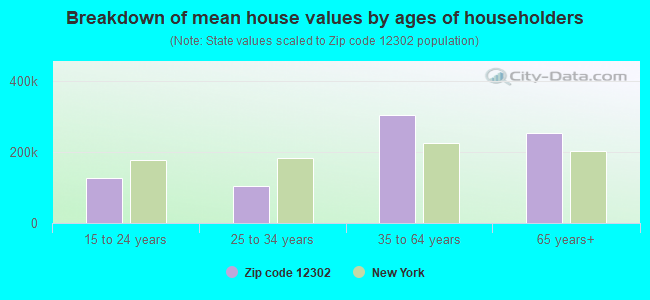
Estimated median house/condo value in 2022: $232,672
12302:
$232,672
New York:
$400,400
According to our research of New York and other state lists, there were 13 registered sex offenders living in 12302 zip code as of April 27, 2024. The ratio of all residents to sex offenders in zip code 12302 is 2,150 to 1. The ratio of registered sex offenders to all residents in this zip code is lower than the state average.
Median resident age:
This zip code:
42.7 years
New York median age:
40.0 years
Average household size:
This zip code:
2.4 people
New York:
2.5 people
Averages for the 2020 tax year for zip code 12302, filed in 2021:
Average Adjusted Gross Income (AGI) in 2020: $74,258 (Individual Income Tax Returns)
Here:
$74,258
State:
$90,930
Salary/wage: $65,341 (reported on 78.7% of returns)
Here:
$65,341
State:
$72,104
(% of AGI for various income ranges: 1078.4% for AGIs below $25k, 3370.5% for AGIs $25k-50k, 6047.3% for AGIs $50k-75k, 8755.0% for AGIs $75k-100k, 16833.9% for AGIs $100k-200k, 55890.0% for AGIs over 200k)
Taxable interest for individuals: $993 (reported on 45.4% of returns)
This zip code:
$993
New York:
$3,075
(% of AGI for various income ranges: 21.5% for AGIs below $25k, 30.5% for AGIs $25k-50k, 48.8% for AGIs $50k-75k, 77.1% for AGIs $75k-100k, 93.8% for AGIs $100k-200k, 883.0% for AGIs over 200k)
Ordinary dividends: $4,214 (reported on 28.2% of returns)
Here:
$4,214
State:
$11,095
(% of AGI for various income ranges: 40.9% for AGIs below $25k, 53.1% for AGIs $25k-50k, 109.0% for AGIs $50k-75k, 169.7% for AGIs $75k-100k, 345.0% for AGIs $100k-200k, 2314.5% for AGIs over 200k)
Net capital gain/loss in AGI: +$13,757 (reported on 22.1% of returns)
Here:
+$13,757
State:
+$44,925
(% of AGI for various income ranges: 11.9% for AGIs below $25k, 30.5% for AGIs $25k-50k, 76.5% for AGIs $50k-75k, 155.3% for AGIs $75k-100k, 455.0% for AGIs $100k-200k, 15757.5% for AGIs over 200k)
Profit/loss from business: +$13,616 (reported on 11.9% of returns)
Here:
+$13,616
State:
+$14,940
(% of AGI for various income ranges: 65.0% for AGIs below $25k, 98.1% for AGIs $25k-50k, 129.2% for AGIs $50k-75k, 183.7% for AGIs $75k-100k, 380.9% for AGIs $100k-200k, 4011.0% for AGIs over 200k)
Taxable individual retirement arrangement distribution: $15,439 (reported on 12.1% of returns)
12302:
$15,439
New York:
$19,609
(% of AGI for various income ranges: 84.5% for AGIs below $25k, 113.1% for AGIs $25k-50k, 219.9% for AGIs $50k-75k, 377.4% for AGIs $75k-100k, 508.8% for AGIs $100k-200k, 2231.0% for AGIs over 200k)
Self-employed (Keogh) retirement plans: $21,012 (reported on 0.5% of returns)
12302:
$21,012
New York:
$32,497
(% of AGI for various income ranges: 25.4% for AGIs $100k-200k, 603.0% for AGIs over 200k)
Total itemized deductions: $26,901 (reported on 8.2% of returns)
Here:
$26,901
State:
$39,326
(% of AGI for various income ranges: 69.1% for AGIs below $25k, 135.0% for AGIs $25k-50k, 306.5% for AGIs $50k-75k, 471.1% for AGIs $75k-100k, 517.5% for AGIs $100k-200k, 3115.0% for AGIs over 200k)
Charity contributions: $6,905 (reported on 6.0% of returns)
Here:
$6,905
State:
$15,420
(% of AGI for various income ranges: 3.4% for AGIs below $25k, 9.0% for AGIs $25k-50k, 32.5% for AGIs $50k-75k, 48.2% for AGIs $75k-100k, 117.1% for AGIs $100k-200k, 1208.0% for AGIs over 200k)
Taxes paid: $8,692 (reported on 8.2% of returns)
12302:
$8,692
State:
$9,183
(% of AGI for various income ranges: 12.6% for AGIs below $25k, 36.9% for AGIs $25k-50k, 124.5% for AGIs $50k-75k, 184.7% for AGIs $75k-100k, 178.2% for AGIs $100k-200k, 664.5% for AGIs over 200k)
Earned income credit: $1,753 (reported on 8.0% of returns)
Here:
$1,753
State:
$2,138
(% of AGI for various income ranges: 50.6% for AGIs below $25k, 36.7% for AGIs $25k-50k, 0.7% for AGIs $50k-75k)
Percentage of individuals using paid preparers for their 2020 taxes: 95.2%
Here:
95%
State:
95%
(% for various income ranges: 94.1% for AGIs below $25k, 95.0% for AGIs $25k-50k, 95.7% for AGIs $50k-75k, 96.0% for AGIs $75k-100k, 95.8% for AGIs $100k-200k, 94.7% for AGIs over 200k)
Averages for the 2012 tax year for zip code 12302, filed in 2013:
Average Adjusted Gross Income (AGI) in 2012: $61,863 (Individual Income Tax Returns)
Here:
$61,863
State:
$77,088
Salary/wage: $54,592 (reported on 81.1% of returns)
Here:
$54,592
State:
$60,593
(% of AGI for various income ranges: 66.6% for AGIs below $25k, 72.6% for AGIs $25k-50k, 70.7% for AGIs $50k-75k, 73.4% for AGIs $75k-100k, 76.9% for AGIs $100k-200k, 56.1% for AGIs over 200k)
Taxable interest for individuals: $1,009 (reported on 50.6% of returns)
This zip code:
$1,009
New York:
$3,125
(% of AGI for various income ranges: 1.4% for AGIs below $25k, 0.8% for AGIs $25k-50k, 0.9% for AGIs $50k-75k, 0.7% for AGIs $75k-100k, 0.6% for AGIs $100k-200k, 1.5% for AGIs over 200k)
Ordinary dividends: $4,018 (reported on 33.6% of returns)
Here:
$4,018
State:
$10,299
(% of AGI for various income ranges: 3.4% for AGIs below $25k, 2.1% for AGIs $25k-50k, 1.9% for AGIs $50k-75k, 1.9% for AGIs $75k-100k, 1.9% for AGIs $100k-200k, 3.1% for AGIs over 200k)
Net capital gain/loss in AGI: +$5,286 (reported on 20.7% of returns)
Here:
+$5,286
State:
+$42,474
(% of AGI for various income ranges: 0.2% for AGIs $25k-50k, 0.4% for AGIs $50k-75k, 0.5% for AGIs $75k-100k, 1.1% for AGIs $100k-200k, 10.3% for AGIs over 200k)
Profit/loss from business: +$12,023 (reported on 12.5% of returns)
Here:
+$12,023
State:
+$16,168
(% of AGI for various income ranges: 4.9% for AGIs below $25k, 2.2% for AGIs $25k-50k, 1.6% for AGIs $50k-75k, 1.5% for AGIs $75k-100k, 2.2% for AGIs $100k-200k, 4.9% for AGIs over 200k)
Taxable individual retirement arrangement distribution: $12,418 (reported on 13.1% of returns)
12302:
$12,418
New York:
$17,621
(% of AGI for various income ranges: 3.6% for AGIs below $25k, 2.5% for AGIs $25k-50k, 2.7% for AGIs $50k-75k, 3.0% for AGIs $75k-100k, 2.4% for AGIs $100k-200k, 2.4% for AGIs over 200k)
Self-employment retirement plans: $18,356 (reported on 0.6% of returns)
12302:
$18,356
New York:
$27,330
(% of AGI for various income ranges: 0.1% for AGIs $50k-75k, 0.2% for AGIs $100k-200k, 0.9% for AGIs over 200k)
Total itemized deductions: $20,764 (21% of AGI, reported on 43.6% of returns)
Here:
$20,764
State:
$34,985
Here:
21.0% of AGI
State:
21.3% of AGI
(% of AGI for various income ranges: 10.4% for AGIs below $25k, 12.2% for AGIs $25k-50k, 14.9% for AGIs $50k-75k, 15.4% for AGIs $75k-100k, 16.0% for AGIs $100k-200k, 14.0% for AGIs over 200k)
Charity contributions: $2,475 (reported on 36.4% of returns)
Here:
$2,475
State:
$5,572
(% of AGI for various income ranges: 0.6% for AGIs below $25k, 0.8% for AGIs $25k-50k, 1.3% for AGIs $50k-75k, 1.6% for AGIs $75k-100k, 1.6% for AGIs $100k-200k, 2.0% for AGIs over 200k)
Taxes paid: $10,685 (reported on 43.6% of returns)
12302:
$10,685
State:
$18,656
(% of AGI for various income ranges: 3.0% for AGIs below $25k, 4.8% for AGIs $25k-50k, 6.8% for AGIs $50k-75k, 7.8% for AGIs $75k-100k, 9.1% for AGIs $100k-200k, 8.9% for AGIs over 200k)
Earned income credit: $1,798 (reported on 9.2% of returns)
Here:
$1,798
State:
$2,230
(% of AGI for various income ranges: 3.4% for AGIs below $25k, 0.5% for AGIs $25k-50k)
Percentage of individuals using paid preparers for their 2012 taxes: 50.6%
Here:
51%
State:
66%
(% for various income ranges: 44.5% for AGIs below $25k, 49.3% for AGIs $25k-50k, 56.2% for AGIs $50k-75k, 52.8% for AGIs $75k-100k, 53.5% for AGIs $100k-200k, 70.0% for AGIs over 200k)
Averages for the 2004 tax year for zip code 12302, filed in 2005:
Average Adjusted Gross Income (AGI) in 2004: $50,871 (Individual Income Tax Returns)
Here:
$50,871
State:
$59,519
Salary/wage: $46,180 (reported on 80.7% of returns)
Here:
$46,180
State:
$50,673
(% of AGI for various income ranges: 105.2% for AGIs below $10k, 61.6% for AGIs $10k-25k, 73.0% for AGIs $25k-50k, 75.7% for AGIs $50k-75k, 78.2% for AGIs $75k-100k, 70.0% for AGIs over 100k)
Taxable interest for individuals: $1,198 (reported on 68.4% of returns)
This zip code:
$1,198
New York:
$2,377
(% of AGI for various income ranges: 6.1% for AGIs below $10k, 3.6% for AGIs $10k-25k, 1.9% for AGIs $25k-50k, 1.3% for AGIs $50k-75k, 1.3% for AGIs $75k-100k, 1.3% for AGIs over 100k)
Taxable dividends: $3,802 (reported on 41.7% of returns)
Here:
$3,802
State:
$5,394
(% of AGI for various income ranges: 7.8% for AGIs below $10k, 4.4% for AGIs $10k-25k, 2.8% for AGIs $25k-50k, 2.5% for AGIs $50k-75k, 2.6% for AGIs $75k-100k, 3.6% for AGIs over 100k)
Net capital gain/loss: +$4,311 (reported on 29.0% of returns)
Here:
+$4,311
State:
+$23,581
(% of AGI for various income ranges: -2.0% for AGIs below $10k, 0.1% for AGIs $10k-25k, 0.6% for AGIs $25k-50k, 1.0% for AGIs $50k-75k, 1.4% for AGIs $75k-100k, 5.6% for AGIs over 100k)
Profit/loss from business: +$11,227 (reported on 12.6% of returns)
Here:
+$11,227
State:
+$13,809
(% of AGI for various income ranges: 4.6% for AGIs below $10k, 4.5% for AGIs $10k-25k, 2.3% for AGIs $25k-50k, 2.2% for AGIs $50k-75k, 1.7% for AGIs $75k-100k, 3.6% for AGIs over 100k)
IRA payment deduction: $2,833 (reported on 2.9% of returns)
12302:
$2,833
New York:
$3,115
(% of AGI for various income ranges: 0.3% for AGIs below $10k, 0.3% for AGIs $10k-25k, 0.3% for AGIs $25k-50k, 0.2% for AGIs $50k-75k, 0.1% for AGIs $75k-100k, 0.1% for AGIs over 100k)
Self-employed pension: $11,615 (reported on 0.9% of returns)
Here:
$11,615
New York:
$19,016
(% of AGI for various income ranges: 0.1% for AGIs $25k-50k, 0.1% for AGIs $50k-75k, 0.1% for AGIs $75k-100k, 0.5% for AGIs over 100k)
Total itemized deductions: $16,870 (21% of AGI, reported on 44.5% of returns)
Here:
$16,870
State:
$25,864
Here:
20.7% of AGI
State:
21.9% of AGI
(% of AGI for various income ranges: 16.2% for AGIs below $10k, 12.2% for AGIs $10k-25k, 12.8% for AGIs $25k-50k, 15.5% for AGIs $50k-75k, 15.9% for AGIs $75k-100k, 15.1% for AGIs over 100k)
Charity contributions deductions: $2,421 (3% of AGI, reported on 40.8% of returns)
Here:
$2,421
State:
$4,439
Here:
2.9% of AGI
State:
3.6% of AGI
(% of AGI for various income ranges: 0.7% for AGIs below $10k, 0.9% for AGIs $10k-25k, 1.4% for AGIs $25k-50k, 1.7% for AGIs $50k-75k, 2.0% for AGIs $75k-100k, 2.6% for AGIs over 100k)
Total tax: $6,773 (reported on 82.4% of returns)
12302:
$6,773
State:
$11,730
(% of AGI for various income ranges: 3.0% for AGIs below $10k, 4.5% for AGIs $10k-25k, 7.2% for AGIs $25k-50k, 8.9% for AGIs $50k-75k, 10.0% for AGIs $75k-100k, 16.3% for AGIs over 100k)
Earned income credit: $1,475 (reported on 6.8% of returns)
Here:
$1,475
State:
$1,757
Percentage of individuals using paid preparers for their 2004 taxes: 54.2%
Here:
54%
State:
67%
(% for various income ranges: 42.5% for AGIs below $10k, 56.2% for AGIs $10k-25k, 57.4% for AGIs $25k-50k, 57.5% for AGIs $50k-75k, 54.9% for AGIs $75k-100k, 55.7% for AGIs over 100k)
Household received Food Stamps/SNAP in the past 12 months: 773 Household did not receive Food Stamps/SNAP in the past 12 months: 10,409
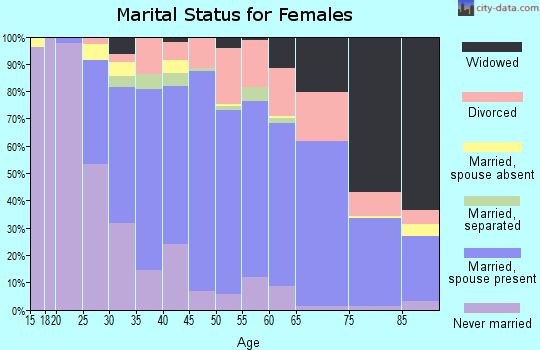
Women who had a birth in the past 12 months: 286 (276 now married, 6 unmarried) Women who did not have a birth in the past 12 months: 5,511 (2,296 now married, 3,201 unmarried)
Housing units in zip code 12302 with a mortgage: 5,144 (667 second mortgage, 21 home equity loan, 565 both second mortgage and home equity loan) Houses without a mortgage: 295
Median monthly owner costs for units with a mortgage: $1,740 Median monthly owner costs for units without a mortgage: $686
Residents with income below the poverty level in 2022:
This zip code:
5.0%
Whole state:
14.3%
Residents with income below 50% of the poverty level in 2022:
This zip code:
2.6%
Whole state:
6.8%
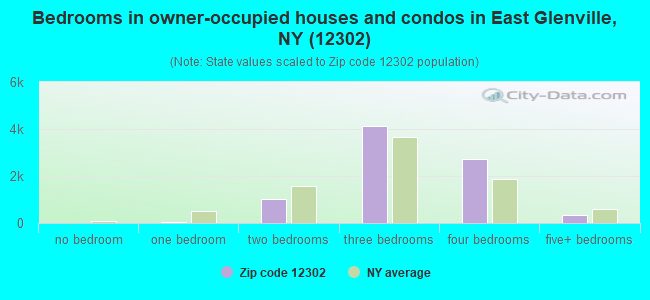
Median number of rooms in houses and condos:
Here:
6.9
State:
6.3
Median number of rooms in apartments:
Here:
3.9
State:
3.8
Notable locations in this zip code not listed on our city pages
Notable locations in zip code 12302: Scotia Railroad Station (A), Village of Scotia Sewage Disposal Plant (B), Buhrmaster Family Farm (C), Glenville Berry Farm (D), Glindmyer Evergreen Nurseries (E), Scotia Branch Schenectady County Public Library (F), Saint Josephs Hall (G), Scotia Fire Department (H), Scotia Village Hall (I), Adirondack Manor Assisted Living Center (J), Baptist Health Nursing and Rehabilitation Center (K), Glendale Nursing Home (L), Schenectady County Public Library Glenville Branch (M), Empire State Aerosciences Museum (N), Glenville Municipal Center (O), Scotia Village Hall (P), East Glenville Fire Department (Q), Rectors Volunteer Fire District (R), Glenville Hill Volunteer Fire Department (S), Beukendaal Volunteer Fire Department (T). Display/hide their locations on the map
Churches in zip code 12302 include: East Glenville Church (A), First Reformed Church (B), Saint Joseph's Roman Catholic Church (C), Saint Andrew's Episcopal Church (D), Scotia United Methodist Church (E), Our Redeemer Lutheran Church (F), First Baptist Church of Scotia (G), Believers Fellowship Center (H), Bethany Baptist Church (I). Display/hide their locations on the map
Cemeteries: Saint Anthony Cemetery (1), Glenville Center Methodist Episcopal Church Cemetery (2), Park Cemetery (3), Van Eps Cemetery (4), Vedder Cemetery (5). Display/hide their locations on the map
Streams, rivers, and creeks: Fallentree Kill (A), Crabb Kill (B), Collins Creek (C), Washout Creek (D), Chaughtanoonda Creek (E), Verf Kill (F), Indian Kill (G). Display/hide their locations on the map
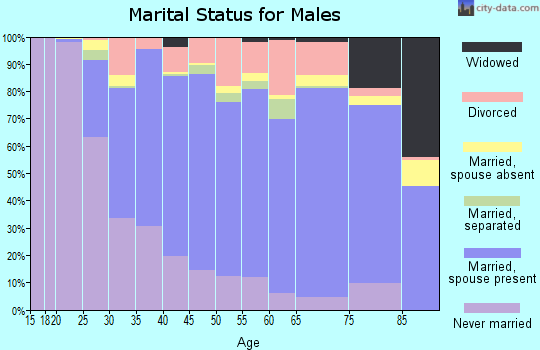
4,478 married couples with children.
1,162 single-parent households (467 men, 695 women).
94.7% of residents of 12302 zip code speak English at home.
2.6% of residents speak Spanish at home (77% very well, 9% well, 13% not well).
1.3% of residents speak other Indo-European language at home (80% very well, 14% well, 7% not well).
1.3% of residents speak Asian or Pacific Island language at home (34% very well, 64% well, 2% not well).
0.4% of residents speak other language at home (100% very well).
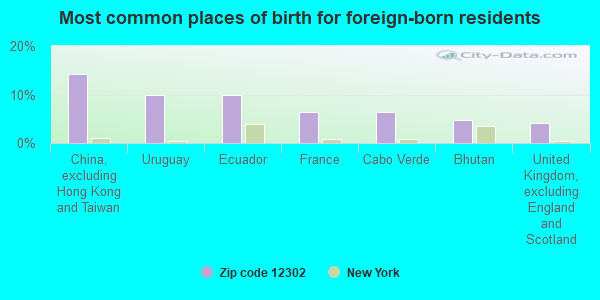
Foreign born population: 1,041 (3.8%) (80.2% of them are naturalized citizens)
This zip code:
3.8%
Whole state:
22.7%
14%China, excluding Hong Kong and Taiwan
10%Uruguay
10%Ecuador
6%France
6%Cabo Verde
5%Bhutan
4%United Kingdom, excluding England and Scotland
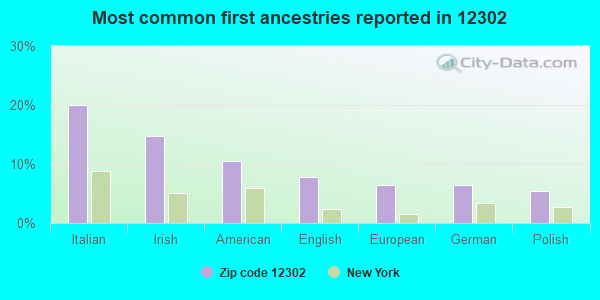
20%Italian
15%Irish
11%American
8%English
7%European
6%German
5%Polish
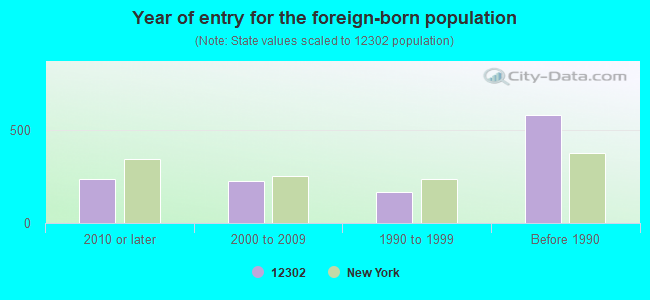
Year of entry for the foreign-born population
2362010 or later
2272000 to 2009
1651990 to 1999
578Before 1990
Major facilities with environmental interests located in this zip code:
GLENVILLE - T ALPLAUS SD (18 GLENRIDGE ROAD in GLENVILLE, NY)
STATE MASTER (New York facility tracking) - National Pollutant Discharge Elimination System Permit, National Pollutant Discharge Elimination System NON-MAJOR (Tracking pollutant discharge elimination systems) - permit Business SIC classification: SEWERAGE SYSTEMS Business NAICS classification: SEWAGE TREATMENT FACILITIES. Organizations: GLENVILLE (T) (CONTACT/OWNER)
Alternative names: ALPLAUS SEWER DISTRICT, GLENVILLE (T)
INPEAKE PACKAGING (CORPORATION PARK BUILDING 803 in SCOTIA, NY)
AIR MINOR (AIRS/AFS) STATE MASTER (New York facility tracking) - AIR PROGRAM Business SIC classification: CORRUGATED AND SOLID FIBER BOXES Business NAICS classification: CORRUGATED AND SOLID FIBER BOX MANUFACTURING. Organizations: INPEAKE PACKAGING INC (LEGALLY RESPONSIBLE PARTY)
CONIFER PARK REHABILITATION CENTER (150 GLENRIDGE RD in SCOTIA, NY)
STATE MASTER (New York facility tracking) - REFUSE DISPOSAL (Resource Conservation and Recovery Act (tracking hazardous waste)) Business SIC classification: NURSING AND PERSONAL CARE FACILITIES Alternative names: CONIFER PARK INC
ARC SCHENECTADY ( in SCOTIA, NY)
(National Center for Education Statistics) - STATE ID-530202890027 Organizations: SCOTIA-GLENVILLE CSD (SCHOOL DISTRICT)
GLEN-WORDEN ES ( in SCOTIA, NY)
(National Center for Education Statistics) - STATE ID-530202060001 Organizations: SCOTIA-GLENVILLE CSD (SCHOOL DISTRICT)
GLENDAAL SCHOOL ( in SCOTIA, NY)
(National Center for Education Statistics) - STATE ID-530202060002 Organizations: SCOTIA-GLENVILLE CSD (SCHOOL DISTRICT)
CILBERTI PLATING & POLISH (589 SARATOGA RD in SCHENECTADY, NY)
(Resource Conservation and Recovery Act (tracking hazardous waste)) Business NAICS classification: ELECTROPLATING, PLATING, POLISHING, ANODIZING, AND COLORING. Organizations: OWNERNAME (CONTACT/OWNER)
1741 VLEY RD ( in GLENVILLE, NY)
National Pollutant Discharge Elimination System NON-MAJOR (Tracking pollutant discharge elimination systems) - permit Organizations: CRANESVILLE BLOCK CO., INC (CONTACT/OWNER)
Alternative names: CRANESVILLE BLOCK CO., INC
ADIRONDACK BEVERAGES (701 CORPORATION PARK in SCOTIA, NY)
(Resource Conservation and Recovery Act (tracking hazardous waste)) TRI REPORTER (Tracking of toxic chemicals releasing facilities) Business SIC classification: BOTTLED AND CANNED SOFT DRINKS AND CARBONATED WATERS
GLENVILLE SHOP 'N SAVE (ROUTE 50 in GLENVILLE, NY)
National Pollutant Discharge Elimination System NON-MAJOR (Tracking pollutant discharge elimination systems) - permit Business SIC classification: SERVICES Organizations: HANNAFORD BROS CO (CONTACT/OWNER)
Alternative names: L V D V OPERATIONS
CUMBERLAND FARMS 3107 (222 MOWHOK & CENTER STS in SCOTIA, NY)
(Resource Conservation and Recovery Act (tracking hazardous waste))
A T & T CORP (VASSER RD in SCOTIA, NY)
(Resource Conservation and Recovery Act (tracking hazardous waste))
GETTY PETROLEUM CORPORATION #58175 (MOHAWK AVENUE & COLLINS STREET in SCOTIA, NY)
(Resource Conservation and Recovery Act (tracking hazardous waste))
Housing units lacking complete plumbing facilities: 1.2% Housing units lacking complete kitchen facilities: 1.7%
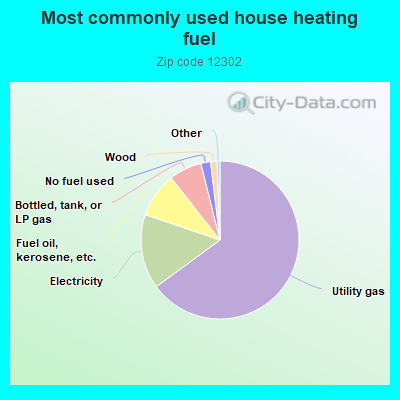
65.0%Utility gas
15.3%Electricity
9.2%Fuel oil, kerosene, etc.
6.7%Bottled, tank, or LP gas
2.0%No fuel used
1.3%Wood
Population in 1990: 27,516.
Place of birth for U.S.-born residents:
This state: 21,814
Northeast: 2,001
Midwest: 676
South: 1,080
West: 626
69% of the 12302 zip code residents lived in the same house 5 years ago. Out of people who lived in different houses, 64% lived in this county. Out of people who lived in different counties, 50% lived in New York.
90% of the 12302 zip code residents lived in the same house 1 year ago. Out of people who lived in different houses, 43% moved from this county. Out of people who lived in different houses, 44% moved from different county within same state. Out of people who lived in different houses, 11% moved from different state. Out of people who lived in different houses, 2% moved from abroad.
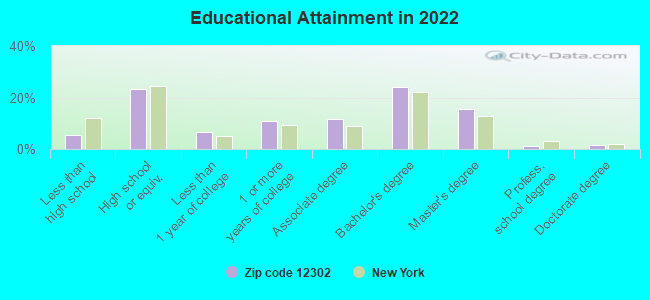
Private vs. public school enrollment:
Students in private schools in grades 1 to 8 (elementary and middle school): 189
Here:
6.6%
New York:
15.6%
Students in private schools in grades 9 to 12 (high school): 92
Here:
6.6%
New York:
15.0%
Students in private undergraduate colleges: 223
Here:
23.0%
New York:
39.2%
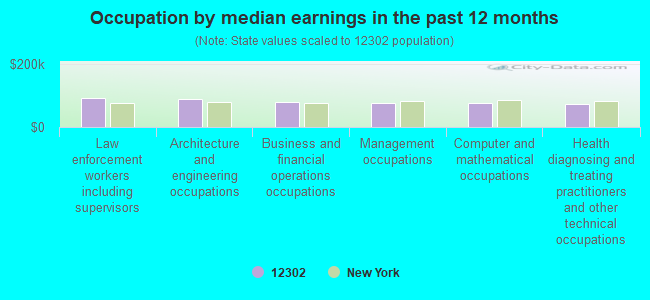
Occupation by median earnings in the past 12 months ($)
93,272Law enforcement workers including supervisors
89,174Architecture and engineering occupations
79,109Business and financial operations occupations
77,267Management occupations
77,038Computer and mathematical occupations
72,006Health diagnosing and treating practitioners and other technical occupations
Companies with biggest federal contracts located in this zip code:
BH/BL COMMUNITY HUMAN SERVICES (543 SARATOGA ROAD in GLENVILLE, NY) : $1,442,589 in 8 contractsfrom 1999 to 2004
Contracts for Other Social Services by Navy Signed by year:2000: $387,565; 2001: $0; 2002: $494,224; 2003: $387,282; 2004: $121,432; 2005: $0; 2006: $0.
Biggest contracts:
$494,224 with Navy for Other Social Services. Signed on 2002-10-31. Completion date: 2003-10-31.
$387,565, same as above.Signed on 2000-11-16. Completion date: 2001-09-30.
$387,282, same as above.Signed on 2003-11-12. Completion date: 2004-06-30.
$115,866, same as above.Signed on 2004-04-16. Completion date: 2004-09-30.
GRENO INDUSTRIES INC (2820 AMSTERDAM RD in SCOTIA, NY; small business) : $912,218 in 32 contractsfrom 2000 to 2006
Contracts for Valves, Nonpowered, Valves, Powered, Industrial Boilers, Vehicular Cab, Body, and Frame Structural Components, and moreby Navy, Army, Defense Logistics Agency Signed by year:2000: $31,184; 2001: $206,395; 2002: $447,532; 2003: $52,171; 2004: $64,596; 2005: $94,450; 2006: $15,890.
Biggest contracts:
$270,532 with Navy for Valves, Nonpowered. Signed on 2002-01-10. Completion date: 2002-06-28.
$125,184, same as above.Signed on 2001-10-17. Completion date: 2002-01-04.
$78,678 with Navy for Valves, Powered. Taking place in PA. Signed on 2001-09-22. Completion date: 2002-03-31.
$62,368 with Navy for Valves, Nonpowered. Signed on 2002-05-29. Completion date: 2002-12-05.
ADIRONDACK LANDSCAPING (1008 PLEASANTVIEW AVE in SCOTIA, NY; small business) : $127,686 in 4 contractsin 2003
$77,950 with Navy for Facilities Operations Support Services. Signed on 2003-08-13. Completion date: 2003-09-30.
$33,235, same as above.Signed on 2003-11-13. Completion date: 2003-11-30.
$27,285, same as above.Signed on 2003-11-17. Completion date: 2003-11-30.
-$10,784, same as above.Signed on 2003-11-05. Completion date: 2003-11-30.
ALARM & SUPRESSION INC (92 SARATOGA RD in SCHENECTADY, NY; small business) : $69,582 in 2 contractsin 2000
$43,282 with Defense Logistics Agency for Maintenance, Repair and Rebuilding of Equipment -- Alarm, Signal, and Security Detection Systems. Signed on 2000-03-13. Completion date: 2000-03-13.
$26,300, same as above.Signed on 2000-03-13. Completion date: 2000-03-13.
BEVERLY KEATING (156 HORSTMAN DRIVE in SCOTIA, NY; small business)
$33,000 with Army for Other Professional Services. Signed on 2002-03-21. Completion date: 2003-02-28.
007 ELECTRONICS NETWORK INC (10 REDOAK DR in SCOTIA, NY; small business)
$25,160 with Navy for Microcircuits, Electronic. Signed on 2003-04-04. Completion date: 2003-04-25.
SHAMROCK INC (51 CHARLTON ROAD in GLENVILLE, NY; small business)
$24,735 with Army for ADP Central Processing Unit (CPU, Computer), Digital. Signed on 2004-01-13. Completion date: 2004-02-13.
DOWN, ROLAND J LLC (13 AIRPORT RD in SCHENECTADY, NY; small business) : $24,297 in 2 contractsin 2004
$18,500 with Army for Construction of Structures and Facilities -- Office Buildings. Signed on 2004-09-27. Completion date: 2004-10-29.
$5,797, same as above.Signed on 2004-05-19. Completion date: 2004-06-01.
REED, CLIVE W (116 WOODHAVEN DR in SCOTIA, NY; small business)
$7,500 with Navy for Other Professional Services. Taking place in MD. Signed on 2005-09-01. Completion date: 2005-09-02.
HOME STYLE PIZZA (268 SARATOGA ROAD in GLENVILLE, NY; small business)
$6,000 with Army for Meat, Poultry, and Fish. Signed on 2004-06-08. Completion date: 2004-06-13.
Top industries in this zip code by the number of employees in 2005:
Wholesale Trade: Industrial and Personal Service Paper Merchant Wholesalers (250-499 employees: 1 establishment, 1-4 employees: 1 establishment)
Health Care and Social Assistance: Psychiatric and Substance Abuse Hospitals (250-499: 1)
Health Care and Social Assistance: Nursing Care Facilities (250-499: 1)
2002 - 2018 National Fire Incident Reporting System (NFIRS) incidents
According to the data from the years 2002 - 2018 the average number of fires per year is 108. The highest number of fires - 247 took place in 2016, and the least - 31 in 2011. The data has a rising trend.
When looking into fire subcategories, the most incidents belonged to: Other (48.4%), and Structure Fires (35.1%).
Fire incident types reported to NFIRS in Zip Code 12302


 Nearest zip codes: 12150, 12305, 12008, 12308, 12307, 12027.


 According to the data from the years 2002 - 2018 the average number of fires per year is 108. The highest number of fires - 247 took place in 2016, and the least - 31 in 2011. The data has a rising trend.
 When looking into fire subcategories, the most incidents belonged to: Other (48.4%), and Structure Fires (35.1%).