Estimated zip code population in 2022: 14,139 Zip code population in 2010: 15,335 Zip code population in 2000: 13,346
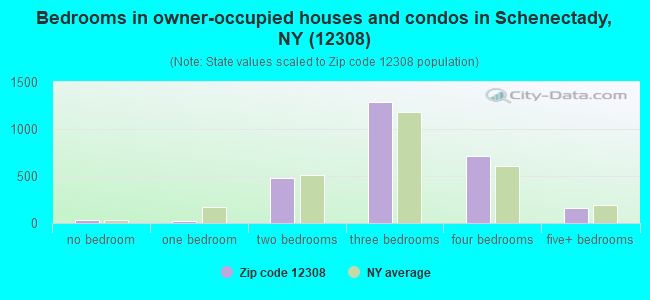
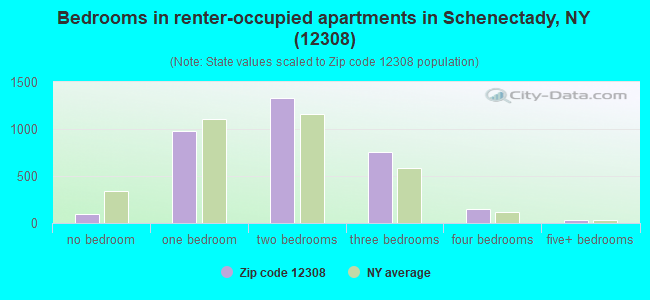
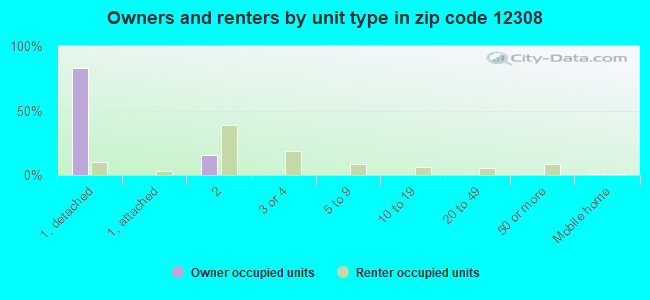
Houses and condos: 6,813 Renter-occupied apartments: 3,373
% of renters here:
56%
State:
46%
March 2022 cost of living index in zip code 12308: 105.5 (more than average, U.S. average is 100)
Land area: 2.2 sq. mi. Water area: 0.1 sq. mi.
Population density: 6,288 people per square mile
(high).
OSM Map
General Map
Google Map
MSN Map
OSM Map
General Map
Google Map
MSN Map
OSM Map
General Map
Google Map
MSN Map
OSM Map
General Map
Google Map
MSN Map
Please wait while loading the map...
Real estate property taxes paid for housing units in 2022:
This zip code:
3.1% ($5,386)
New York:
1.5% ($6,180)
Median real estate property taxes paid for housing units with mortgages in 2022: $6,012 (3.3%) Median real estate property taxes paid for housing units with no mortgage in 2022: $4,432 (2.8%)
Averages for the 2020 tax year for zip code 12308, filed in 2021:
Average Adjusted Gross Income (AGI) in 2020: $46,000 (Individual Income Tax Returns)
Here:
$46,000
State:
$90,930
Salary/wage: $39,867 (reported on 86.2% of returns)
Here:
$39,867
State:
$72,104
(% of AGI for various income ranges: 1173.3% for AGIs below $25k, 3576.8% for AGIs $25k-50k, 6889.4% for AGIs $50k-75k, 10254.8% for AGIs $75k-100k, 17228.0% for AGIs $100k-200k, 58710.0% for AGIs over 200k)
Taxable interest for individuals: $652 (reported on 21.8% of returns)
This zip code:
$652
New York:
$3,075
(% of AGI for various income ranges: 6.5% for AGIs below $25k, 6.0% for AGIs $25k-50k, 16.4% for AGIs $50k-75k, 71.4% for AGIs $75k-100k, 116.8% for AGIs $100k-200k, 303.3% for AGIs over 200k)
Ordinary dividends: $3,159 (reported on 11.3% of returns)
Here:
$3,159
State:
$11,095
(% of AGI for various income ranges: 8.8% for AGIs below $25k, 14.2% for AGIs $25k-50k, 54.0% for AGIs $50k-75k, 96.2% for AGIs $75k-100k, 262.8% for AGIs $100k-200k, 2033.3% for AGIs over 200k)
Net capital gain/loss in AGI: +$8,181 (reported on 10.2% of returns)
Here:
+$8,181
State:
+$44,925
(% of AGI for various income ranges: 5.7% for AGIs below $25k, 13.8% for AGIs $25k-50k, 68.3% for AGIs $50k-75k, 140.0% for AGIs $75k-100k, 620.4% for AGIs $100k-200k, 9163.3% for AGIs over 200k)
Profit/loss from business: +$7,457 (reported on 11.1% of returns)
Here:
+$7,457
State:
+$14,940
(% of AGI for various income ranges: 55.2% for AGIs below $25k, 66.3% for AGIs $25k-50k, 113.9% for AGIs $50k-75k, 95.9% for AGIs $75k-100k, 233.6% for AGIs $100k-200k, 5113.3% for AGIs over 200k)
Taxable individual retirement arrangement distribution: $16,779 (reported on 5.1% of returns)
12308:
$16,779
New York:
$19,609
(% of AGI for various income ranges: 21.2% for AGIs below $25k, 29.0% for AGIs $25k-50k, 101.2% for AGIs $50k-75k, 275.9% for AGIs $75k-100k, 677.2% for AGIs $100k-200k, 5113.3% for AGIs over 200k)
Total itemized deductions: $23,807 (reported on 4.1% of returns)
Here:
$23,807
State:
$39,326
(% of AGI for various income ranges: 24.3% for AGIs below $25k, 49.1% for AGIs $25k-50k, 194.2% for AGIs $50k-75k, 347.9% for AGIs $75k-100k, 672.8% for AGIs $100k-200k, 3196.7% for AGIs over 200k)
Charity contributions: $7,342 (reported on 2.9% of returns)
Here:
$7,342
State:
$15,420
(% of AGI for various income ranges: 6.8% for AGIs $25k-50k, 28.3% for AGIs $50k-75k, 52.1% for AGIs $75k-100k, 365.6% for AGIs $100k-200k)
Taxes paid: $8,293 (reported on 4.1% of returns)
12308:
$8,293
State:
$9,183
(% of AGI for various income ranges: 6.3% for AGIs below $25k, 20.1% for AGIs $25k-50k, 80.8% for AGIs $50k-75k, 148.3% for AGIs $75k-100k, 210.0% for AGIs $100k-200k, 696.7% for AGIs over 200k)
Earned income credit: $2,339 (reported on 25.7% of returns)
Here:
$2,339
State:
$2,138
(% of AGI for various income ranges: 124.2% for AGIs below $25k, 85.1% for AGIs $25k-50k)
Percentage of individuals using paid preparers for their 2020 taxes: 95.3%
Here:
95%
State:
95%
(% for various income ranges: 95.5% for AGIs below $25k, 96.4% for AGIs $25k-50k, 93.9% for AGIs $50k-75k, 93.3% for AGIs $75k-100k, 93.5% for AGIs $100k-200k, 100.0% for AGIs over 200k)
Averages for the 2012 tax year for zip code 12308, filed in 2013:
Average Adjusted Gross Income (AGI) in 2012: $39,195 (Individual Income Tax Returns)
Here:
$39,195
State:
$77,088
Salary/wage: $35,909 (reported on 86.4% of returns)
Here:
$35,909
State:
$60,593
(% of AGI for various income ranges: 79.4% for AGIs below $25k, 86.0% for AGIs $25k-50k, 81.2% for AGIs $50k-75k, 76.8% for AGIs $75k-100k, 74.2% for AGIs $100k-200k, 66.9% for AGIs over 200k)
Taxable interest for individuals: $705 (reported on 27.9% of returns)
This zip code:
$705
New York:
$3,125
(% of AGI for various income ranges: 0.6% for AGIs below $25k, 0.3% for AGIs $25k-50k, 0.5% for AGIs $50k-75k, 0.8% for AGIs $75k-100k, 0.6% for AGIs $100k-200k, 0.2% for AGIs over 200k)
Ordinary dividends: $3,851 (reported on 15.2% of returns)
Here:
$3,851
State:
$10,299
(% of AGI for various income ranges: 0.8% for AGIs below $25k, 0.7% for AGIs $25k-50k, 1.1% for AGIs $50k-75k, 0.9% for AGIs $75k-100k, 2.2% for AGIs $100k-200k, 6.0% for AGIs over 200k)
Net capital gain/loss in AGI: +$1,803 (reported on 9.7% of returns)
Here:
+$1,803
State:
+$42,474
(% of AGI for various income ranges: 0.5% for AGIs $75k-100k, 1.0% for AGIs $100k-200k, 2.8% for AGIs over 200k)
Profit/loss from business: +$8,715 (reported on 11.0% of returns)
Here:
+$8,715
State:
+$16,168
(% of AGI for various income ranges: 7.0% for AGIs below $25k, 1.5% for AGIs $25k-50k, 1.1% for AGIs $50k-75k, 1.4% for AGIs $75k-100k, 3.0% for AGIs $100k-200k)
Taxable individual retirement arrangement distribution: $12,378 (reported on 6.5% of returns)
12308:
$12,378
New York:
$17,621
(% of AGI for various income ranges: 1.4% for AGIs below $25k, 1.0% for AGIs $25k-50k, 1.4% for AGIs $50k-75k, 2.4% for AGIs $75k-100k, 4.8% for AGIs $100k-200k)
Self-employment retirement plans: $15,750 (reported on 0.3% of returns)
12308:
$15,750
New York:
$27,330
Total itemized deductions: $18,503 (23% of AGI, reported on 24.1% of returns)
Here:
$18,503
State:
$34,985
Here:
23.3% of AGI
State:
21.3% of AGI
(% of AGI for various income ranges: 5.8% for AGIs below $25k, 7.8% for AGIs $25k-50k, 12.6% for AGIs $50k-75k, 13.2% for AGIs $75k-100k, 15.7% for AGIs $100k-200k, 16.5% for AGIs over 200k)
Charity contributions: $2,752 (reported on 17.8% of returns)
Here:
$2,752
State:
$5,572
(% of AGI for various income ranges: 0.3% for AGIs below $25k, 0.6% for AGIs $25k-50k, 1.2% for AGIs $50k-75k, 1.3% for AGIs $75k-100k, 1.9% for AGIs $100k-200k, 3.8% for AGIs over 200k)
Taxes paid: $9,354 (reported on 24.1% of returns)
12308:
$9,354
State:
$18,656
(% of AGI for various income ranges: 1.8% for AGIs below $25k, 3.5% for AGIs $25k-50k, 5.9% for AGIs $50k-75k, 7.1% for AGIs $75k-100k, 9.1% for AGIs $100k-200k, 9.6% for AGIs over 200k)
Earned income credit: $2,358 (reported on 28.3% of returns)
Here:
$2,358
State:
$2,230
(% of AGI for various income ranges: 9.4% for AGIs below $25k, 1.2% for AGIs $25k-50k)
Percentage of individuals using paid preparers for their 2012 taxes: 49.9%
Here:
50%
State:
66%
(% for various income ranges: 48.8% for AGIs below $25k, 50.0% for AGIs $25k-50k, 50.6% for AGIs $50k-75k, 50.0% for AGIs $75k-100k, 54.1% for AGIs $100k-200k, 66.7% for AGIs over 200k)
Averages for the 2004 tax year for zip code 12308, filed in 2005:
Average Adjusted Gross Income (AGI) in 2004: $35,267 (Individual Income Tax Returns)
Here:
$35,267
State:
$59,519
Salary/wage: $32,442 (reported on 85.4% of returns)
Here:
$32,442
State:
$50,673
(% of AGI for various income ranges: 86.2% for AGIs below $10k, 80.7% for AGIs $10k-25k, 84.0% for AGIs $25k-50k, 80.9% for AGIs $50k-75k, 78.2% for AGIs $75k-100k, 67.4% for AGIs over 100k)
Taxable interest for individuals: $1,268 (reported on 43.0% of returns)
This zip code:
$1,268
New York:
$2,377
(% of AGI for various income ranges: 2.4% for AGIs below $10k, 1.5% for AGIs $10k-25k, 1.4% for AGIs $25k-50k, 1.6% for AGIs $50k-75k, 1.2% for AGIs $75k-100k, 1.8% for AGIs over 100k)
Taxable dividends: $3,908 (reported on 22.9% of returns)
Here:
$3,908
State:
$5,394
(% of AGI for various income ranges: 2.4% for AGIs below $10k, 1.7% for AGIs $10k-25k, 1.7% for AGIs $25k-50k, 1.8% for AGIs $50k-75k, 2.3% for AGIs $75k-100k, 5.0% for AGIs over 100k)
Net capital gain/loss: +$3,650 (reported on 16.1% of returns)
Here:
+$3,650
State:
+$23,581
(% of AGI for various income ranges: -1.3% for AGIs below $10k, -0.0% for AGIs $10k-25k, 0.6% for AGIs $25k-50k, 1.3% for AGIs $50k-75k, 1.2% for AGIs $75k-100k, 5.2% for AGIs over 100k)
Profit/loss from business: +$9,238 (reported on 9.8% of returns)
Here:
+$9,238
State:
+$13,809
(% of AGI for various income ranges: 5.1% for AGIs below $10k, 3.6% for AGIs $10k-25k, 1.4% for AGIs $25k-50k, 1.8% for AGIs $50k-75k, 2.6% for AGIs $75k-100k, 3.7% for AGIs over 100k)
IRA payment deduction: $2,652 (reported on 1.9% of returns)
12308:
$2,652
New York:
$3,115
(% of AGI for various income ranges: 0.2% for AGIs $10k-25k, 0.2% for AGIs $25k-50k, 0.2% for AGIs $50k-75k, 0.1% for AGIs over 100k)
Self-employed pension: $11,171 (reported on 0.7% of returns)
Here:
$11,171
New York:
$19,016
Total itemized deductions: $15,770 (22% of AGI, reported on 25.2% of returns)
Here:
$15,770
State:
$25,864
Here:
22.0% of AGI
State:
21.9% of AGI
(% of AGI for various income ranges: 2.9% for AGIs below $10k, 5.6% for AGIs $10k-25k, 8.9% for AGIs $25k-50k, 12.6% for AGIs $50k-75k, 14.9% for AGIs $75k-100k, 15.8% for AGIs over 100k)
Charity contributions deductions: $2,680 (4% of AGI, reported on 21.9% of returns)
Here:
$2,680
State:
$4,439
Here:
3.5% of AGI
State:
3.6% of AGI
(% of AGI for various income ranges: 0.2% for AGIs below $10k, 0.6% for AGIs $10k-25k, 0.9% for AGIs $25k-50k, 1.7% for AGIs $50k-75k, 2.1% for AGIs $75k-100k, 3.2% for AGIs over 100k)
Total tax: $4,934 (reported on 69.7% of returns)
12308:
$4,934
State:
$11,730
(% of AGI for various income ranges: 1.7% for AGIs below $10k, 3.7% for AGIs $10k-25k, 7.3% for AGIs $25k-50k, 9.7% for AGIs $50k-75k, 11.2% for AGIs $75k-100k, 17.1% for AGIs over 100k)
Earned income credit: $1,829 (reported on 23.9% of returns)
Here:
$1,829
State:
$1,757
Percentage of individuals using paid preparers for their 2004 taxes: 59.7%
Here:
60%
State:
67%
(% for various income ranges: 58.5% for AGIs below $10k, 63.8% for AGIs $10k-25k, 57.8% for AGIs $25k-50k, 58.6% for AGIs $50k-75k, 55.1% for AGIs $75k-100k, 58.1% for AGIs over 100k)
Likely homosexual households (counted as self-reported same-sex unmarried-partner households)
Lesbian couples: 0.3% of all households
Gay men: 0.2% of all households
Household received Food Stamps/SNAP in the past 12 months: 1,469 Household did not receive Food Stamps/SNAP in the past 12 months: 4,657
Women who had a birth in the past 12 months: 154 (66 now married, 89 unmarried) Women who did not have a birth in the past 12 months: 3,362 (736 now married, 2,649 unmarried)
Housing units in zip code 12308 with a mortgage: 1,463 (69 second mortgage, 41 both second mortgage and home equity loan) Houses without a mortgage: 201
Median monthly owner costs for units with a mortgage: $1,665 Median monthly owner costs for units without a mortgage: $718
Residents with income below the poverty level in 2022:
This zip code:
18.5%
Whole state:
14.3%
Residents with income below 50% of the poverty level in 2022:
This zip code:
9.8%
Whole state:
6.8%
Median number of rooms in houses and condos:
Here:
6.6
State:
6.3
Median number of rooms in apartments:
Here:
4.3
State:
3.8
Notable locations in this zip code not listed on our city pages
Notable locations in zip code 12308: City of Schenectady Sewage Treatment Plant (A), Psi Upsilon Flagpole (B), Wold House (C), Wells House (D), Webster House (E), Green House (F), John Blair Smith House (G), Richmond House (H), Raymond House (I), Potter House (J), Orange House (K), Blue House (L), Hickok House (M), Golub House (N), Fox House (O), Fero House (P), Edwards House (Q), Davidson House (R), Beuth House (S), Morton and Helen Yulman Theater (T). Display/hide their locations on the map
Churches in zip code 12308 include: Old Chapel (A), Memorial Chapel (B), First Unitarian Society of Schenectady (C), Saint Michaels Chapel (D), Westminster United Presbyterian Church (E), Calvary Orthodox Presbyterian Church (F), Second Reformed Church (G), First Church of Christ Scientist (H), New Hope Gospel Fellowship (I). Display/hide their locations on the map
Parks in zip code 12308 include: Steinmetz Park (1), Steinmetz Memorial Park (2), Chester Arthur Courtyard (3), Roger Hull Plaza (4), Jackson's Garden (5), Stanley and Geraldine Levine Wildflower Garden (6), Mrs. Perkin's Garden (7), Robison Herb Garden (8), Frank Bailey Athletic Field and Track (9). Display/hide their locations on the map
1,165 married couples with children.
912 single-parent households (110 men, 802 women).
89.5% of residents of 12308 zip code speak English at home.
4.4% of residents speak Spanish at home (69% very well, 21% well, 1% not well, 8% not at all).
2.6% of residents speak other Indo-European language at home (65% very well, 32% well, 2% not well).
2.1% of residents speak Asian or Pacific Island language at home (72% very well, 23% well, 5% not well).
1.1% of residents speak other language at home (67% very well, 19% well, 8% not well, 7% not at all).
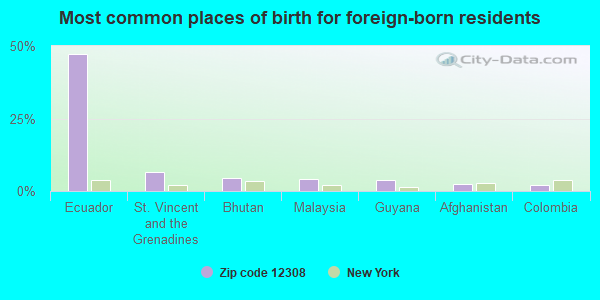
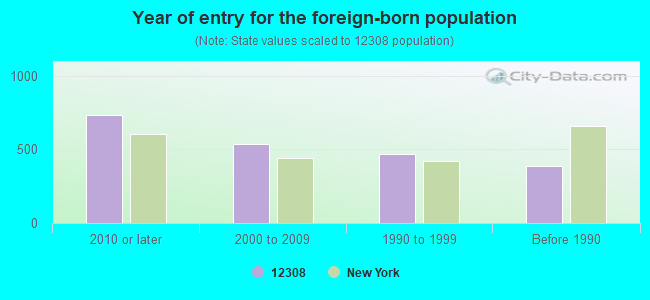
Foreign born population: 1,810 (12.8%) (68.2% of them are naturalized citizens)
Facilities with environmental interests located in this zip code:
BETTER BODY WORKS (111 NOTT TERR in SCHENECTADY, NY)
STATE MASTER (New York facility tracking) - AIR PROGRAM (Resource Conservation and Recovery Act (tracking hazardous waste))
AMERICAN BODY WORKS (1914 VAN VRANKEN AVE in SCHENECTADY, NY)
STATE MASTER (New York facility tracking) - AIR PROGRAM Conditionally Exempt Small Quantity Generators, less than 100 kg/month of hazardous waste (Resource Conservation and Recovery Act (tracking hazardous waste)) - notification Organizations: CARL ALESIO (CONTACT/OWNER)
BENCHEMARK PRINTING INC (1890 MAXON RD EXT in SCHENECTADY, NY)
Small Quantity Generators, between 100 kg and 1000 kg of hazardous waste/month (Resource Conservation and Recovery Act (tracking hazardous waste)) Small Quantity Generators, between 100 kg and 1000 kg of hazardous waste/month (Resource Conservation and Recovery Act (tracking hazardous waste)) Business NAICS classification: OTHER COMMERCIAL PRINTING. Organizations: ROBERT J JOSINESKI (CONTACT/OPERATOR)
, ROBERT J KOSINESKI (CONTACT/OPERATOR)
A-1 WASTE SERVICE INC (2117 LENOX RD in SCHENECTADY, NY)
(Resource Conservation and Recovery Act (tracking hazardous waste))
AMERICAN FURNITURE RESTORATION (1596 RUGBY RD in SCHENECTADY, NY)
(Resource Conservation and Recovery Act (tracking hazardous waste))
ANNIE SCHAFFER SENIOR CENTER (101 NOTT TER in SCHENECTADY, NY)
(Resource Conservation and Recovery Act (tracking hazardous waste))
HESS STATION #32211 (451 NOTT ST in SCHENECTADY, NY)
Small Quantity Generators, between 100 kg and 1000 kg of hazardous waste/month (Resource Conservation and Recovery Act (tracking hazardous waste)) Organizations: AMERADA HESS CORP (CONTACT/OPERATOR)
J G D PLATING INCORPORATED (1776 FOSTER AVENUE in SCHENECTADY, NY)
(Resource Conservation and Recovery Act (tracking hazardous waste)) Business NAICS classification: ELECTROPLATING, PLATING, POLISHING, ANODIZING, AND COLORING.
ALB SCHO SCHDY BOCES (THE PLAZA in SCHENECTADY, NY)
Small Quantity Generators, between 100 kg and 1000 kg of hazardous waste/month (Resource Conservation and Recovery Act (tracking hazardous waste)) - notification Organizations: NYS DORM AUTHORITY (CONTACT/OWNER)
IMITEC, INC (MAXON RD in SCHENECTADY, NY)
COMPLIANCE ACTIVITY (Tracking inspections of insecticide, fungicide, and rodenticide, and toxic substances)
Housing units lacking complete plumbing facilities: 0.9% Housing units lacking complete kitchen facilities: 1.1%
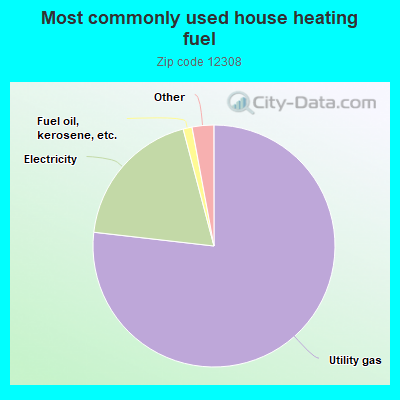
76.9%Utility gas
19.1%Electricity
1.2%Fuel oil, kerosene, etc.
0.9%Bottled, tank, or LP gas
0.8%No fuel used
0.7%Other fuel
Population in 1990: 14,055.
Place of birth for U.S.-born residents:
This state: 9,525
Northeast: 1,469
Midwest: 295
South: 488
West: 244
48% of the 12308 zip code residents lived in the same house 5 years ago. Out of people who lived in different houses, 62% lived in this county. Out of people who lived in different counties, 50% lived in New York.
88% of the 12308 zip code residents lived in the same house 1 year ago. Out of people who lived in different houses, 47% moved from this county. Out of people who lived in different houses, 46% moved from different county within same state. Out of people who lived in different houses, 6% moved from different state. Out of people who lived in different houses, 1% moved from abroad.
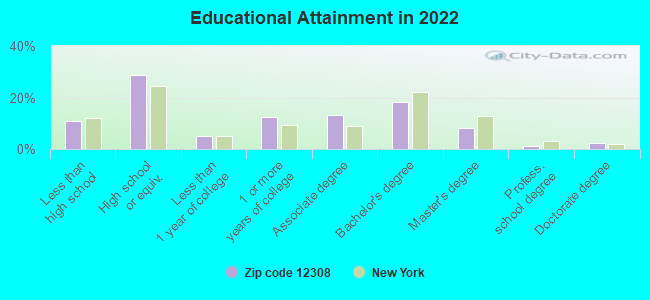
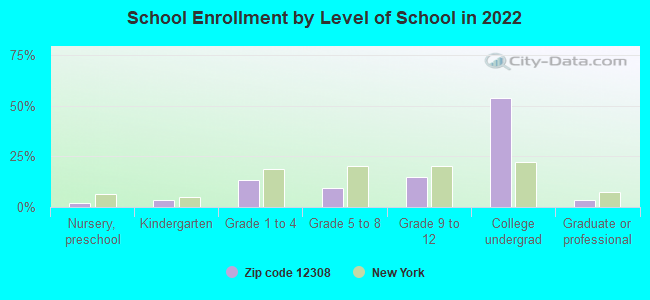
Private vs. public school enrollment:
Students in private schools in grades 1 to 8 (elementary and middle school): 132
Here:
14.8%
New York:
15.6%
Students in private schools in grades 9 to 12 (high school): 85
Here:
14.8%
New York:
15.0%
Students in private undergraduate colleges: 1,735
Here:
80.4%
New York:
39.2%
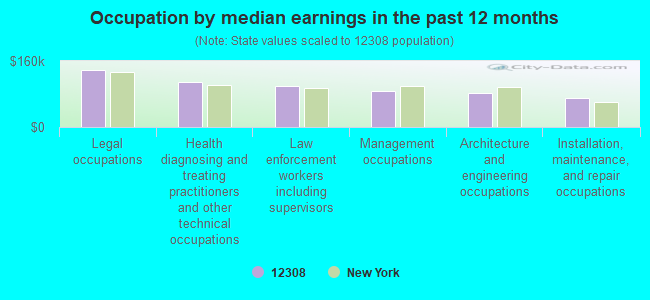
Occupation by median earnings in the past 12 months ($)
139,256Legal occupations
109,027Health diagnosing and treating practitioners and other technical occupations
98,914Law enforcement workers including supervisors
86,934Management occupations
83,578Architecture and engineering occupations
70,830Installation, maintenance, and repair occupations
Companies with federal contracts located in this zip code (SCHENECTADY, NY):
DISABLED AMERICAN VETERAN SERV (1201 STRATFORD; small business) : $114,341 in 14 contractsfrom 2003 to 2006
Contracts for Maintenance, Repair or Alteration of Real Property -- Office Buildings, Maintenance, Repair or Alteration of Real Property -- Other Administrative Facilities and Service Buildings, Other Housekeeping Services, Maintenance, Repair or Alteration of Real Property -- Maintenance Buildings by Army Signed by year:2000: $0; 2001: $0; 2002: $0; 2003: $3,232; 2004: $117,371; 2005: -$4,962; 2006: -$1,300.
Biggest contracts:
$63,803 with Army for Maintenance, Repair or Alteration of Real Property -- Office Buildings. Signed on 2004-09-28. Completion date: 2004-12-27.
$43,958, same as above.Signed on 2004-09-29. Completion date: 2004-12-21.
$28,805 with Army for Maintenance, Repair or Alteration of Real Property -- Other Administrative Facilities and Service Buildings. Signed on 2005-03-21. Completion date: 2005-04-29.
$8,820 with Army for Maintenance, Repair or Alteration of Real Property -- Office Buildings. Signed on 2004-05-13. Completion date: 2004-06-21.
CLIFFORD R GRAY, INC (2360 MAXON RD EXT; small business)
$80,937 with Army for Coils and Transformers. Taking place in SC. Signed on 2006-03-03. Completion date: 2006-06-08.
UNION COLLEGE (807 UNION ST) : $37,001 in 2 contractsfrom 2004 to 2005
$20,000 with Army for Educational Services. Signed on 2005-08-16. Completion date: 2005-08-16.
$17,001, same as above.Signed on 2004-09-23. Completion date: 2004-09-23.
PREMIER HOSPITALITY PROPERTIES (450 NOTT ST; small business)
$30,380 with Army for Lodging - Hotel/Motel. Signed on 2003-02-07. Completion date: 2003-02-10.
Top industries in this zip code by the number of employees in 2005:
Educational Services: Colleges, Universities, and Professional Schools (over 1000 employees: 1 establishment, 50-99 employees: 1 establishment)
Health Care and Social Assistance: General Medical and Surgical Hospitals (over 1000: 1)
Health Care and Social Assistance: Specialty (except Psychiatric and Substance Abuse) Hospitals (500-999: 1)
Health Care and Social Assistance: Offices of Physicians (except Mental Health Specialists) (50-99: 2, 20-49: 3, 10-19: 8, 5-9: 5, 1-4: 22)
Health Care and Social Assistance: Offices of Dentists (20-49: 1, 10-19: 2, 5-9: 5, 1-4: 4)
2004 - 2018 National Fire Incident Reporting System (NFIRS) incidents
According to the data from the years 2004 - 2018 the average number of fires per year is 98. The highest number of fires - 145 took place in 2005, and the least - 0 in 2010. The data has a declining trend.
When looking into fire subcategories, the most incidents belonged to: Structure Fires (73.0%), and Outside Fires (16.0%).
Fire incident types reported to NFIRS in Zip Code 12308


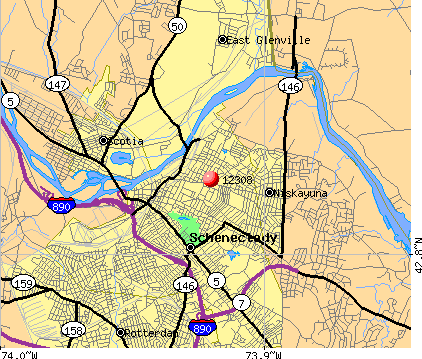 Nearest zip codes: 12307, 12305, 12008, 12304, 12309, 12303.


 According to the data from the years 2004 - 2018 the average number of fires per year is 98. The highest number of fires - 145 took place in 2005, and the least - 0 in 2010. The data has a declining trend.
 When looking into fire subcategories, the most incidents belonged to: Structure Fires (73.0%), and Outside Fires (16.0%).