Estimated zip code population in 2022: 32,803 Zip code population in 2010: 29,343 Zip code population in 2000: 30,057
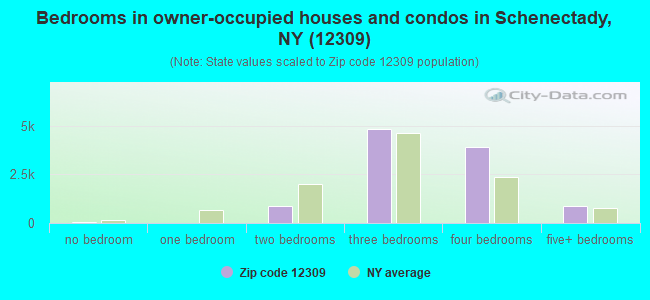
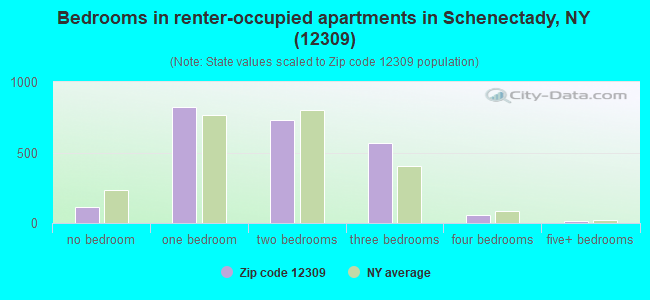
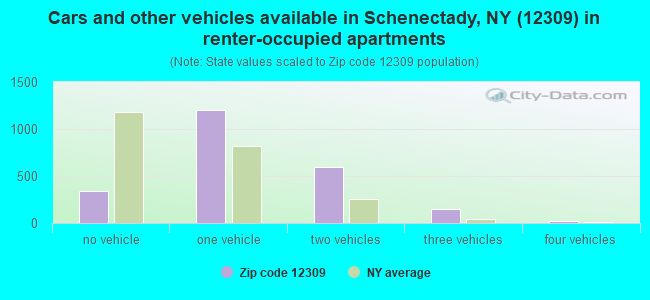
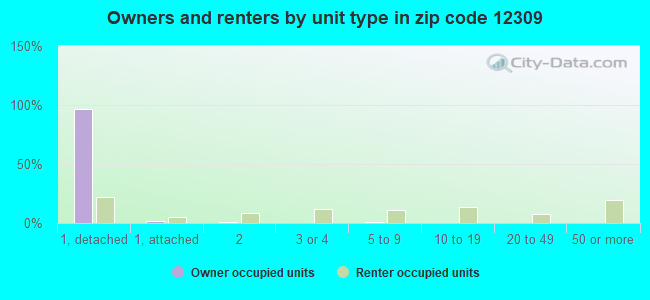
Houses and condos: 13,699 Renter-occupied apartments: 2,311
% of renters here:
18%
State:
46%
March 2022 cost of living index in zip code 12309: 105.8 (more than average, U.S. average is 100)
Land area: 16.6 sq. mi. Water area: 0.9 sq. mi.
Population density: 1,980 people per square mile
(low).
OSM Map
General Map
Google Map
MSN Map
OSM Map
General Map
Google Map
MSN Map
OSM Map
General Map
Google Map
MSN Map
OSM Map
General Map
Google Map
MSN Map
Please wait while loading the map...
Real estate property taxes paid for housing units in 2022:
This zip code:
2.4% ($7,221)
New York:
1.5% ($6,180)
Median real estate property taxes paid for housing units with mortgages in 2022: $7,696 (2.5%) Median real estate property taxes paid for housing units with no mortgage in 2022: $6,503 (2.2%)
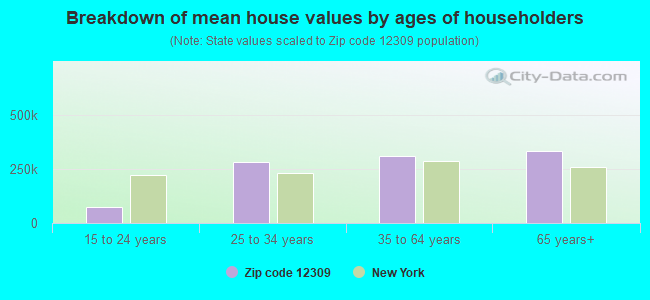
Estimated median house/condo value in 2022: $296,052
12309:
$296,052
New York:
$400,400
According to our research of New York and other state lists, there were 9 registered sex offenders living in 12309 zip code as of May 09, 2024. The ratio of all residents to sex offenders in zip code 12309 is 3,371 to 1. The ratio of registered sex offenders to all residents in this zip code is much lower than the state average.
Median resident age:
This zip code:
42.6 years
New York median age:
40.0 years
Average household size:
This zip code:
2.5 people
New York:
2.5 people
Averages for the 2020 tax year for zip code 12309, filed in 2021:
Average Adjusted Gross Income (AGI) in 2020: $107,560 (Individual Income Tax Returns)
Here:
$107,560
State:
$90,930
Salary/wage: $90,995 (reported on 79.4% of returns)
Here:
$90,995
State:
$72,104
(% of AGI for various income ranges: 1113.3% for AGIs below $25k, 3576.5% for AGIs $25k-50k, 6075.4% for AGIs $50k-75k, 8874.0% for AGIs $75k-100k, 18139.3% for AGIs $100k-200k, 87007.1% for AGIs over 200k)
Taxable interest for individuals: $1,529 (reported on 51.1% of returns)
This zip code:
$1,529
New York:
$3,075
(% of AGI for various income ranges: 20.1% for AGIs below $25k, 37.8% for AGIs $25k-50k, 56.7% for AGIs $50k-75k, 91.5% for AGIs $75k-100k, 181.4% for AGIs $100k-200k, 1010.8% for AGIs over 200k)
Ordinary dividends: $8,018 (reported on 35.1% of returns)
Here:
$8,018
State:
$11,095
(% of AGI for various income ranges: 54.0% for AGIs below $25k, 86.9% for AGIs $25k-50k, 143.5% for AGIs $50k-75k, 271.5% for AGIs $75k-100k, 521.6% for AGIs $100k-200k, 4762.9% for AGIs over 200k)
Net capital gain/loss in AGI: +$21,536 (reported on 29.7% of returns)
Here:
+$21,536
State:
+$44,925
(% of AGI for various income ranges: 20.5% for AGIs below $25k, 69.2% for AGIs $25k-50k, 125.3% for AGIs $50k-75k, 225.3% for AGIs $75k-100k, 601.3% for AGIs $100k-200k, 15656.7% for AGIs over 200k)
Profit/loss from business: +$23,255 (reported on 14.5% of returns)
Here:
+$23,255
State:
+$14,940
(% of AGI for various income ranges: 86.4% for AGIs below $25k, 111.2% for AGIs $25k-50k, 146.4% for AGIs $50k-75k, 269.5% for AGIs $75k-100k, 570.6% for AGIs $100k-200k, 6043.3% for AGIs over 200k)
Taxable individual retirement arrangement distribution: $21,604 (reported on 12.5% of returns)
12309:
$21,604
New York:
$19,609
(% of AGI for various income ranges: 66.9% for AGIs below $25k, 129.4% for AGIs $25k-50k, 207.9% for AGIs $50k-75k, 435.6% for AGIs $75k-100k, 774.1% for AGIs $100k-200k, 2593.8% for AGIs over 200k)
Self-employed (Keogh) retirement plans: $23,950 (reported on 1.6% of returns)
12309:
$23,950
New York:
$32,497
(% of AGI for various income ranges: 25.4% for AGIs $50k-75k, 58.9% for AGIs $100k-200k, 876.2% for AGIs over 200k)
Total itemized deductions: $31,489 (reported on 11.4% of returns)
Here:
$31,489
State:
$39,326
(% of AGI for various income ranges: 108.2% for AGIs below $25k, 195.0% for AGIs $25k-50k, 389.6% for AGIs $50k-75k, 571.6% for AGIs $75k-100k, 750.5% for AGIs $100k-200k, 4109.2% for AGIs over 200k)
Charity contributions: $12,659 (reported on 8.9% of returns)
Here:
$12,659
State:
$15,420
(% of AGI for various income ranges: 4.6% for AGIs below $25k, 11.2% for AGIs $25k-50k, 40.5% for AGIs $50k-75k, 97.8% for AGIs $75k-100k, 186.6% for AGIs $100k-200k, 2232.9% for AGIs over 200k)
Taxes paid: $9,011 (reported on 11.2% of returns)
12309:
$9,011
State:
$9,183
(% of AGI for various income ranges: 19.3% for AGIs below $25k, 43.4% for AGIs $25k-50k, 148.8% for AGIs $50k-75k, 228.9% for AGIs $75k-100k, 250.8% for AGIs $100k-200k, 810.4% for AGIs over 200k)
Earned income credit: $1,886 (reported on 6.9% of returns)
Here:
$1,886
State:
$2,138
(% of AGI for various income ranges: 49.2% for AGIs below $25k, 48.2% for AGIs $25k-50k)
Percentage of individuals using paid preparers for their 2020 taxes: 94.4%
Here:
94%
State:
95%
(% for various income ranges: 93.0% for AGIs below $25k, 94.7% for AGIs $25k-50k, 94.3% for AGIs $50k-75k, 95.0% for AGIs $75k-100k, 94.7% for AGIs $100k-200k, 95.7% for AGIs over 200k)
Averages for the 2012 tax year for zip code 12309, filed in 2013:
Average Adjusted Gross Income (AGI) in 2012: $90,459 (Individual Income Tax Returns)
Here:
$90,459
State:
$77,088
Salary/wage: $74,225 (reported on 81.1% of returns)
Here:
$74,225
State:
$60,593
(% of AGI for various income ranges: 69.3% for AGIs below $25k, 72.0% for AGIs $25k-50k, 69.0% for AGIs $50k-75k, 70.5% for AGIs $75k-100k, 73.5% for AGIs $100k-200k, 55.9% for AGIs over 200k)
Taxable interest for individuals: $1,408 (reported on 57.8% of returns)
This zip code:
$1,408
New York:
$3,125
(% of AGI for various income ranges: 1.7% for AGIs below $25k, 1.0% for AGIs $25k-50k, 1.0% for AGIs $50k-75k, 0.8% for AGIs $75k-100k, 0.8% for AGIs $100k-200k, 1.0% for AGIs over 200k)
Ordinary dividends: $6,944 (reported on 41.0% of returns)
Here:
$6,944
State:
$10,299
(% of AGI for various income ranges: 4.6% for AGIs below $25k, 2.8% for AGIs $25k-50k, 2.6% for AGIs $50k-75k, 2.7% for AGIs $75k-100k, 2.6% for AGIs $100k-200k, 3.9% for AGIs over 200k)
Net capital gain/loss in AGI: +$7,627 (reported on 29.7% of returns)
Here:
+$7,627
State:
+$42,474
(% of AGI for various income ranges: 0.2% for AGIs $25k-50k, 0.4% for AGIs $50k-75k, 0.9% for AGIs $75k-100k, 1.1% for AGIs $100k-200k, 5.8% for AGIs over 200k)
Profit/loss from business: +$23,048 (reported on 14.8% of returns)
Here:
+$23,048
State:
+$16,168
(% of AGI for various income ranges: 5.6% for AGIs below $25k, 2.5% for AGIs $25k-50k, 2.4% for AGIs $50k-75k, 2.2% for AGIs $75k-100k, 2.9% for AGIs $100k-200k, 5.7% for AGIs over 200k)
Taxable individual retirement arrangement distribution: $20,149 (reported on 14.4% of returns)
12309:
$20,149
New York:
$17,621
(% of AGI for various income ranges: 3.6% for AGIs below $25k, 3.1% for AGIs $25k-50k, 3.1% for AGIs $50k-75k, 3.0% for AGIs $75k-100k, 3.4% for AGIs $100k-200k, 3.1% for AGIs over 200k)
Self-employment retirement plans: $22,300 (reported on 2.0% of returns)
12309:
$22,300
New York:
$27,330
(% of AGI for various income ranges: 0.5% for AGIs $50k-75k, 0.4% for AGIs $100k-200k, 1.0% for AGIs over 200k)
Total itemized deductions: $26,955 (19% of AGI, reported on 52.8% of returns)
Here:
$26,955
State:
$34,985
Here:
19.1% of AGI
State:
21.3% of AGI
(% of AGI for various income ranges: 16.2% for AGIs below $25k, 14.4% for AGIs $25k-50k, 16.1% for AGIs $50k-75k, 16.8% for AGIs $75k-100k, 16.9% for AGIs $100k-200k, 14.3% for AGIs over 200k)
Charity contributions: $3,932 (reported on 45.5% of returns)
Here:
$3,932
State:
$5,572
(% of AGI for various income ranges: 0.9% for AGIs below $25k, 1.2% for AGIs $25k-50k, 1.4% for AGIs $50k-75k, 1.7% for AGIs $75k-100k, 2.0% for AGIs $100k-200k, 2.4% for AGIs over 200k)
Taxes paid: $15,191 (reported on 52.7% of returns)
12309:
$15,191
State:
$18,656
(% of AGI for various income ranges: 5.0% for AGIs below $25k, 6.0% for AGIs $25k-50k, 7.6% for AGIs $50k-75k, 8.6% for AGIs $75k-100k, 9.6% for AGIs $100k-200k, 9.5% for AGIs over 200k)
Earned income credit: $1,876 (reported on 6.9% of returns)
Here:
$1,876
State:
$2,230
(% of AGI for various income ranges: 3.2% for AGIs below $25k, 0.6% for AGIs $25k-50k)
Percentage of individuals using paid preparers for their 2012 taxes: 51.9%
Here:
52%
State:
66%
(% for various income ranges: 45.6% for AGIs below $25k, 50.8% for AGIs $25k-50k, 54.8% for AGIs $50k-75k, 52.9% for AGIs $75k-100k, 52.9% for AGIs $100k-200k, 68.3% for AGIs over 200k)
Averages for the 2004 tax year for zip code 12309, filed in 2005:
Average Adjusted Gross Income (AGI) in 2004: $73,540 (Individual Income Tax Returns)
Here:
$73,540
State:
$59,519
Salary/wage: $62,601 (reported on 79.8% of returns)
Here:
$62,601
State:
$50,673
(% of AGI for various income ranges: 129.1% for AGIs below $10k, 64.6% for AGIs $10k-25k, 71.0% for AGIs $25k-50k, 71.7% for AGIs $50k-75k, 75.5% for AGIs $75k-100k, 64.0% for AGIs over 100k)
Taxable interest for individuals: $1,737 (reported on 73.8% of returns)
This zip code:
$1,737
New York:
$2,377
(% of AGI for various income ranges: 10.2% for AGIs below $10k, 4.0% for AGIs $10k-25k, 2.3% for AGIs $25k-50k, 1.8% for AGIs $50k-75k, 1.3% for AGIs $75k-100k, 1.5% for AGIs over 100k)
Taxable dividends: $6,655 (reported on 49.4% of returns)
Here:
$6,655
State:
$5,394
(% of AGI for various income ranges: 17.2% for AGIs below $10k, 4.3% for AGIs $10k-25k, 3.6% for AGIs $25k-50k, 3.3% for AGIs $50k-75k, 3.1% for AGIs $75k-100k, 5.1% for AGIs over 100k)
Net capital gain/loss: +$10,476 (reported on 38.8% of returns)
Here:
+$10,476
State:
+$23,581
(% of AGI for various income ranges: -6.6% for AGIs below $10k, 0.4% for AGIs $10k-25k, 1.1% for AGIs $25k-50k, 1.0% for AGIs $50k-75k, 1.8% for AGIs $75k-100k, 8.7% for AGIs over 100k)
Profit/loss from business: +$20,066 (reported on 14.7% of returns)
Here:
+$20,066
State:
+$13,809
(% of AGI for various income ranges: -6.0% for AGIs below $10k, 5.3% for AGIs $10k-25k, 3.1% for AGIs $25k-50k, 2.8% for AGIs $50k-75k, 2.7% for AGIs $75k-100k, 4.8% for AGIs over 100k)
IRA payment deduction: $3,030 (reported on 3.2% of returns)
12309:
$3,030
New York:
$3,115
(% of AGI for various income ranges: 0.6% for AGIs below $10k, 0.3% for AGIs $10k-25k, 0.4% for AGIs $25k-50k, 0.2% for AGIs $50k-75k, 0.2% for AGIs $75k-100k, 0.1% for AGIs over 100k)
Self-employed pension: $16,379 (reported on 2.4% of returns)
Here:
$16,379
New York:
$19,016
(% of AGI for various income ranges: 0.4% for AGIs below $10k, 0.2% for AGIs $25k-50k, 0.1% for AGIs $50k-75k, 0.2% for AGIs $75k-100k, 0.8% for AGIs over 100k)
Total itemized deductions: $22,416 (19% of AGI, reported on 51.7% of returns)
Here:
$22,416
State:
$25,864
Here:
19.0% of AGI
State:
21.9% of AGI
(% of AGI for various income ranges: 24.3% for AGIs below $10k, 12.5% for AGIs $10k-25k, 15.7% for AGIs $25k-50k, 17.1% for AGIs $50k-75k, 17.4% for AGIs $75k-100k, 15.1% for AGIs over 100k)
Charity contributions deductions: $3,915 (3% of AGI, reported on 48.3% of returns)
Here:
$3,915
State:
$4,439
Here:
3.2% of AGI
State:
3.6% of AGI
(% of AGI for various income ranges: 1.1% for AGIs below $10k, 1.0% for AGIs $10k-25k, 1.6% for AGIs $25k-50k, 2.2% for AGIs $50k-75k, 2.4% for AGIs $75k-100k, 3.0% for AGIs over 100k)
Total tax: $12,932 (reported on 83.0% of returns)
12309:
$12,932
State:
$11,730
(% of AGI for various income ranges: 3.7% for AGIs below $10k, 4.7% for AGIs $10k-25k, 7.6% for AGIs $25k-50k, 9.3% for AGIs $50k-75k, 10.2% for AGIs $75k-100k, 18.8% for AGIs over 100k)
Earned income credit: $1,365 (reported on 4.9% of returns)
Here:
$1,365
State:
$1,757
Percentage of individuals using paid preparers for their 2004 taxes: 54.1%
Here:
54%
State:
67%
(% for various income ranges: 47.2% for AGIs below $10k, 53.6% for AGIs $10k-25k, 55.7% for AGIs $25k-50k, 56.2% for AGIs $50k-75k, 54.0% for AGIs $75k-100k, 57.7% for AGIs over 100k)
Likely homosexual households (counted as self-reported same-sex unmarried-partner households)
Lesbian couples: 0.0% of all households
Gay men: 0.0% of all households
Household received Food Stamps/SNAP in the past 12 months: 518 Household did not receive Food Stamps/SNAP in the past 12 months: 12,253
Women who had a birth in the past 12 months: 385 (379 now married, 0 unmarried) Women who did not have a birth in the past 12 months: 6,298 (3,093 now married, 3,166 unmarried)
Housing units in zip code 12309 with a mortgage: 6,528 (794 second mortgage, 76 home equity loan, 717 both second mortgage and home equity loan) Houses without a mortgage: 345
Median monthly owner costs for units with a mortgage: $2,089 Median monthly owner costs for units without a mortgage: $849
Residents with income below the poverty level in 2022:
This zip code:
3.7%
Whole state:
14.3%
Residents with income below 50% of the poverty level in 2022:
This zip code:
2.1%
Whole state:
6.8%
Median number of rooms in houses and condos:
Here:
7.5
State:
6.3
Median number of rooms in apartments:
Here:
4.1
State:
3.8
Notable locations in this zip code not listed on our city pages
Notable locations in zip code 12309: Mohawk Golf Club (A), Niskayuna Modification and Test Plant (B), Mohawk Golf Course (C), Niskayuna Fire District Station 1 (D), Schenectady Curling Club (E), Clare Bridge of Niskayuna Assisted Living Center (F), Heritage Home for Women Assisted Living Center (G), Northwoods Rehabilitation and Extended Care Facility at Hilltop (H), The Terrace at Glen Eddy Assisted Living Center (I), Wynwood of Niskayuna Assisted Living Center (J), Adirondack Research Library (K), Schenectady County Public Library Niskayuna Branch (L), Niskayuna Town Hall (M), Niskayuna Fire Company (N). Display/hide their locations on the map
Shopping Centers: Van Antwerp Shopping Center (1), Shaker Pine Mall Shopping Center (2), Saint James Square Shopping Center (3). Display/hide their locations on the map
Churches in zip code 12309 include: Our Lady of Grace Dominican Retreat House (A), Our Lady of Fatima Roman Catholic Church (B), First Assembly of God Church (C), Temple Gates of Heaven Synagogue (D), Balltown Wesleyan Church (E), Saint Helens Roman Catholic Church (F), Eastern Parkway Methodist Church (G), Reformed Church In America (H), Saint Stephens Episcopal Church (I). Display/hide their locations on the map
In group quarters: 496 (-1 institutionalized population)
Size of family households: 4,081 2-persons, 1,815 3-persons, 1,729 4-persons, 802 5-persons, 261 6-persons, 67 7-or-more-persons
Size of nonfamily households: 3,445 1-person, 670 2-persons, 56 4-persons
6,445 married couples with children.
840 single-parent households (382 men, 458 women).
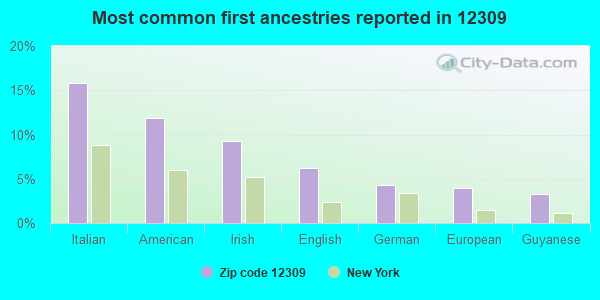
90.6% of residents of 12309 zip code speak English at home.
1.6% of residents speak Spanish at home (95% very well, 3% well, 2% not well).
3.9% of residents speak other Indo-European language at home (69% very well, 25% well, 5% not well, 1% not at all).
3.6% of residents speak Asian or Pacific Island language at home (73% very well, 22% well, 5% not well).
0.3% of residents speak other language at home (100% very well).
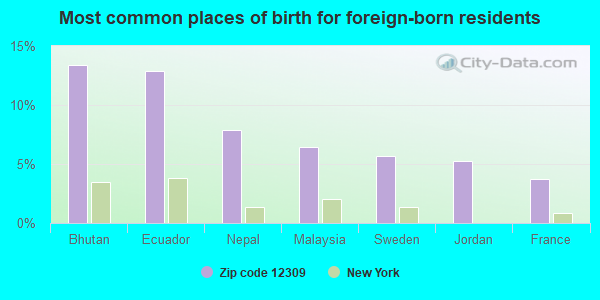
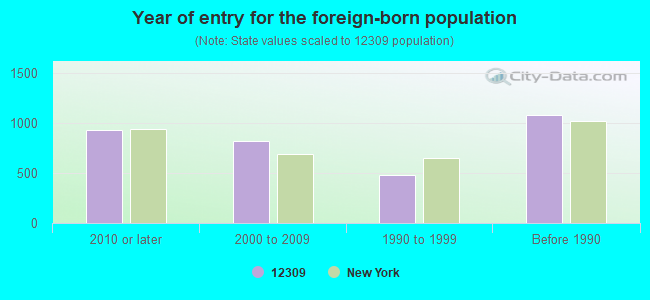
Foreign born population: 3,086 (9.4%) (72.3% of them are naturalized citizens)
Facilities with environmental interests located in this zip code:
HARTZ FAMILY CLEANERS (1714 UNION STREET in SCHENECTADY, NY)
AIR SYNTHETIC MINOR (AIRS/AFS) STATE MASTER (New York facility tracking) - AIR PROGRAM, HAZARDOUS WASTE PROGRAM Small Quantity Generators, between 100 kg and 1000 kg of hazardous waste/month (Resource Conservation and Recovery Act (tracking hazardous waste)) - notification Business SIC classification: DRYCLEANING PLANTS, EXCEPT RUG CLEANING Business NAICS classification: DRYCLEANING AND LAUNDRY SERVICES (EXCEPT COIN-OPERATED). Organizations: STEPHEN HARTZ (CONTACT/OWNER)
CRAIG SCHOOL ( in SCHENECTADY, NY)
(Geographic Names Information System) (National Center for Education Statistics) - STATE ID-530301060002 Organizations: NISKAYUNA CSD (SCHOOL DISTRICT)
HILLSIDE SCHOOL ( in SCHENECTADY, NY)
(National Center for Education Statistics) - STATE ID-530301060004 Organizations: NISKAYUNA CSD (SCHOOL DISTRICT)
HOWE INTNTL MAGNET SCHOOL ( in SCHENECTADY, NY)
(National Center for Education Statistics) - STATE ID-530600010010 Organizations: SCHENECTADY CITY SD (SCHOOL DISTRICT)
IROQUOIS MS ( in SCHENECTADY, NY)
(National Center for Education Statistics) - STATE ID-530301060008 Organizations: NISKAYUNA CSD (SCHOOL DISTRICT)
BELLEVUE MATERNITY HOSPITAL INCORPORATED (2210 TROY ROAD in SCHENECTADY, NY)
Small Quantity Generators, between 100 kg and 1000 kg of hazardous waste/month (Resource Conservation and Recovery Act (tracking hazardous waste)) - ICIS-, ENFORCEMENT/COMPLIANCE ACTIVITY, ICIS-02-2004-0878,
BEVIS HILL SUBSTATION (BALLTOWN RD in NISKAYUNA, NY)
(Resource Conservation and Recovery Act (tracking hazardous waste))
CON DIESEL MOBILE EQUIPMENT DIVISION (HILLSIDE AVE in SCHENECTADY, NY)
(Resource Conservation and Recovery Act (tracking hazardous waste)) Business NAICS classification: ALL OTHER TRANSPORTATION EQUIPMENT MANUFACTURING.
GETTY PETROLEUM CORP (3159 TROY SCHENECTADY RD in NISKAYUNA, NY)
Small Quantity Generators, between 100 kg and 1000 kg of hazardous waste/month (Resource Conservation and Recovery Act (tracking hazardous waste)) - notification
HILLSIDE ELEMENTARY SCHOOL (1100 CORNELIUS AVE in NISKAYUNA, NY)
Small Quantity Generators, between 100 kg and 1000 kg of hazardous waste/month (Resource Conservation and Recovery Act (tracking hazardous waste)) - notification Organizations: NISKAYUNA SCHOOL DIST (CONTACT/OWNER)
Housing units lacking complete plumbing facilities: 0.2% Housing units lacking complete kitchen facilities: 1.0%
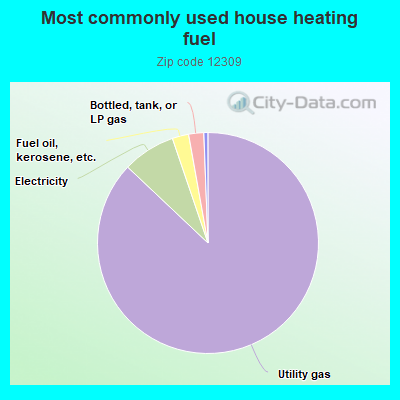
86.8%Utility gas
7.7%Electricity
2.4%Fuel oil, kerosene, etc.
2.2%Bottled, tank, or LP gas
0.6%Other fuel
Population in 1990: 27,928. Population change in the 1990s: +2,129 (+7.6%).
Place of birth for U.S.-born residents:
This state: 23,949
Northeast: 2,314
Midwest: 966
South: 1,314
West: 935
66% of the 12309 zip code residents lived in the same house 5 years ago. Out of people who lived in different houses, 52% lived in this county. Out of people who lived in different counties, 50% lived in New York.
90% of the 12309 zip code residents lived in the same house 1 year ago. Out of people who lived in different houses, 44% moved from this county. Out of people who lived in different houses, 44% moved from different county within same state. Out of people who lived in different houses, 10% moved from different state. Out of people who lived in different houses, 1% moved from abroad.
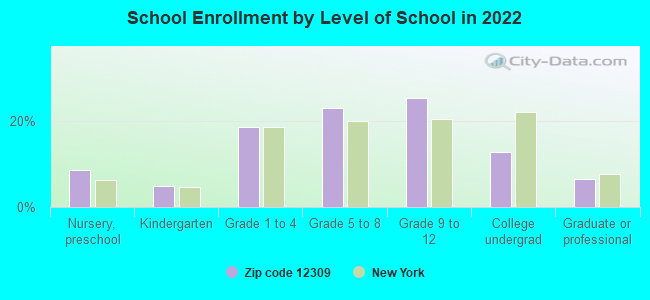
Private vs. public school enrollment:
Students in private schools in grades 1 to 8 (elementary and middle school): 126
Here:
3.8%
New York:
15.6%
Students in private schools in grades 9 to 12 (high school): 84
Here:
4.2%
New York:
15.0%
Students in private undergraduate colleges: 397
Here:
39.4%
New York:
39.2%
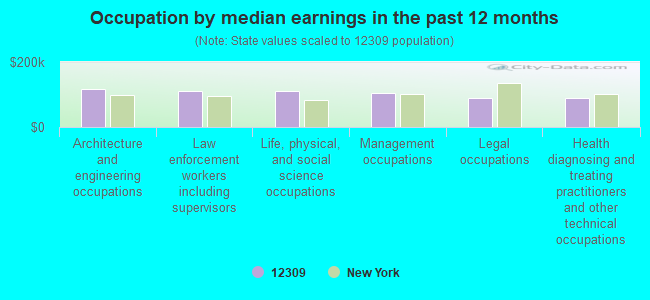
Occupation by median earnings in the past 12 months ($)
116,390Architecture and engineering occupations
111,459Law enforcement workers including supervisors
109,373Life, physical, and social science occupations
103,426Management occupations
87,443Legal occupations
87,304Health diagnosing and treating practitioners and other technical occupations
Companies with federal contracts located in this zip code:
GENERALELECTRIC COMPANY (1 RESEARCH CIR in NISKAYUNA, NY) : $29,091,169 in 111 contractsfrom 1999 to 2006
Contracts for Defense Tank - Automotive -- Basic Research (R&D), Physical Sciences -- Basic Research (R&D), Other Defense -- Applied Research and Exploratory Development (R&D), Other Defense -- Basic Research (R&D), and moreby Army, Air Force, Navy, Office of Policy, Management and Budget/Chief Financial Officer, and others Signed by year:2000: $5,769,771; 2001: $5,075,738; 2002: $5,008,600; 2003: $2,838,848; 2004: $4,125,393; 2005: $5,090,021; 2006: $75,210.
Biggest contracts:
$3,099,921 with Army for Defense Tank - Automotive -- Basic Research (R&D). Signed on 2005-07-11. Completion date: 2007-07-01.
$1,730,500 with Army for Physical Sciences -- Basic Research (R&D). Signed on 2004-07-29. Completion date: 2006-03-29.
$1,518,818 with Air Force for Other Defense -- Applied Research and Exploratory Development (R&D). Signed on 2003-08-06. Completion date: 2004-11-09.
$1,368,000 with Navy for Other Defense -- Basic Research (R&D). Signed on 2002-12-13. Completion date: 2004-08-22.
UTILITY SYSTEMS TECHNOLOGIES, (2315 CAYUGA RD in NISKAYUNA, NY; small business)
$227,465 with Navy for ADP Support Equipment. Signed on 2005-09-21. Completion date: 2005-09-28.
HI-TEK INDUSTRIES INC (1737 UNION ST SUITE 802L in NISKAYUNA, NY; small business) : $76,995 in 4 contractsfrom 2004 to 2006
$30,014 with Defense Logistics Agency for Miscellaneous Items. Signed on 2005-03-26. Completion date: 2005-08-23.
$29,924 with Defense Logistics Agency for Connectors, Electrical. Signed on 2004-11-22. Completion date: 2005-02-28.
$13,767 with Defense Logistics Agency for Electrical Insulators and Insulating Materials. Signed on 2006-05-16. Completion date: 2006-07-15.
$3,290 with Defense Logistics Agency for Connectors, Electrical. Signed on 2005-03-11. Completion date: 2005-07-12.
CUSTOM MANUFACTURING SOLUTIONS (1052 CORNELIUS AVE in SCHENECTADY, NY)
$39,871 with Defense Logistics Agency for Nails, Machine Keys, and Pins. Signed on 2000-04-14. Completion date: 2000-08-01.
T & P LAWN AND LANDSCAPE INC (779 HAMPSHIRE SEAT in NISKAYUNA, NY; small business) : $22,150 in 2 contractsfrom 2004 to 2005
$11,350 with Army for Landscaping/Groundskeeping Services. Signed on 2005-05-03. Completion date: 2005-09-30.
$10,800, same as above.Signed on 2004-04-21. Completion date: 2004-09-30.
MICHAEL'S SHOE SERVICE (1605 UNION ST in SCHENECTADY, NY; small business)
$10,211 with Army for Outerwear, Men's. Signed on 2004-07-27. Completion date: 2004-09-10.
ABDOUN CONSULTANT (843 BEECH DRIVE in NISKAYUNA, NY; small business)
$10,000 with Army for Other Research and Development -- Basic Research (R&D). Signed on 2004-04-07. Completion date: 2004-06-30.
W J ASSOCIATES,LLC (2041 HOOVER RD in NISKAYUNA, NY; small business) : $5,752 in 2 contractsin 2004
$2,922 with Army for Construction of Structures and Facilities -- Other Administrative Facilities and Service Buildings. Signed on 2004-11-19. Completion date: 2004-12-18.
$2,830, same as above.Signed on 2004-01-13. Completion date: 2004-01-23.
Top industries in this zip code by the number of employees in 2005:
Professional, Scientific, and Technical Services: Research and Development in the Physical, Engineering, and Life Sciences (over 1000 employees: 2 establishments, 1-4 employees: 1 establishment)
Health Care and Social Assistance: Offices of Physicians (except Mental Health Specialists) (100-249: 1, 20-49: 3, 10-19: 8, 5-9: 8, 1-4: 11)
Health Care and Social Assistance: Nursing Care Facilities (250-499: 1, 5-9: 1)
Health Care and Social Assistance: Specialty (except Psychiatric and Substance Abuse) Hospitals (250-499: 1)
Health Care and Social Assistance: Child Day Care Services (100-249: 1, 20-49: 1, 10-19: 1, 5-9: 2, 1-4: 3)
Health Care and Social Assistance: Homes for the Elderly (50-99: 2, 20-49: 2)
2002 - 2018 National Fire Incident Reporting System (NFIRS) incidents
According to the data from the years 2002 - 2018 the average number of fires per year is 80. The highest number of fires - 107 took place in 2008, and the least - 48 in 2011. The data has a rising trend.
When looking into fire subcategories, the most incidents belonged to: Structure Fires (59.0%), and Outside Fires (23.9%).
Fire incident types reported to NFIRS in Zip Code 12309


 Nearest zip codes: 12148, 12304, 12308, 12008, 12307, 12303.


 According to the data from the years 2002 - 2018 the average number of fires per year is 80. The highest number of fires - 107 took place in 2008, and the least - 48 in 2011. The data has a rising trend.
 When looking into fire subcategories, the most incidents belonged to: Structure Fires (59.0%), and Outside Fires (23.9%).