Estimated zip code population in 2022: 29,209 Zip code population in 2010: 29,857 Zip code population in 2000: 27,942
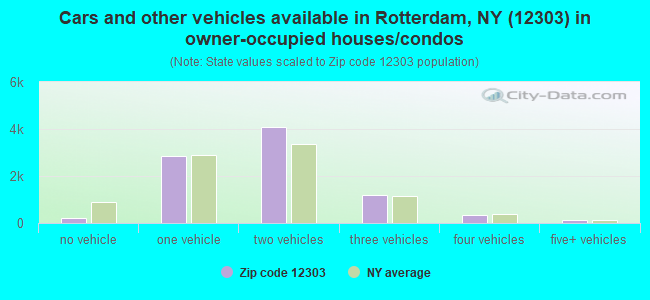
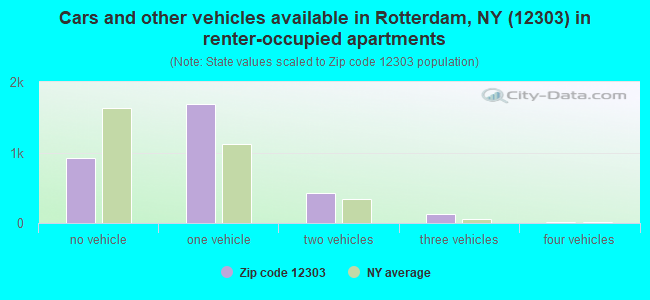
Houses and condos: 13,025 Renter-occupied apartments: 3,168
% of renters here:
26%
State:
46%
March 2022 cost of living index in zip code 12303: 105.3 (more than average, U.S. average is 100)
Land area: 15.4 sq. mi. Water area: 0.0 sq. mi.
Population density: 1,899 people per square mile
(low).
OSM Map
General Map
Google Map
MSN Map
OSM Map
General Map
Google Map
MSN Map
OSM Map
General Map
Google Map
MSN Map
OSM Map
General Map
Google Map
MSN Map
Please wait while loading the map...
Real estate property taxes paid for housing units in 2022:
This zip code:
2.1% ($4,692)
New York:
1.5% ($6,180)
Median real estate property taxes paid for housing units with mortgages in 2022: $5,005 (2.2%) Median real estate property taxes paid for housing units with no mortgage in 2022: $4,140 (1.8%)
Averages for the 2020 tax year for zip code 12303, filed in 2021:
Average Adjusted Gross Income (AGI) in 2020: $67,956 (Individual Income Tax Returns)
Here:
$67,956
State:
$90,930
Salary/wage: $58,503 (reported on 81.0% of returns)
Here:
$58,503
State:
$72,104
(% of AGI for various income ranges: 1160.9% for AGIs below $25k, 3494.7% for AGIs $25k-50k, 6159.9% for AGIs $50k-75k, 8827.6% for AGIs $75k-100k, 17174.6% for AGIs $100k-200k, 72662.5% for AGIs over 200k)
Taxable interest for individuals: $882 (reported on 37.4% of returns)
This zip code:
$882
New York:
$3,075
(% of AGI for various income ranges: 13.9% for AGIs below $25k, 17.3% for AGIs $25k-50k, 34.9% for AGIs $50k-75k, 59.3% for AGIs $75k-100k, 101.9% for AGIs $100k-200k, 727.0% for AGIs over 200k)
Ordinary dividends: $4,043 (reported on 21.6% of returns)
Here:
$4,043
State:
$11,095
(% of AGI for various income ranges: 22.7% for AGIs below $25k, 30.2% for AGIs $25k-50k, 69.9% for AGIs $50k-75k, 126.2% for AGIs $75k-100k, 284.3% for AGIs $100k-200k, 2644.0% for AGIs over 200k)
Net capital gain/loss in AGI: +$11,797 (reported on 17.4% of returns)
Here:
+$11,797
State:
+$44,925
(% of AGI for various income ranges: 8.2% for AGIs below $25k, 19.2% for AGIs $25k-50k, 72.5% for AGIs $50k-75k, 137.1% for AGIs $75k-100k, 361.4% for AGIs $100k-200k, 11540.5% for AGIs over 200k)
Profit/loss from business: +$14,331 (reported on 11.2% of returns)
Here:
+$14,331
State:
+$14,940
(% of AGI for various income ranges: 79.6% for AGIs below $25k, 71.4% for AGIs $25k-50k, 117.5% for AGIs $50k-75k, 183.4% for AGIs $75k-100k, 443.4% for AGIs $100k-200k, 4908.0% for AGIs over 200k)
Taxable individual retirement arrangement distribution: $15,566 (reported on 8.8% of returns)
12303:
$15,566
New York:
$19,609
(% of AGI for various income ranges: 46.2% for AGIs below $25k, 71.8% for AGIs $25k-50k, 169.4% for AGIs $50k-75k, 331.4% for AGIs $75k-100k, 526.1% for AGIs $100k-200k, 1795.0% for AGIs over 200k)
Self-employed (Keogh) retirement plans: $23,100 (reported on 0.6% of returns)
12303:
$23,100
New York:
$32,497
(% of AGI for various income ranges: 37.5% for AGIs $100k-200k, 777.0% for AGIs over 200k)
Total itemized deductions: $26,083 (reported on 6.5% of returns)
Here:
$26,083
State:
$39,326
(% of AGI for various income ranges: 34.2% for AGIs below $25k, 93.4% for AGIs $25k-50k, 253.6% for AGIs $50k-75k, 403.6% for AGIs $75k-100k, 506.0% for AGIs $100k-200k, 3126.0% for AGIs over 200k)
Charity contributions: $6,958 (reported on 4.8% of returns)
Here:
$6,958
State:
$15,420
(% of AGI for various income ranges: 1.0% for AGIs below $25k, 5.4% for AGIs $25k-50k, 27.0% for AGIs $50k-75k, 50.2% for AGIs $75k-100k, 116.9% for AGIs $100k-200k, 1151.5% for AGIs over 200k)
Taxes paid: $8,869 (reported on 6.5% of returns)
12303:
$8,869
State:
$9,183
(% of AGI for various income ranges: 6.3% for AGIs below $25k, 26.8% for AGIs $25k-50k, 102.7% for AGIs $50k-75k, 174.6% for AGIs $75k-100k, 185.3% for AGIs $100k-200k, 788.5% for AGIs over 200k)
Earned income credit: $2,293 (reported on 14.7% of returns)
Here:
$2,293
State:
$2,138
(% of AGI for various income ranges: 96.7% for AGIs below $25k, 68.0% for AGIs $25k-50k, 0.9% for AGIs $50k-75k)
Percentage of individuals using paid preparers for their 2020 taxes: 95.2%
Here:
95%
State:
95%
(% for various income ranges: 94.7% for AGIs below $25k, 95.2% for AGIs $25k-50k, 95.8% for AGIs $50k-75k, 94.9% for AGIs $75k-100k, 95.4% for AGIs $100k-200k, 97.0% for AGIs over 200k)
Averages for the 2012 tax year for zip code 12303, filed in 2013:
Average Adjusted Gross Income (AGI) in 2012: $57,976 (Individual Income Tax Returns)
Here:
$57,976
State:
$77,088
Salary/wage: $50,029 (reported on 82.7% of returns)
Here:
$50,029
State:
$60,593
(% of AGI for various income ranges: 72.1% for AGIs below $25k, 77.5% for AGIs $25k-50k, 72.3% for AGIs $50k-75k, 73.3% for AGIs $75k-100k, 77.6% for AGIs $100k-200k, 55.2% for AGIs over 200k)
Taxable interest for individuals: $785 (reported on 44.3% of returns)
This zip code:
$785
New York:
$3,125
(% of AGI for various income ranges: 1.0% for AGIs below $25k, 0.7% for AGIs $25k-50k, 0.8% for AGIs $50k-75k, 0.5% for AGIs $75k-100k, 0.5% for AGIs $100k-200k, 0.4% for AGIs over 200k)
Ordinary dividends: $3,745 (reported on 26.5% of returns)
Here:
$3,745
State:
$10,299
(% of AGI for various income ranges: 2.1% for AGIs below $25k, 1.2% for AGIs $25k-50k, 1.5% for AGIs $50k-75k, 1.5% for AGIs $75k-100k, 1.3% for AGIs $100k-200k, 2.9% for AGIs over 200k)
Net capital gain/loss in AGI: +$5,612 (reported on 16.1% of returns)
Here:
+$5,612
State:
+$42,474
(% of AGI for various income ranges: 0.2% for AGIs $50k-75k, 0.2% for AGIs $75k-100k, 0.8% for AGIs $100k-200k, 6.5% for AGIs over 200k)
Profit/loss from business: +$16,290 (reported on 11.7% of returns)
Here:
+$16,290
State:
+$16,168
(% of AGI for various income ranges: 5.9% for AGIs below $25k, 2.2% for AGIs $25k-50k, 1.6% for AGIs $50k-75k, 1.6% for AGIs $75k-100k, 2.5% for AGIs $100k-200k, 6.9% for AGIs over 200k)
Taxable individual retirement arrangement distribution: $10,969 (reported on 10.1% of returns)
12303:
$10,969
New York:
$17,621
(% of AGI for various income ranges: 2.4% for AGIs below $25k, 2.1% for AGIs $25k-50k, 2.3% for AGIs $50k-75k, 2.3% for AGIs $75k-100k, 1.7% for AGIs $100k-200k, 1.3% for AGIs over 200k)
Self-employment retirement plans: $21,377 (reported on 0.9% of returns)
12303:
$21,377
New York:
$27,330
(% of AGI for various income ranges: 0.2% for AGIs $50k-75k, 0.3% for AGIs $100k-200k, 1.1% for AGIs over 200k)
Total itemized deductions: $21,641 (20% of AGI, reported on 35.9% of returns)
Here:
$21,641
State:
$34,985
Here:
20.1% of AGI
State:
21.3% of AGI
(% of AGI for various income ranges: 8.7% for AGIs below $25k, 10.3% for AGIs $25k-50k, 13.2% for AGIs $50k-75k, 14.7% for AGIs $75k-100k, 16.2% for AGIs $100k-200k, 12.7% for AGIs over 200k)
Charity contributions: $2,496 (reported on 29.0% of returns)
Here:
$2,496
State:
$5,572
(% of AGI for various income ranges: 0.5% for AGIs below $25k, 0.7% for AGIs $25k-50k, 1.1% for AGIs $50k-75k, 1.4% for AGIs $75k-100k, 1.6% for AGIs $100k-200k, 1.5% for AGIs over 200k)
Taxes paid: $11,164 (reported on 35.7% of returns)
12303:
$11,164
State:
$18,656
(% of AGI for various income ranges: 2.4% for AGIs below $25k, 3.9% for AGIs $25k-50k, 5.8% for AGIs $50k-75k, 7.1% for AGIs $75k-100k, 9.0% for AGIs $100k-200k, 8.6% for AGIs over 200k)
Earned income credit: $2,280 (reported on 16.7% of returns)
Here:
$2,280
State:
$2,230
(% of AGI for various income ranges: 6.7% for AGIs below $25k, 0.9% for AGIs $25k-50k)
Percentage of individuals using paid preparers for their 2012 taxes: 53.5%
Here:
54%
State:
66%
(% for various income ranges: 51.0% for AGIs below $25k, 52.5% for AGIs $25k-50k, 54.1% for AGIs $50k-75k, 57.9% for AGIs $75k-100k, 56.2% for AGIs $100k-200k, 66.7% for AGIs over 200k)
Averages for the 2004 tax year for zip code 12303, filed in 2005:
Average Adjusted Gross Income (AGI) in 2004: $47,548 (Individual Income Tax Returns)
Here:
$47,548
State:
$59,519
Salary/wage: $43,198 (reported on 83.1% of returns)
Here:
$43,198
State:
$50,673
(% of AGI for various income ranges: 87.6% for AGIs below $10k, 70.9% for AGIs $10k-25k, 78.7% for AGIs $25k-50k, 76.6% for AGIs $50k-75k, 81.0% for AGIs $75k-100k, 71.3% for AGIs over 100k)
Taxable interest for individuals: $1,123 (reported on 59.9% of returns)
This zip code:
$1,123
New York:
$2,377
(% of AGI for various income ranges: 4.7% for AGIs below $10k, 2.7% for AGIs $10k-25k, 1.6% for AGIs $25k-50k, 1.7% for AGIs $50k-75k, 0.9% for AGIs $75k-100k, 0.9% for AGIs over 100k)
Taxable dividends: $2,715 (reported on 33.0% of returns)
Here:
$2,715
State:
$5,394
(% of AGI for various income ranges: 4.0% for AGIs below $10k, 3.0% for AGIs $10k-25k, 1.7% for AGIs $25k-50k, 1.9% for AGIs $50k-75k, 1.3% for AGIs $75k-100k, 1.9% for AGIs over 100k)
Net capital gain/loss: +$6,722 (reported on 22.7% of returns)
Here:
+$6,722
State:
+$23,581
(% of AGI for various income ranges: -1.5% for AGIs below $10k, 0.2% for AGIs $10k-25k, 0.6% for AGIs $25k-50k, 0.8% for AGIs $50k-75k, 1.3% for AGIs $75k-100k, 7.5% for AGIs over 100k)
Profit/loss from business: +$13,635 (reported on 11.2% of returns)
Here:
+$13,635
State:
+$13,809
(% of AGI for various income ranges: 2.3% for AGIs below $10k, 3.5% for AGIs $10k-25k, 1.8% for AGIs $25k-50k, 1.9% for AGIs $50k-75k, 1.8% for AGIs $75k-100k, 5.2% for AGIs over 100k)
IRA payment deduction: $2,822 (reported on 2.2% of returns)
12303:
$2,822
New York:
$3,115
(% of AGI for various income ranges: 0.2% for AGIs $10k-25k, 0.2% for AGIs $25k-50k, 0.2% for AGIs $50k-75k, 0.1% for AGIs $75k-100k, 0.1% for AGIs over 100k)
Self-employed pension: $14,321 (reported on 1.2% of returns)
Here:
$14,321
New York:
$19,016
(% of AGI for various income ranges: 0.0% for AGIs $25k-50k, 0.1% for AGIs $50k-75k, 0.1% for AGIs $75k-100k, 0.8% for AGIs over 100k)
Total itemized deductions: $17,179 (20% of AGI, reported on 36.2% of returns)
Here:
$17,179
State:
$25,864
Here:
19.7% of AGI
State:
21.9% of AGI
(% of AGI for various income ranges: 6.4% for AGIs below $10k, 6.8% for AGIs $10k-25k, 10.5% for AGIs $25k-50k, 13.1% for AGIs $50k-75k, 15.6% for AGIs $75k-100k, 14.9% for AGIs over 100k)
Charity contributions deductions: $2,081 (2% of AGI, reported on 33.0% of returns)
Here:
$2,081
State:
$4,439
Here:
2.3% of AGI
State:
3.6% of AGI
(% of AGI for various income ranges: 0.2% for AGIs below $10k, 0.6% for AGIs $10k-25k, 1.0% for AGIs $25k-50k, 1.4% for AGIs $50k-75k, 1.8% for AGIs $75k-100k, 1.7% for AGIs over 100k)
Total tax: $7,074 (reported on 77.3% of returns)
12303:
$7,074
State:
$11,730
(% of AGI for various income ranges: 2.2% for AGIs below $10k, 3.9% for AGIs $10k-25k, 7.4% for AGIs $25k-50k, 9.2% for AGIs $50k-75k, 10.2% for AGIs $75k-100k, 17.4% for AGIs over 100k)
Earned income credit: $1,772 (reported on 13.4% of returns)
Here:
$1,772
State:
$1,757
Percentage of individuals using paid preparers for their 2004 taxes: 59.0%
Here:
59%
State:
67%
(% for various income ranges: 53.1% for AGIs below $10k, 63.1% for AGIs $10k-25k, 59.8% for AGIs $25k-50k, 59.6% for AGIs $50k-75k, 57.9% for AGIs $75k-100k, 59.2% for AGIs over 100k)
Likely homosexual households (counted as self-reported same-sex unmarried-partner households)
Lesbian couples: 0.0% of all households
Gay men: 0.1% of all households
Household received Food Stamps/SNAP in the past 12 months: 1,924 Household did not receive Food Stamps/SNAP in the past 12 months: 10,074
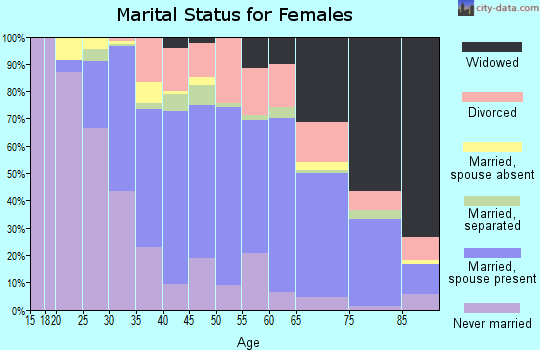
Women who had a birth in the past 12 months: 535 (340 now married, 196 unmarried) Women who did not have a birth in the past 12 months: 6,035 (2,390 now married, 3,635 unmarried)
Housing units in zip code 12303 with a mortgage: 5,714 (574 second mortgage, 505 both second mortgage and home equity loan) Houses without a mortgage: 418
Median monthly owner costs for units with a mortgage: $1,642 Median monthly owner costs for units without a mortgage: $624
Residents with income below the poverty level in 2022:
This zip code:
13.2%
Whole state:
14.3%
Residents with income below 50% of the poverty level in 2022:
This zip code:
6.0%
Whole state:
6.8%
Median number of rooms in houses and condos:
Here:
6.6
State:
6.3
Median number of rooms in apartments:
Here:
4.7
State:
3.8
Notable locations in this zip code not listed on our city pages
Notable locations in zip code 12303: Niagara-Mohawk Power Corporation Chrisler Avenue Sub-Station (A), Stadium Golf Club (B), Gade Farm (C), Carman Fire Department (D), Mount Pleasant Branch Schenectady County Public Library (E), Schenectady Fire Department Station 3 (F), Pigliavento's Greenhouses (G), Stanford Heights Fire District (H), Fort Hunter Fire Company (I). Display/hide their locations on the map
Churches in zip code 12303 include: Saint Madelene Sophe Church (A), Our Saviour's Lutheran Church (B), Carman United Methodist Church (C), Holy Name of Jesus Roman Catholic Church (D), Our Lady of Mount Carmel Roman Catholic Church (E), Grace Methodist Church (F), Mount Pleasant Reformed Church (G), Saint Thomas The Apostle Roman Catholic Church (H), Precious Foundation Holiness Church (I). Display/hide their locations on the map
3,117 married couples with children.
2,561 single-parent households (693 men, 1,868 women).
90.9% of residents of 12303 zip code speak English at home.
5.2% of residents speak Spanish at home (64% very well, 18% well, 14% not well, 4% not at all).
2.2% of residents speak other Indo-European language at home (73% very well, 22% well, 6% not well).
1.4% of residents speak Asian or Pacific Island language at home (80% very well, 10% well, 10% not well).
0.1% of residents speak other language at home (100% very well).
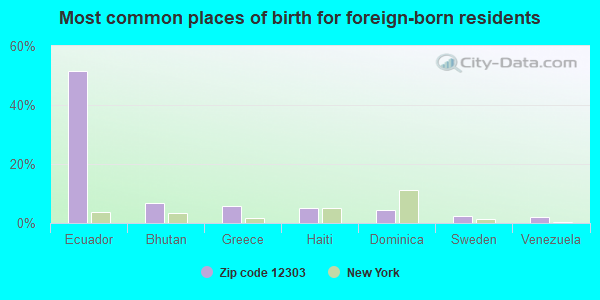
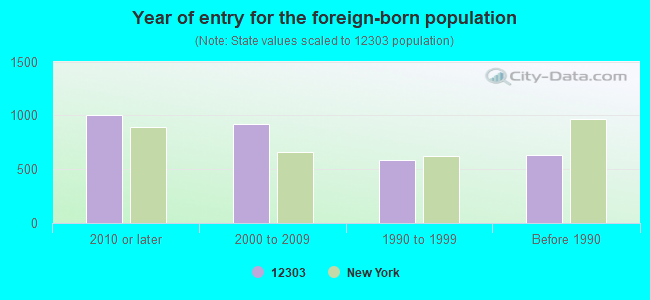
Foreign born population: 2,462 (8.4%) (69.2% of them are naturalized citizens)
Major facilities with environmental interests located in this zip code:
GETTY/HAMBURG ST STATION (2976 HAMBURG ST in SCHENECTADY, NY)
STATE MASTER (New York facility tracking) - AIR PROGRAM, (Resource Conservation and Recovery Act (tracking hazardous waste)) Business SIC classification: MEASURING AND DISPENSING PUMPS Business NAICS classification: MEASURING AND DISPENSING PUMP MANUFACTURING. Organizations: GETTY PETROLEUM MARKETING INC (LEGALLY RESPONSIBLE PARTY)
Alternative names: GETTY PETROLEUM CORP
CLASSIC CLEANERS (2705 HAMBURG STREET in SCHENECTADY, NY)
STATE MASTER (New York facility tracking) - AIR PROGRAM, HAZARDOUS WASTE PROGRAM Small Quantity Generators, between 100 kg and 1000 kg of hazardous waste/month (Resource Conservation and Recovery Act (tracking hazardous waste)) Business SIC classification: DRYCLEANING PLANTS, EXCEPT RUG CLEANING Business NAICS classification: DRYCLEANING AND LAUNDRY SERVICES (EXCEPT COIN-OPERATED). Alternative names: HENRYS DRY CLEANING EMPORIUM
HAMILTON ES ( in SCHENECTADY, NY)
(National Center for Education Statistics) - STATE ID-530600010009 Organizations: SCHENECTADY CITY SD (SCHOOL DISTRICT)
HERMAN L. BRADT ES ( in SCHENECTADY, NY)
(National Center for Education Statistics) - STATE ID-530515060001 Organizations: ROTTERDAM-MOHONASEN CSD (SCHOOL DISTRICT)
COLONIAL GREEN SUBDIVISION (943 BURDECK AVE in SCHENECTADY, NY)
(Integrated Compliance Information System) - ICIS-02-2000-8377, FORMAL ENFORCEMENT ACTION Business SIC classification: WATER SUPPLY
HERTZ PENSKE TRUCK LEASING INC (MARIAVILLE RD in SCHENECTADY, NY)
(Resource Conservation and Recovery Act (tracking hazardous waste)) Organizations: EDGCOMB STEEL OF N E (CONTACT/OWNER)
HIGHBRIDGE MOBIL (1098 HIGHBRIDGE RD in SCHENECTADY, NY)
(Resource Conservation and Recovery Act (tracking hazardous waste)) Organizations: RED KAP SALES (CONTACT/OPERATOR)
CUMBERLAND FARMS #3108 (CHRISLER AVE in SCHENECTADY, NY)
(Resource Conservation and Recovery Act (tracking hazardous waste))
CUMBERLAND FARMS #3131 (2740 HAMBURG ST in SCHENECTADY, NY)
(Resource Conservation and Recovery Act (tracking hazardous waste))
ALBANY SCHOOL SCHENECTADY BOCES (FOREST RD in SCHENECTADY, NY)
(Resource Conservation and Recovery Act (tracking hazardous waste))
GUILDERLAND CENTRAL SCHOOL DIST (8 REGINA DR in SCHENECTADY, NY)
(Resource Conservation and Recovery Act (tracking hazardous waste))
HALLMARK NURSING CENTRE (526 ALTAMONT AVE in SCHENECTADY, NY)
(Resource Conservation and Recovery Act (tracking hazardous waste))
CHRISLER SUBSTATION (BROWER ST in SCHENECTADY, NY)
(Resource Conservation and Recovery Act (tracking hazardous waste))
Housing units lacking complete plumbing facilities: 0.2% Housing units lacking complete kitchen facilities: 0.8%
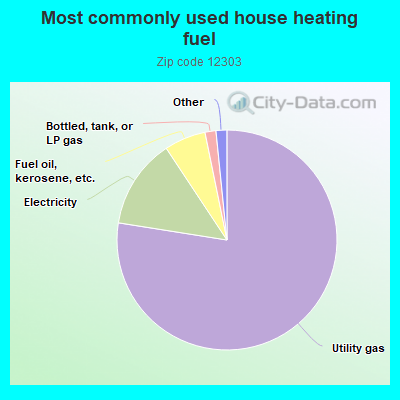
77.5%Utility gas
13.2%Electricity
6.1%Fuel oil, kerosene, etc.
1.6%Bottled, tank, or LP gas
0.8%No fuel used
0.6%Wood
Population in 1990: 28,448.
Place of birth for U.S.-born residents:
This state: 23,339
Northeast: 1,037
Midwest: 576
South: 697
West: 379
64% of the 12303 zip code residents lived in the same house 5 years ago. Out of people who lived in different houses, 64% lived in this county. Out of people who lived in different counties, 50% lived in New York.
91% of the 12303 zip code residents lived in the same house 1 year ago. Out of people who lived in different houses, 50% moved from this county. Out of people who lived in different houses, 45% moved from different county within same state. Out of people who lived in different houses, 3% moved from different state. Out of people who lived in different houses, 1% moved from abroad.
Private vs. public school enrollment:
Students in private schools in grades 1 to 8 (elementary and middle school): 386
Here:
11.9%
New York:
15.6%
Students in private schools in grades 9 to 12 (high school): 199
Here:
11.9%
New York:
15.0%
Students in private undergraduate colleges: 256
Here:
21.7%
New York:
39.2%
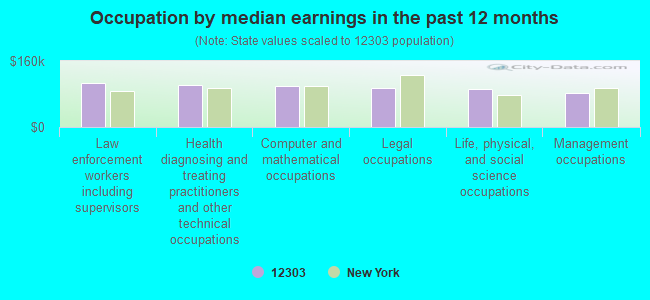
Occupation by median earnings in the past 12 months ($)
106,156Law enforcement workers including supervisors
102,107Health diagnosing and treating practitioners and other technical occupations
98,913Computer and mathematical occupations
95,661Legal occupations
92,138Life, physical, and social science occupations
82,635Management occupations
Companies with federal contracts located in this zip code (SCHENECTADY, NY):
MILLIVAC INSTRUMENTS INC (2818 CURRY RD; small business) : $1,414,081 in 43 contractsfrom 2000 to 2006
Contracts for Electrical and Electronic Properties Measuring and Testing Instruments, Antennas, Waveguides, and Related Equipment by Army, Air Force, Navy, Defense Logistics Agency, and others Signed by year:2000: $248,054; 2001: $87,484; 2002: $0; 2003: $121,349; 2004: $341,988; 2005: $563,768; 2006: $51,438.
Biggest contracts:
$123,069 with Army for Electrical and Electronic Properties Measuring and Testing Instruments. Signed on 2005-01-26. Completion date: 2008-02-28.
$101,970 with Air Force for Electrical and Electronic Properties Measuring and Testing Instruments. Signed on 2005-03-24. Completion date: 2005-11-30.
$97,464, same as above.Signed on 2000-01-31. Completion date: 2000-07-31.
$90,750 with Navy for Electrical and Electronic Properties Measuring and Testing Instruments. Signed on 2005-08-05. Completion date: 2005-11-05.
PREMIERE CLEANING CONCEPTS INC (672 CONSALUS AVE; small business) : $249,472 in 6 contractsfrom 1999 to 2003
Contracts for Other Housekeeping Services, Carpet Laying and Cleaning by Air Force Signed by year:2000: $95,664; 2001: $49,730; 2002: $51,628; 2003: $25,474; 2004: $0; 2005: $0; 2006: $0.
Biggest contracts:
$51,628 with Air Force for Other Housekeeping Services. Signed on 2002-11-07. Completion date: 2003-09-30.
$49,730, same as above.Signed on 2001-11-01. Completion date: 2002-09-30.
$47,832, same as above.Signed on 2000-11-08. Completion date: 2001-09-30.
$47,832, same as above.Signed on 2000-10-30. Completion date: 2001-09-30.
UPSTATE EQUIPMENT COMPANY, INC (1417 CRANE STREET; small business) : $141,135 in 6 contractsfrom 2003 to 2004
Contracts for Installation of Equipment -- Materials Handling Equipment, Installation of Equipment -- Water Purification and Sewage Treatment Equipment, Miscellaneous Prefabricated Structures, Cabinets, Lockers, Bins, and Shelving, and moreby Army Signed by year:2000: $0; 2001: $0; 2002: $0; 2003: $37,000; 2004: $104,135; 2005: $0; 2006: $0.
Biggest contracts:
$82,500 with Army for Installation of Equipment -- Materials Handling Equipment. Signed on 2004-03-09. Completion date: 2004-06-23.
$37,000 with Army for Installation of Equipment -- Water Purification and Sewage Treatment Equipment. Signed on 2003-10-08. Completion date: 2003-12-08.
$11,720 with Army for Miscellaneous Prefabricated Structures. Signed on 2004-09-27. Completion date: 2004-11-30.
$5,190 with Army for Cabinets, Lockers, Bins, and Shelving. Signed on 2004-02-04. Completion date: 2004-03-03.
NORTHEAST PETROLEUM TECHNOLOGI (2940 CURRY ROAD; small business) : $53,384 in 6 contractsfrom 2005 to 2006
Contracts for Maintenance, Repair and Rebuilding of Equipment -- Electrical and Electronic Equipment Components, Maintenance, Repair and Rebuilding of Equipment -- Special Industry Machinery, Pesticides Support Services by Army Signed by year:2000: $0; 2001: $0; 2002: $0; 2003: $0; 2004: $0; 2005: $10,000; 2006: $43,384.
Biggest contracts:
$31,950 with Army for Maintenance, Repair and Rebuilding of Equipment -- Electrical and Electronic Equipment Components. Signed on 2006-03-15. Completion date: 2007-05-31.
$11,378 with Army for Maintenance, Repair and Rebuilding of Equipment -- Special Industry Machinery. Signed on 2006-02-10. Completion date: 2006-03-02.
$10,000 with Army for Pesticides Support Services. Signed on 2006-01-24. Completion date: 2006-04-30.
$10,000, same as above.Signed on 2005-04-21. Completion date: 2006-04-30.
MEND ELECTRIC (426 ELIZABETH COURT; small business)
$24,950 with Army for Installation of Equipment -- Lighting Fixtures and Lamps. Signed on 2004-03-22. Completion date: 2004-04-21.
FUSION ANALYTICAL SOFTWARE (1030 HOLLAND ROAD; small business) : $18,700 in 3 contractsfrom 2002 to 2005
$13,200 with Army for Maintenance, Repair and Rebuilding of Equipment -- Medical, Dental, and Veterinary Equipment and Supplies. Signed on 2002-11-14. Completion date: 2002-12-01.
$2,750 with Army for ADP Systems Analysis Services. Signed on 2005-04-28. Completion date: 2006-04-24.
$2,750 with Army for Maintenance, Repair and Rebuilding of Equipment -- Instruments and Laboratory Equipment. Signed on 2004-03-04. Completion date: 2004-03-12.
MUELLER, JUSTIN (5376 HICKORY DR; small business) : $11,492 in 2 contractsfrom 2004 to 2005
$6,500 with Army for Scientific Data Studies. Signed on 2005-01-12. Completion date: 2005-12-31.
$4,992 with Army for Technical Assistance. Signed on 2004-03-08. Completion date: 2004-12-31.
JILL SCHOONMAKER & MICHAEL SCH (11 OKARA DRIVE; small business)
$9,943 with Air Force for Clothing, Special Purpose. Taking place in WY. Signed on 2006-06-08. Completion date: 2006-07-13.
NORTHEASTERN SURFACE SYSTEMS, (1861 CHRISLER AVENUE; small business)
$2,450 with Army for Construction of Structures and Facilities -- Other Airfield Structures. Signed on 2004-12-13. Completion date: 2004-12-27.
Top industries in this zip code by the number of employees in 2005:
2002 - 2018 National Fire Incident Reporting System (NFIRS) incidents
According to the data from the years 2002 - 2018 the average number of fires per year is 91. The highest number of fires - 148 took place in 2006, and the least - 17 in 2010. The data has a rising trend.
When looking into fire subcategories, the most incidents belonged to: Structure Fires (49.8%), and Outside Fires (27.8%).
Fire incident types reported to NFIRS in Zip Code 12303


 Nearest zip codes: 12304, 12307, 12084, 12085, 12305, 12308.


 According to the data from the years 2002 - 2018 the average number of fires per year is 91. The highest number of fires - 148 took place in 2006, and the least - 17 in 2010. The data has a rising trend.
 When looking into fire subcategories, the most incidents belonged to: Structure Fires (49.8%), and Outside Fires (27.8%).