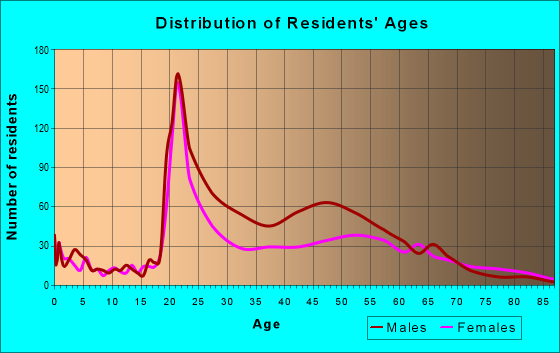
Estimated zip code population in 2022: 6,812 Zip code population in 2010: 5,716 Zip code population in 2000: 5,922
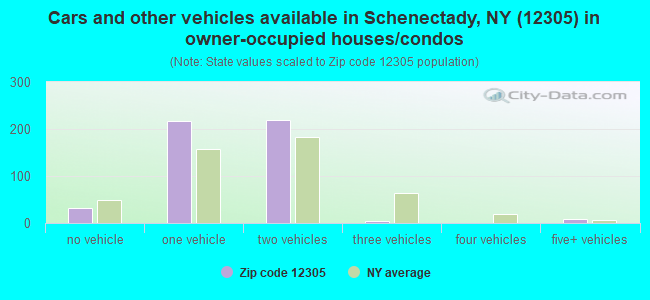
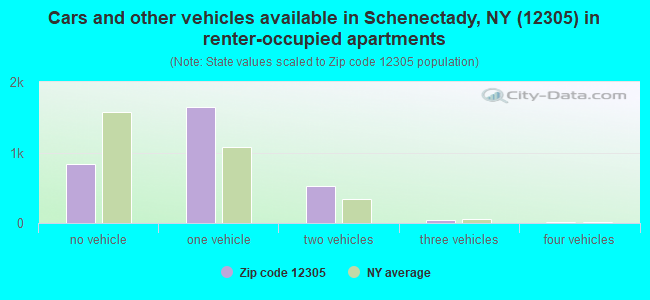
Houses and condos: 3,921 Renter-occupied apartments: 3,058
% of renters here:
87%
State:
46%
March 2022 cost of living index in zip code 12305: 104.9 (near average, U.S. average is 100)
Land area: 1.5 sq. mi. Water area: 0.1 sq. mi.
Population density: 4,497 people per square mile
(average).
OSM Map
General Map
Google Map
MSN Map
OSM Map
General Map
Google Map
MSN Map
OSM Map
General Map
Google Map
MSN Map
OSM Map
General Map
Google Map
MSN Map
Please wait while loading the map...
Real estate property taxes paid for housing units in 2022:
This zip code:
3.0% ($4,418)
New York:
1.5% ($6,180)
Median real estate property taxes paid for housing units with mortgages in 2022: $4,684 (3.0%) Median real estate property taxes paid for housing units with no mortgage in 2022: $3,439 (3.8%)
Averages for the 2020 tax year for zip code 12305, filed in 2021:
Average Adjusted Gross Income (AGI) in 2020: $48,183 (Individual Income Tax Returns)
Here:
$48,183
State:
$90,930
Salary/wage: $42,228 (reported on 87.7% of returns)
Here:
$42,228
State:
$72,104
(% of AGI for various income ranges: 1227.3% for AGIs below $25k, 3792.8% for AGIs $25k-50k, 7267.3% for AGIs $50k-75k, 10476.7% for AGIs $75k-100k, 15493.3% for AGIs $100k-200k)
Taxable interest for individuals: $581 (reported on 17.3% of returns)
This zip code:
$581
New York:
$3,075
(% of AGI for various income ranges: 7.7% for AGIs below $25k, 4.6% for AGIs $25k-50k, 14.2% for AGIs $50k-75k, 25.8% for AGIs $75k-100k, 56.7% for AGIs $100k-200k)
Ordinary dividends: $4,382 (reported on 14.0% of returns)
Here:
$4,382
State:
$11,095
(% of AGI for various income ranges: 11.1% for AGIs below $25k, 25.9% for AGIs $25k-50k, 71.5% for AGIs $50k-75k, 197.5% for AGIs $75k-100k, 437.8% for AGIs $100k-200k)
Net capital gain/loss in AGI: +$7,307 (reported on 11.9% of returns)
Here:
+$7,307
State:
+$44,925
(% of AGI for various income ranges: 0.6% for AGIs below $25k, 17.2% for AGIs $25k-50k, 89.6% for AGIs $50k-75k, 224.2% for AGIs $75k-100k, 788.9% for AGIs $100k-200k)
Profit/loss from business: +$7,815 (reported on 11.1% of returns)
Here:
+$7,815
State:
+$14,940
(% of AGI for various income ranges: 56.7% for AGIs below $25k, 68.2% for AGIs $25k-50k, 136.9% for AGIs $50k-75k, 1030.0% for AGIs $100k-200k)
Taxable individual retirement arrangement distribution: $14,255 (reported on 4.5% of returns)
12305:
$14,255
New York:
$19,609
(% of AGI for various income ranges: 52.9% for AGIs $25k-50k, 230.0% for AGIs $50k-75k, 677.8% for AGIs $100k-200k)
Total itemized deductions: $27,212 (reported on 3.3% of returns)
Here:
$27,212
State:
$39,326
(% of AGI for various income ranges: 332.7% for AGIs $50k-75k, 1457.8% for AGIs $100k-200k)
Charity contributions: $3,280 (reported on 2.1% of returns)
Here:
$3,280
State:
$15,420
(% of AGI for various income ranges: 182.2% for AGIs $100k-200k)
Taxes paid: $8,214 (reported on 2.9% of returns)
12305:
$8,214
State:
$9,183
(% of AGI for various income ranges: 84.6% for AGIs $50k-75k, 394.4% for AGIs $100k-200k)
Earned income credit: $1,684 (reported on 17.7% of returns)
Here:
$1,684
State:
$2,138
(% of AGI for various income ranges: 80.2% for AGIs below $25k, 31.0% for AGIs $25k-50k)
Percentage of individuals using paid preparers for their 2020 taxes: 94.7%
Here:
95%
State:
95%
(% for various income ranges: 92.9% for AGIs below $25k, 95.3% for AGIs $25k-50k, 94.6% for AGIs $50k-75k, 94.4% for AGIs $75k-100k, 100.0% for AGIs $100k-200k, 100.0% for AGIs over 200k)
Averages for the 2012 tax year for zip code 12305, filed in 2013:
Average Adjusted Gross Income (AGI) in 2012: $34,414 (Individual Income Tax Returns)
Here:
$34,414
State:
$77,088
Salary/wage: $30,012 (reported on 87.6% of returns)
Here:
$30,012
State:
$60,593
(% of AGI for various income ranges: 83.9% for AGIs below $25k, 87.1% for AGIs $25k-50k, 85.4% for AGIs $50k-75k, 69.0% for AGIs $75k-100k, 49.8% for AGIs $100k-200k)
Taxable interest for individuals: $641 (reported on 20.0% of returns)
This zip code:
$641
New York:
$3,125
(% of AGI for various income ranges: 0.6% for AGIs below $25k, 0.4% for AGIs $25k-50k, 0.2% for AGIs $50k-75k, 0.3% for AGIs $75k-100k, 0.3% for AGIs $100k-200k)
Ordinary dividends: $3,926 (reported on 12.4% of returns)
Here:
$3,926
State:
$10,299
(% of AGI for various income ranges: 1.1% for AGIs below $25k, 0.8% for AGIs $25k-50k, 1.8% for AGIs $50k-75k, 2.8% for AGIs $100k-200k)
Net capital gain/loss in AGI: +$2,387 (reported on 8.1% of returns)
Here:
+$2,387
State:
+$42,474
(% of AGI for various income ranges: 0.4% for AGIs $50k-75k, 2.5% for AGIs $100k-200k)
Profit/loss from business: +$6,053 (reported on 10.3% of returns)
Here:
+$6,053
State:
+$16,168
(% of AGI for various income ranges: 4.3% for AGIs below $25k, 1.9% for AGIs $25k-50k, 0.9% for AGIs $50k-75k, 2.5% for AGIs $75k-100k)
Taxable individual retirement arrangement distribution: $12,500 (reported on 4.9% of returns)
12305:
$12,500
New York:
$17,621
(% of AGI for various income ranges: 1.2% for AGIs below $25k, 1.7% for AGIs $25k-50k, 10.3% for AGIs $75k-100k)
Total itemized deductions: $20,841 (23% of AGI, reported on 11.9% of returns)
Here:
$20,841
State:
$34,985
Here:
22.8% of AGI
State:
21.3% of AGI
(% of AGI for various income ranges: 6.2% for AGIs below $25k, 2.4% for AGIs $25k-50k, 6.3% for AGIs $50k-75k, 15.3% for AGIs $75k-100k, 12.0% for AGIs $100k-200k)
Charity contributions: $2,919 (reported on 8.6% of returns)
Here:
$2,919
State:
$5,572
(% of AGI for various income ranges: 0.3% for AGIs below $25k, 0.4% for AGIs $25k-50k, 0.6% for AGIs $50k-75k, 1.2% for AGIs $75k-100k, 1.5% for AGIs $100k-200k)
Taxes paid: $9,132 (reported on 11.9% of returns)
12305:
$9,132
State:
$18,656
(% of AGI for various income ranges: 1.5% for AGIs below $25k, 0.9% for AGIs $25k-50k, 2.8% for AGIs $50k-75k, 6.3% for AGIs $75k-100k, 6.7% for AGIs $100k-200k)
Earned income credit: $1,623 (reported on 23.2% of returns)
Here:
$1,623
State:
$2,230
(% of AGI for various income ranges: 5.1% for AGIs below $25k, 0.5% for AGIs $25k-50k)
Percentage of individuals using paid preparers for their 2012 taxes: 44.9%
Here:
45%
State:
66%
(% for various income ranges: 43.8% for AGIs below $25k, 40.0% for AGIs $25k-50k, 45.0% for AGIs $50k-75k, 71.4% for AGIs $75k-100k, 71.4% for AGIs $100k-200k)
Averages for the 2004 tax year for zip code 12305, filed in 2005:
Average Adjusted Gross Income (AGI) in 2004: $28,373 (Individual Income Tax Returns)
Here:
$28,373
State:
$59,519
Salary/wage: $25,243 (reported on 85.9% of returns)
Here:
$25,243
State:
$50,673
(% of AGI for various income ranges: 93.7% for AGIs below $10k, 85.6% for AGIs $10k-25k, 87.2% for AGIs $25k-50k, 76.6% for AGIs $50k-75k, 70.9% for AGIs $75k-100k, 43.5% for AGIs over 100k)
Taxable interest for individuals: $1,899 (reported on 31.1% of returns)
This zip code:
$1,899
New York:
$2,377
(% of AGI for various income ranges: 3.2% for AGIs below $10k, 1.1% for AGIs $10k-25k, 1.5% for AGIs $25k-50k, 1.4% for AGIs $50k-75k, 4.6% for AGIs $75k-100k, 3.3% for AGIs over 100k)
Taxable dividends: $3,938 (reported on 15.6% of returns)
Here:
$3,938
State:
$5,394
(% of AGI for various income ranges: 3.0% for AGIs below $10k, 1.6% for AGIs $10k-25k, 1.2% for AGIs $25k-50k, 2.5% for AGIs $50k-75k, 2.6% for AGIs $75k-100k, 3.9% for AGIs over 100k)
Net capital gain/loss: +$4,157 (reported on 11.0% of returns)
Here:
+$4,157
State:
+$23,581
(% of AGI for various income ranges: -0.5% for AGIs below $10k, -0.1% for AGIs $10k-25k, 0.6% for AGIs $25k-50k, 0.3% for AGIs $50k-75k, 0.3% for AGIs $75k-100k, 8.0% for AGIs over 100k)
Profit/loss from business: +$6,101 (reported on 8.5% of returns)
Here:
+$6,101
State:
+$13,809
(% of AGI for various income ranges: 7.8% for AGIs below $10k, 2.4% for AGIs $10k-25k, 0.9% for AGIs $25k-50k, 0.6% for AGIs $50k-75k, 3.7% for AGIs over 100k)
IRA payment deduction: $1,684 (reported on 1.0% of returns)
12305:
$1,684
New York:
$3,115
Total itemized deductions: $16,193 (23% of AGI, reported on 13.1% of returns)
Here:
$16,193
State:
$25,864
Here:
22.6% of AGI
State:
21.9% of AGI
(% of AGI for various income ranges: 4.8% for AGIs below $10k, 3.7% for AGIs $10k-25k, 3.9% for AGIs $25k-50k, 10.0% for AGIs $50k-75k, 14.8% for AGIs $75k-100k, 13.1% for AGIs over 100k)
Charity contributions deductions: $2,386 (3% of AGI, reported on 10.6% of returns)
Here:
$2,386
State:
$4,439
Here:
3.1% of AGI
State:
3.6% of AGI
(% of AGI for various income ranges: 0.4% for AGIs $10k-25k, 0.6% for AGIs $25k-50k, 1.0% for AGIs $50k-75k, 1.4% for AGIs $75k-100k, 2.0% for AGIs over 100k)
Total tax: $4,103 (reported on 71.2% of returns)
12305:
$4,103
State:
$11,730
(% of AGI for various income ranges: 2.0% for AGIs below $10k, 4.8% for AGIs $10k-25k, 8.7% for AGIs $25k-50k, 11.7% for AGIs $50k-75k, 13.2% for AGIs $75k-100k, 19.0% for AGIs over 100k)
Earned income credit: $1,244 (reported on 23.1% of returns)
Here:
$1,244
State:
$1,757
Percentage of individuals using paid preparers for their 2004 taxes: 59.0%
Here:
59%
State:
67%
(% for various income ranges: 61.3% for AGIs below $10k, 59.8% for AGIs $10k-25k, 56.4% for AGIs $25k-50k, 49.3% for AGIs $50k-75k, 61.4% for AGIs $75k-100k, 78.4% for AGIs over 100k)
Likely homosexual households (counted as self-reported same-sex unmarried-partner households)
Lesbian couples: 0.0% of all households
Gay men: 0.4% of all households
Household received Food Stamps/SNAP in the past 12 months: 871 Household did not receive Food Stamps/SNAP in the past 12 months: 2,685
Women who had a birth in the past 12 months: 56 (47 now married, 8 unmarried) Women who did not have a birth in the past 12 months: 1,881 (298 now married, 1,600 unmarried)
Housing units in zip code 12305 with a mortgage: 318 Median monthly owner costs for units with a mortgage: $1,599 Median monthly owner costs for units without a mortgage: $698
Residents with income below the poverty level in 2022:
This zip code:
19.4%
Whole state:
14.3%
Residents with income below 50% of the poverty level in 2022:
This zip code:
7.7%
Whole state:
6.8%
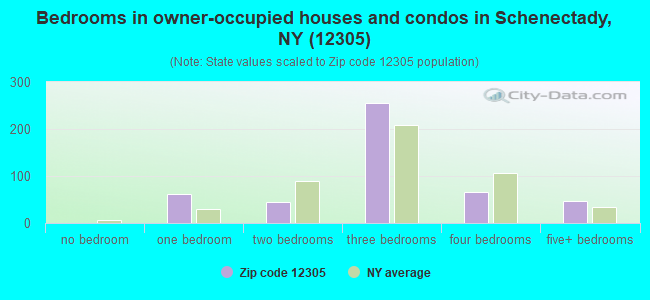
Median number of rooms in houses and condos:
Here:
6.9
State:
6.3
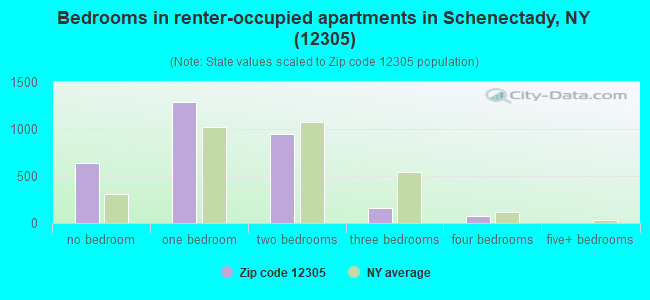
Median number of rooms in apartments:
Here:
3.3
State:
3.8
Notable locations in this zip code not listed on our city pages
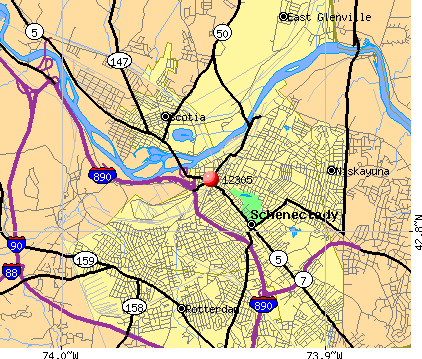
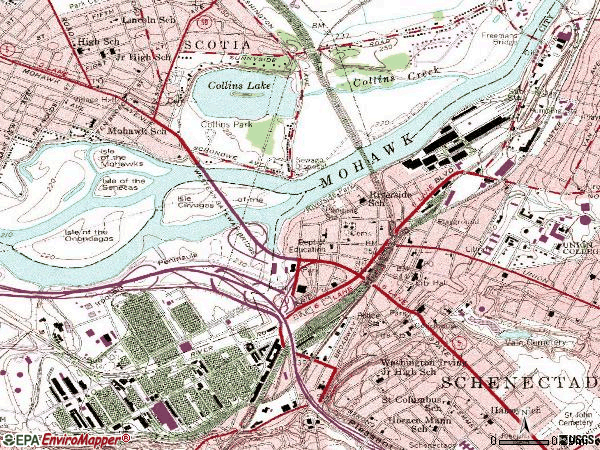
Notable locations in zip code 12305: Niagara-Mohawk Power Corporation Weaver Street Sub-Station (A), Schenectady Business And Technology Center (B), Grems-Doolittle Library (C), Schenectady Central Fire Station (D), Schenectady County Jail (E), Schenectady County Court House (F), Schenectady Boys Club (G), John A Howe Memorial Library (H), Schenectady Civic Play House (I), Mohawk Club (J), Shaughnessy Hall (K), Norman B Johnson Library (L), Schenectady County Public Library (M), Terbush And Powell Building (N), Schenectady Labor Temple (O), Schenectady City Hall (P), Broadway Center (Q), Fabian's Proctor Theatre (R), Carl B Taylor Auditorium (S), Center For Science And Technology (T). Display/hide their locations on the map
Churches in zip code 12305 include: Saint Joseph's Roman Catholic Church (A), Emmanuel Baptist Church (B), First United Methodist Church (C), Saint Anthony's Italian Roman Catholic Church (D), Friendship Baptist Church (E), Holy Cross Roman Catholic Church (F), First Presbyterian Church (G), Saint George Episcopal Church (H), First Reformed Church (I). Display/hide their locations on the map
Cemeteries: First Presbyterian Cemetery (1), First Reformed Church Cemetery (2), Saint George's Episcopal Cemetery (3). Display/hide their locations on the map
264 married couples with children.
126 single-parent households (10 men, 116 women).
90.1% of residents of 12305 zip code speak English at home.
4.0% of residents speak Spanish at home (63% very well, 19% well, 19% not well).
3.1% of residents speak other Indo-European language at home (72% very well, 12% well, 4% not well, 11% not at all).
0.9% of residents speak Asian or Pacific Island language at home (52% very well, 39% well, 9% not at all).
1.2% of residents speak other language at home (100% very well).
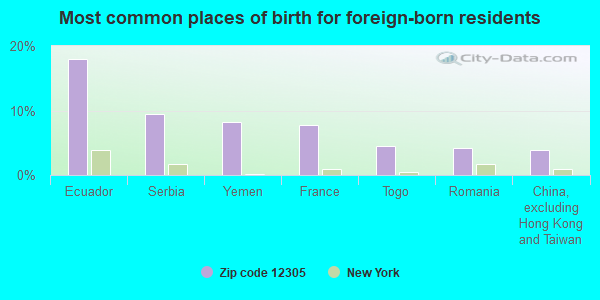
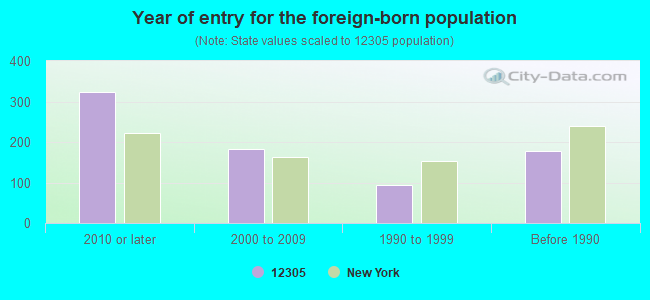
Foreign born population: 570 (8.4%) (57.7% of them are naturalized citizens)
Facilities with environmental interests located in this zip code:
COYNE INDUSTRIAL LAUNDRY (1435 ERIE BLVD in SCHENECTADY, NY)
AIR MINOR (AIRS/AFS) STATE MASTER (New York facility tracking) - AIR PROGRAM, (Resource Conservation and Recovery Act (tracking hazardous waste)) Business SIC classification: DRYCLEANING PLANTS, EXCEPT RUG CLEANING; INDUSTRIAL LAUNDERERS Business NAICS classification: INDUSTRIAL LAUNDERERS. Organizations: COYNE INDUSTRIAL LAUNDRIES (LEGALLY RESPONSIBLE PARTY)
Alternative names: COYNE TEXTILE SERVICE
CITY OF SCHENECTADY (STATE ST NYS RT 5 in SCHENECTADY, NY)
Large Quantity Generators, more that 1000 kg of hazardous waste/month (Resource Conservation and Recovery Act (tracking hazardous waste)) Alternative names: SCHENECTADY CITY OF RAIL ROAD BRIDGE
CITY EMPLOYEE PARKING LOT (COR OF BROADWAY & LIBERTY STS in SCHENECTADY, NY)
(Resource Conservation and Recovery Act (tracking hazardous waste)) Organizations: CITY OF SCHENECTADY (CONTACT/OPERATOR)
HUDSON RIVER ESTATES INC (MAXON RD SITE FORMERLY D & H in SCHENECTADY, NY)
(Resource Conservation and Recovery Act (tracking hazardous waste))
COYNE TEXTILE SERVICES (45-46 N JAY ST in SCHENECTADY, NY)
Conditionally Exempt Small Quantity Generators, less than 100 kg/month of hazardous waste (Resource Conservation and Recovery Act (tracking hazardous waste)) Business NAICS classification: GENERAL AUTOMOTIVE REPAIR. Organizations: COYNE INT ENTERPRISES (CONTACT/OPERATOR)
158-164 ERIE BOULEVARD LLC (158-164 ERIE BLVD in SCHENECTADY, NY)
Small Quantity Generators, between 100 kg and 1000 kg of hazardous waste/month (Resource Conservation and Recovery Act (tracking hazardous waste)) - notification Organizations: MILTON BINDELL (CONTACT/OWNER)
1741 CHRISLER CORP DBA MAACO AUTO PAINT (1741 CHRISLER AVE in SCHENECTADY, NY)
Conditionally Exempt Small Quantity Generators, less than 100 kg/month of hazardous waste (Resource Conservation and Recovery Act (tracking hazardous waste)) - notification Organizations: FRANK LUPACCHINO (CONTACT/OWNER)
ACME PRESS INC (306-314 UNION ST in SCHENECTADY, NY)
Conditionally Exempt Small Quantity Generators, less than 100 kg/month of hazardous waste (Resource Conservation and Recovery Act (tracking hazardous waste)) - notification Organizations: LYNN P MADDEN (CONTACT/OWNER)
ANCAS FOREIGN AUTO PARTS INC (1401 ERIE BLVD in SCHENECTADY, NY)
Small Quantity Generators, between 100 kg and 1000 kg of hazardous waste/month (Resource Conservation and Recovery Act (tracking hazardous waste)) - notification Organizations: ANGELO & ROCCO CASCHERA (CONTACT/OWNER)
Housing units lacking complete kitchen facilities: 1.0%
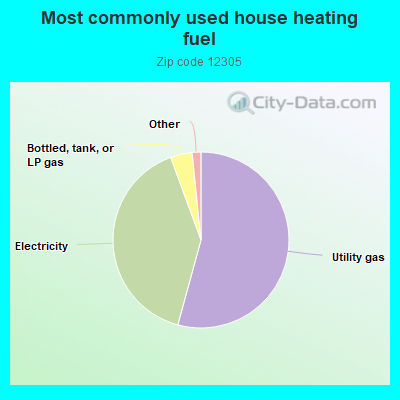
54.3%Utility gas
40.2%Electricity
4.0%Bottled, tank, or LP gas
0.8%No fuel used
0.8%Other fuel
Population in 1990: 6,253.
Place of birth for U.S.-born residents:
This state: 4,328
Northeast: 851
Midwest: 244
South: 409
West: 222
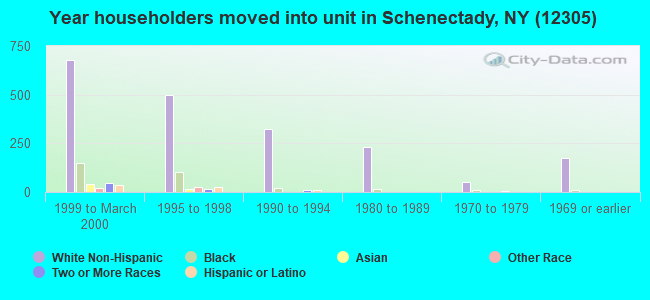
37% of the 12305 zip code residents lived in the same house 5 years ago. Out of people who lived in different houses, 38% lived in this county. Out of people who lived in different counties, 50% lived in New York.
77% of the 12305 zip code residents lived in the same house 1 year ago. Out of people who lived in different houses, 58% moved from this county. Out of people who lived in different houses, 36% moved from different county within same state. Out of people who lived in different houses, 6% moved from different state.
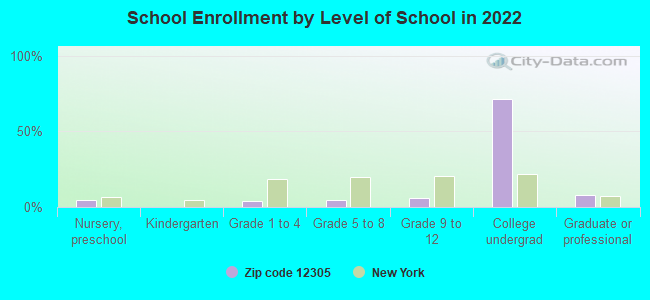
Private vs. public school enrollment:
Students in private schools in grades 1 to 8 (elementary and middle school):
Here:
0.0%
New York:
15.6%
Students in private schools in grades 9 to 12 (high school):
Here:
0.0%
New York:
15.0%
Students in private undergraduate colleges: 852
Here:
68.2%
New York:
39.2%
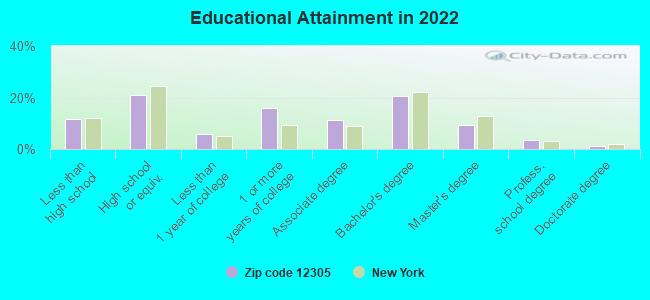
Occupation by median earnings in the past 12 months ($)
139,766Legal occupations
106,490Computer and mathematical occupations
87,093Health diagnosing and treating practitioners and other technical occupations
81,807Architecture and engineering occupations
74,039Business and financial operations occupations
69,660Life, physical, and social science occupations
Companies with federal contracts located in this zip code (SCHENECTADY, NY):
BECHTEL TECHNICAL SERVICES INC (600 LIBERTY ST) : $198,216,943 in 3 contractsfrom 1999 to 2000
$100,500,000 with Navy for Nuclear Reactors. Signed on 1999-11-19. Completion date: 2003-09-30.
$89,000,000, same as above.Signed on 1999-11-09. Completion date: 2005-12-31.
$8,716,943, same as above.Signed on 2000-08-16. Completion date: 2003-09-30.
GENERAL ELECTRIC COMPANY INC (1 RIVER RD BLDG 33) : $329,745 in 11 contractsfrom 2001 to 2004
Contracts for Lease or Rental of Equipment -- Refrigeration, Air Conditioning, and Air Circulating Equipment, Diesel Engines and Components, Maintenance, Repair or Alteration of Real Property -- Other Non-Building Facilities, Lease or Rental of Equipment -- Construction, Mining, Excavating, and Highway Maintenance Equipment, and moreby Navy, Air Force, Army Signed by year:2000: $0; 2001: $59,643; 2002: $67,570; 2003: $194,004; 2004: $8,528; 2005: $0; 2006: $0.
Biggest contracts:
$102,236 with Navy for Lease or Rental of Equipment -- Refrigeration, Air Conditioning, and Air Circulating Equipment. Signed on 2003-04-18. Completion date: 2003-12-12.
$62,000 with Air Force for Diesel Engines and Components. Signed on 2003-03-25. Completion date: 2003-04-09.
$33,495 with Air Force for Maintenance, Repair or Alteration of Real Property -- Other Non-Building Facilities. Taking place in DE. Signed on 2002-04-05. Completion date: 2002-04-05.
$32,575 with Navy for Lease or Rental of Equipment -- Refrigeration, Air Conditioning, and Air Circulating Equipment. Signed on 2002-09-04. Completion date: 2003-01-06.
N Y S A R C, INC, SCHENECTADY (214 STATE ST) : $204,405 in 5 contractsfrom 2002 to 2004
Contracts for Custodial Janitorial Services by Defense Logistics Agency Signed by year:2000: $0; 2001: $0; 2002: $46,968; 2003: $102,276; 2004: $55,161; 2005: $0; 2006: $0.
Biggest contracts:
$55,161 with Defense Logistics Agency for Custodial Janitorial Services. Signed on 2004-10-13. Completion date: 2005-09-30.
$51,138, same as above.Signed on 2003-10-02. Completion date: 2004-09-30.
$51,138, same as above.Signed on 2003-10-02. Completion date: 2004-09-30.
$46,968, same as above.Signed on 2002-08-09. Completion date: 2003-09-30.
INTERNATIONAL SYSTEMS OF AMERI (402 HAMILTON STREET, SUITE; small business) : $162,453 in 5 contractsfrom 2002 to 2003
Contracts for Maintenance, Repair and Rebuilding of Equipment -- Instruments and Laboratory Equipment, Miscellaneous Alarm, Signal and Security Detection Systems, Insect and Rodent Control Services, Miscellaneous Electrical and Electronic Components by Air Force, Bureau of Reclamation, Navy Signed by year:2000: $0; 2001: $0; 2002: $44,000; 2003: $118,453; 2004: $0; 2005: $0; 2006: $0.
Biggest contracts:
$45,068 with Air Force for Maintenance, Repair and Rebuilding of Equipment -- Instruments and Laboratory Equipment. Signed on 2003-09-23. Completion date: 2003-09-09.
$44,000 with Bureau of Reclamation for Miscellaneous Alarm, Signal and Security Detection Systems. Taking place in CA. Signed on 2002-08-15. Completion date: 2002-10-15.
$29,654 with Air Force for Insect and Rodent Control Services. Taking place in TX. Signed on 2003-05-27. Completion date: 2003-06-10.
$25,605 with Navy for Miscellaneous Electrical and Electronic Components. Signed on 2003-02-04. Completion date: 2003-03-31.
ADC ACQUISITION COMPANY (407 FRONT ST; small business) : $46,935 in 2 contractsfrom 2005 to 2006
$27,566 with Army for Fiber Optic Accessories And Supplies. Signed on 2005-03-02. Completion date: 2005-04-26.
$19,369 with Army for Wrapping and Packaging Machinery. Signed on 2006-03-01. Completion date: 2006-04-12.
WOLFE SAFE & LOCK CO INC (136 ERIE BLVD; small business)
$31,995 with Navy for Books and Pamphlets. Signed on 2002-03-12. Completion date: 2002-05-12.
Top industries in this zip code by the number of employees in 2005:
Arts, Entertainment, and Recreation: Other Gambling Industries (250-499 employees: 1 establishment, 50-99 employees: 1 establishment)
Finance and Insurance: Savings Institutions (250-499: 1, 5-9: 2)
Health Care and Social Assistance: Other Individual and Family Services (50-99: 2, 20-49: 3, 10-19: 1, 5-9: 3, 1-4: 1)
Health Care and Social Assistance: Home Health Care Services (100-249: 1, 50-99: 1)
2004 - 2018 National Fire Incident Reporting System (NFIRS) incidents
According to the data from the years 2004 - 2018 the average number of fires per year is 87. The highest number of fires - 160 took place in 2015, and the least - 1 in 2010. The data has a declining trend.
When looking into fire subcategories, the most incidents belonged to: Structure Fires (77.9%), and Outside Fires (13.2%).
Fire incident types reported to NFIRS in Zip Code 12305
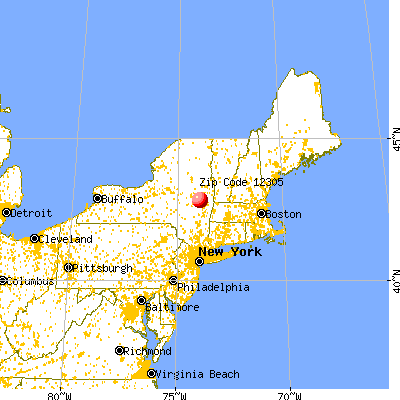


 Nearest zip codes: 12307, 12308, 12008, 12303, 12304, 12302.
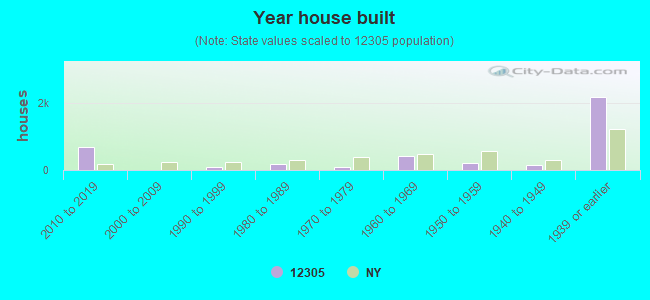


 According to the data from the years 2004 - 2018 the average number of fires per year is 87. The highest number of fires - 160 took place in 2015, and the least - 1 in 2010. The data has a declining trend.
 When looking into fire subcategories, the most incidents belonged to: Structure Fires (77.9%), and Outside Fires (13.2%).