Estimated zip code population in 2022: 8,063 Zip code population in 2010: 8,248 Zip code population in 2000: 8,396
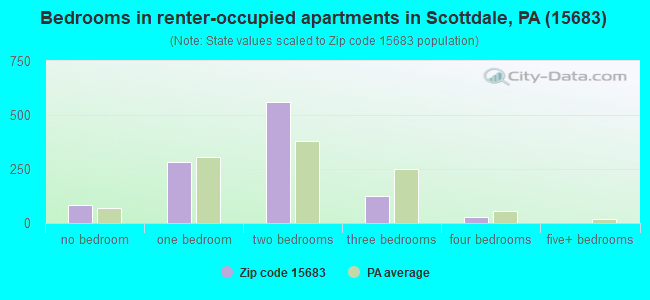
Houses and condos: 3,857 Renter-occupied apartments: 1,069
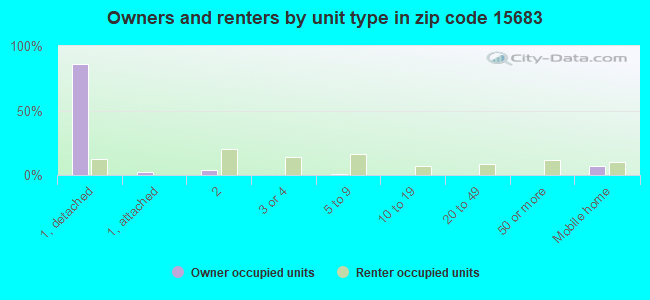
% of renters here:
29%
State:
31%
March 2022 cost of living index in zip code 15683: 89.2 (less than average, U.S. average is 100)
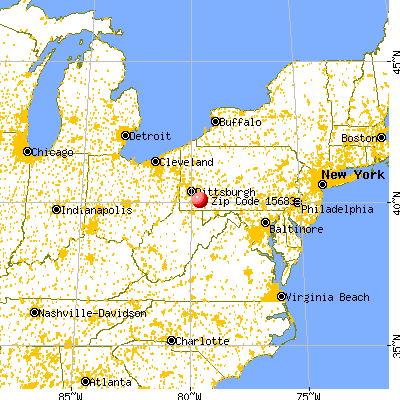
Land area: 15.6 sq. mi. Water area: 0.0 sq. mi.
Population density: 517 people per square mile
(low).
OSM Map
General Map
Google Map
MSN Map
OSM Map
General Map
Google Map
MSN Map
OSM Map
General Map
Google Map
MSN Map
OSM Map
General Map
Google Map
MSN Map
Please wait while loading the map...
Real estate property taxes paid for housing units in 2022:
This zip code:
1.1% ($1,704)
Pennsylvania:
1.3% ($3,094)
Median real estate property taxes paid for housing units with mortgages in 2022: $1,659 (1.0%) Median real estate property taxes paid for housing units with no mortgage in 2022: $1,762 (1.2%)
Business Search- 14 Million verified businesses
Males: 3,611
(44.8%)
Females: 4,451
(55.2%)
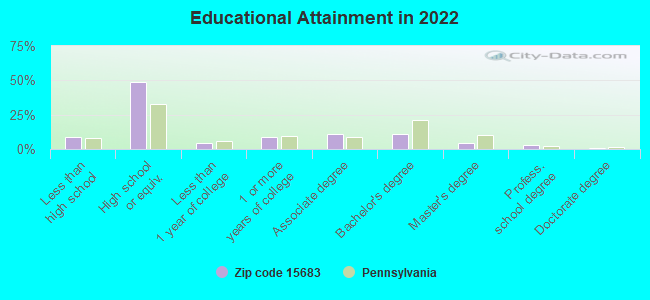
For population 25 years and over in 15683:
High school or higher: 90.5%
Bachelor's degree or higher: 18.6%
Graduate or professional degree: 7.8%
Unemployed: 4.9%
Mean travel time to work (commute): 25.5 minutes
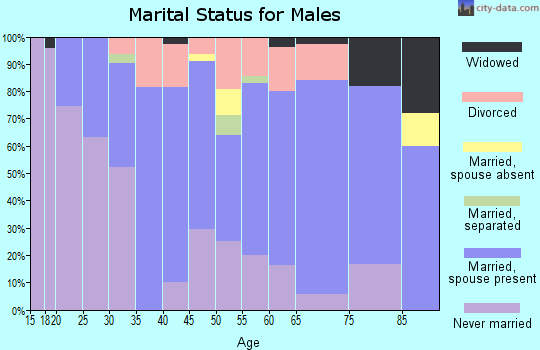
For population 15 years and over in 15683:
Never married: 26.9%
Now married: 47.4%
Separated: 1.3%
Widowed: 12.0%
Divorced: 12.3%
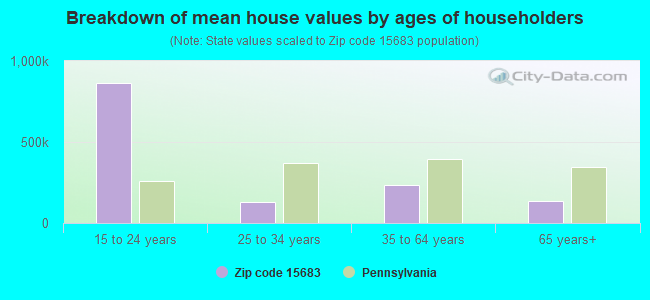
Zip code 15683 compared to state average:
Median house value below state average.
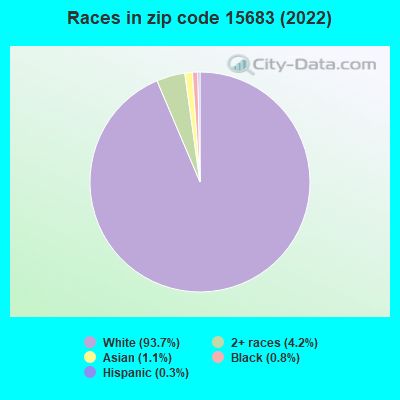
Black race population percentage significantly below state average.
Hispanic race population percentage significantly below state average.
Median age above state average.
Foreign-born population percentage significantly below state average.
Length of stay since moving in above state average.
Percentage of population with a bachelor's degree or higher below state average.
Estimated median house/condo value in 2022: $158,457
15683:
$158,457
Pennsylvania:
$245,500
According to our research of Pennsylvania and other state lists, there were 9 registered sex offenders living in 15683 zip code as of May 05, 2024. The ratio of all residents to sex offenders in zip code 15683 is 916 to 1. The ratio of registered sex offenders to all residents in this zip code is lower than the state average.
Median resident age:
This zip code:
48.3 years
Pennsylvania median age:
40.9 years
Average household size:
This zip code:
2.2 people
Pennsylvania:
2.4 people
Averages for the 2020 tax year for zip code 15683, filed in 2021:
Average Adjusted Gross Income (AGI) in 2020: $58,350 (Individual Income Tax Returns)
Here:
$58,350
State:
$75,707
Salary/wage: $50,449 (reported on 79.8% of returns)
Here:
$50,449
State:
$62,806
(% of AGI for various income ranges: 1105.5% for AGIs below $25k, 3274.5% for AGIs $25k-50k, 6135.9% for AGIs $50k-75k, 8500.3% for AGIs $75k-100k, 14964.8% for AGIs $100k-200k, 86950.0% for AGIs over 200k)
Taxable interest for individuals: $999 (reported on 29.7% of returns)
This zip code:
$999
Pennsylvania:
$1,633
(% of AGI for various income ranges: 30.8% for AGIs below $25k, 25.7% for AGIs $25k-50k, 43.3% for AGIs $50k-75k, 53.2% for AGIs $75k-100k, 39.7% for AGIs $100k-200k, 1045.0% for AGIs over 200k)
Ordinary dividends: $5,414 (reported on 17.9% of returns)
Here:
$5,414
State:
$7,382
(% of AGI for various income ranges: 36.9% for AGIs below $25k, 39.6% for AGIs $25k-50k, 70.0% for AGIs $50k-75k, 71.5% for AGIs $75k-100k, 197.3% for AGIs $100k-200k, 10020.0% for AGIs over 200k)
Net capital gain/loss in AGI: +$4,829 (reported on 13.1% of returns)
Here:
+$4,829
State:
+$23,522
(% of AGI for various income ranges: 14.6% for AGIs below $25k, 14.2% for AGIs $25k-50k, 43.3% for AGIs $50k-75k, 130.0% for AGIs $75k-100k, 302.7% for AGIs $100k-200k, 3180.0% for AGIs over 200k)
Profit/loss from business: +$13,795 (reported on 10.8% of returns)
Here:
+$13,795
State:
+$16,274
(% of AGI for various income ranges: 83.4% for AGIs below $25k, 123.5% for AGIs $25k-50k, 127.4% for AGIs $50k-75k, 204.4% for AGIs $75k-100k, 896.7% for AGIs $100k-200k)
Taxable individual retirement arrangement distribution: $12,660 (reported on 11.8% of returns)
15683:
$12,660
Pennsylvania:
$18,583
(% of AGI for various income ranges: 100.9% for AGIs below $25k, 96.6% for AGIs $25k-50k, 168.9% for AGIs $50k-75k, 361.5% for AGIs $75k-100k, 707.6% for AGIs $100k-200k)
Total itemized deductions: $37,709 (reported on 2.8% of returns)
Here:
$37,709
State:
$34,850
(% of AGI for various income ranges: 62.1% for AGIs below $25k, 152.4% for AGIs $50k-75k, 298.5% for AGIs $100k-200k, 9825.0% for AGIs over 200k)
Charity contributions: $11,211 (reported on 2.3% of returns)
Here:
$11,211
State:
$12,392
(% of AGI for various income ranges: 45.2% for AGIs $50k-75k, 80.3% for AGIs $100k-200k, 2680.0% for AGIs over 200k)
Taxes paid: $6,436 (reported on 2.8% of returns)
15683:
$6,436
State:
$8,200
(% of AGI for various income ranges: 38.0% for AGIs $50k-75k, 72.1% for AGIs $100k-200k, 1475.0% for AGIs over 200k)
Earned income credit: $2,071 (reported on 12.3% of returns)
Here:
$2,071
State:
$2,100
(% of AGI for various income ranges: 67.8% for AGIs below $25k, 57.0% for AGIs $25k-50k)
Percentage of individuals using paid preparers for their 2020 taxes: 92.7%
Here:
93%
State:
92%
(% for various income ranges: 90.6% for AGIs below $25k, 95.2% for AGIs $25k-50k, 93.5% for AGIs $50k-75k, 91.3% for AGIs $75k-100k, 93.9% for AGIs $100k-200k, 87.5% for AGIs over 200k)
Averages for the 2012 tax year for zip code 15683, filed in 2013:
Average Adjusted Gross Income (AGI) in 2012: $46,090 (Individual Income Tax Returns)
Here:
$46,090
State:
$61,346
Salary/wage: $41,880 (reported on 82.1% of returns)
Here:
$41,880
State:
$51,902
(% of AGI for various income ranges: 67.7% for AGIs below $25k, 76.0% for AGIs $25k-50k, 79.5% for AGIs $50k-75k, 81.0% for AGIs $75k-100k, 76.4% for AGIs $100k-200k, 52.8% for AGIs over 200k)
Taxable interest for individuals: $1,164 (reported on 34.5% of returns)
This zip code:
$1,164
Pennsylvania:
$1,588
(% of AGI for various income ranges: 1.7% for AGIs below $25k, 1.0% for AGIs $25k-50k, 0.8% for AGIs $50k-75k, 0.5% for AGIs $75k-100k, 0.6% for AGIs $100k-200k, 1.3% for AGIs over 200k)
Ordinary dividends: $3,389 (reported on 18.4% of returns)
Here:
$3,389
State:
$5,827
(% of AGI for various income ranges: 1.7% for AGIs below $25k, 0.7% for AGIs $25k-50k, 0.7% for AGIs $50k-75k, 0.9% for AGIs $75k-100k, 2.2% for AGIs $100k-200k, 2.7% for AGIs over 200k)
Net capital gain/loss in AGI: +$1,198 (reported on 10.8% of returns)
Here:
+$1,198
State:
+$14,495
(% of AGI for various income ranges: 0.1% for AGIs $25k-50k, 0.2% for AGIs $50k-75k, 0.2% for AGIs $75k-100k, 0.9% for AGIs $100k-200k)
Profit/loss from business: +$13,588 (reported on 10.6% of returns)
Here:
+$13,588
State:
+$16,268
(% of AGI for various income ranges: 4.1% for AGIs below $25k, 2.8% for AGIs $25k-50k, 1.8% for AGIs $50k-75k, 2.4% for AGIs $75k-100k, 6.4% for AGIs $100k-200k)
Taxable individual retirement arrangement distribution: $9,325 (reported on 12.1% of returns)
15683:
$9,325
Pennsylvania:
$14,550
(% of AGI for various income ranges: 4.5% for AGIs below $25k, 3.1% for AGIs $25k-50k, 2.4% for AGIs $50k-75k, 2.2% for AGIs $75k-100k, 2.1% for AGIs $100k-200k)
Total itemized deductions: $18,104 (18% of AGI, reported on 18.4% of returns)
Here:
$18,104
State:
$23,538
Here:
18.2% of AGI
State:
18.4% of AGI
(% of AGI for various income ranges: 3.4% for AGIs below $25k, 5.0% for AGIs $25k-50k, 6.2% for AGIs $50k-75k, 8.3% for AGIs $75k-100k, 10.5% for AGIs $100k-200k, 9.0% for AGIs over 200k)
Charity contributions: $3,810 (reported on 14.6% of returns)
Here:
$3,810
State:
$4,025
(% of AGI for various income ranges: 0.3% for AGIs below $25k, 0.6% for AGIs $25k-50k, 0.9% for AGIs $50k-75k, 1.4% for AGIs $75k-100k, 1.9% for AGIs $100k-200k, 2.2% for AGIs over 200k)
Taxes paid: $6,327 (reported on 18.4% of returns)
15683:
$6,327
State:
$9,982
(% of AGI for various income ranges: 0.6% for AGIs below $25k, 1.1% for AGIs $25k-50k, 1.8% for AGIs $50k-75k, 2.7% for AGIs $75k-100k, 4.2% for AGIs $100k-200k, 5.1% for AGIs over 200k)
Earned income credit: $1,907 (reported on 15.1% of returns)
Here:
$1,907
State:
$2,106
(% of AGI for various income ranges: 4.3% for AGIs below $25k, 0.9% for AGIs $25k-50k)
Percentage of individuals using paid preparers for their 2012 taxes: 54.2%
Here:
54%
State:
53%
(% for various income ranges: 49.1% for AGIs below $25k, 54.2% for AGIs $25k-50k, 60.0% for AGIs $50k-75k, 59.0% for AGIs $75k-100k, 60.0% for AGIs $100k-200k, 75.0% for AGIs over 200k)
Averages for the 2004 tax year for zip code 15683, filed in 2005:
Average Adjusted Gross Income (AGI) in 2004: $35,236 (Individual Income Tax Returns)
Here:
$35,236
State:
$48,049
Salary/wage: $33,254 (reported on 83.1% of returns)
Here:
$33,254
State:
$42,646
(% of AGI for various income ranges: 85.1% for AGIs below $10k, 70.9% for AGIs $10k-25k, 80.0% for AGIs $25k-50k, 85.3% for AGIs $50k-75k, 84.9% for AGIs $75k-100k, 65.3% for AGIs over 100k)
Taxable interest for individuals: $1,488 (reported on 47.5% of returns)
This zip code:
$1,488
Pennsylvania:
$1,657
(% of AGI for various income ranges: 6.2% for AGIs below $10k, 3.1% for AGIs $10k-25k, 1.8% for AGIs $25k-50k, 1.1% for AGIs $50k-75k, 1.0% for AGIs $75k-100k, 2.9% for AGIs over 100k)
Taxable dividends: $2,181 (reported on 22.7% of returns)
Here:
$2,181
State:
$3,566
(% of AGI for various income ranges: 2.1% for AGIs below $10k, 1.4% for AGIs $10k-25k, 0.9% for AGIs $25k-50k, 0.7% for AGIs $50k-75k, 1.0% for AGIs $75k-100k, 3.5% for AGIs over 100k)
Net capital gain/loss: +$2,686 (reported on 15.9% of returns)
Here:
+$2,686
State:
+$9,716
(% of AGI for various income ranges: -1.7% for AGIs below $10k, 0.4% for AGIs $10k-25k, 0.5% for AGIs $25k-50k, 0.6% for AGIs $50k-75k, 1.0% for AGIs $75k-100k, 4.5% for AGIs over 100k)
Profit/loss from business: +$10,345 (reported on 11.7% of returns)
Here:
+$10,345
State:
+$14,267
(% of AGI for various income ranges: 9.2% for AGIs below $10k, 3.7% for AGIs $10k-25k, 1.6% for AGIs $25k-50k, 2.2% for AGIs $50k-75k, 1.9% for AGIs $75k-100k, 8.5% for AGIs over 100k)
IRA payment deduction: $2,654 (reported on 4.1% of returns)
15683:
$2,654
Pennsylvania:
$2,903
(% of AGI for various income ranges: 0.4% for AGIs $10k-25k, 0.4% for AGIs $25k-50k, 0.3% for AGIs $50k-75k, 0.2% for AGIs $75k-100k, 0.2% for AGIs over 100k)
Total itemized deductions: $14,214 (20% of AGI, reported on 19.1% of returns)
Here:
$14,214
State:
$18,804
Here:
20.3% of AGI
State:
19.5% of AGI
(% of AGI for various income ranges: 4.4% for AGIs below $10k, 4.3% for AGIs $10k-25k, 6.4% for AGIs $25k-50k, 8.5% for AGIs $50k-75k, 10.0% for AGIs $75k-100k, 10.1% for AGIs over 100k)
Charity contributions deductions: $2,570 (3% of AGI, reported on 16.0% of returns)
Here:
$2,570
State:
$3,337
Here:
3.5% of AGI
State:
3.3% of AGI
(% of AGI for various income ranges: 0.6% for AGIs $10k-25k, 0.8% for AGIs $25k-50k, 1.2% for AGIs $50k-75k, 1.6% for AGIs $75k-100k, 2.0% for AGIs over 100k)
Total tax: $4,280 (reported on 75.3% of returns)
15683:
$4,280
State:
$8,008
(% of AGI for various income ranges: 2.6% for AGIs below $10k, 4.0% for AGIs $10k-25k, 6.5% for AGIs $25k-50k, 8.8% for AGIs $50k-75k, 10.4% for AGIs $75k-100k, 18.1% for AGIs over 100k)
Earned income credit: $1,583 (reported on 14.0% of returns)
Here:
$1,583
State:
$1,643
Percentage of individuals using paid preparers for their 2004 taxes: 57.2%
Here:
57%
State:
56%
(% for various income ranges: 50.4% for AGIs below $10k, 59.4% for AGIs $10k-25k, 58.6% for AGIs $25k-50k, 58.5% for AGIs $50k-75k, 56.1% for AGIs $75k-100k, 65.8% for AGIs over 100k)
Likely homosexual households (counted as self-reported same-sex unmarried-partner households)
Lesbian couples: 0.2% of all households
Gay men: 0.0% of all households
Household received Food Stamps/SNAP in the past 12 months: 947 Household did not receive Food Stamps/SNAP in the past 12 months: 2,782
Women who had a birth in the past 12 months: 145 (85 now married, 56 unmarried) Women who did not have a birth in the past 12 months: 1,505 (575 now married, 930 unmarried)
Housing units in zip code 15683 with a mortgage: 1,313 (112 second mortgage, 16 home equity loan, 92 both second mortgage and home equity loan) Houses without a mortgage: 245
Median monthly owner costs for units with a mortgage: $1,154 Median monthly owner costs for units without a mortgage: $496
Residents with income below the poverty level in 2022:
This zip code:
13.9%
Whole state:
11.8%
Residents with income below 50% of the poverty level in 2022:
This zip code:
7.6%
Whole state:
6.1%
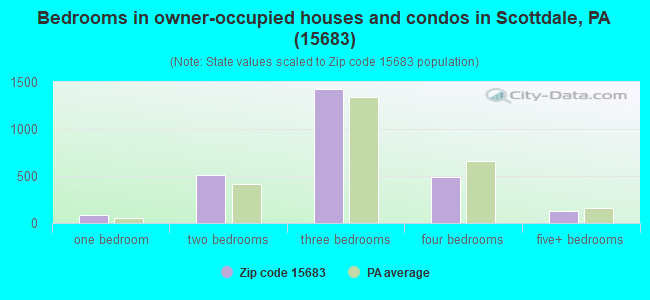
Median number of rooms in houses and condos:
Here:
6.4
State:
6.8
Median number of rooms in apartments:
Here:
4.2
State:
4.3
Notable locations in this zip code not listed on our city pages
Notable locations in zip code 15683: Guardian Angels Day Care and Learning Center (A), Central Day Care Center (B), Scottdale Public Library (C), Scottdale Volunteer Fire Department (D), Scottdale Volunteer Fire Department Main Station (E), Scottdale Volunteer Fire Department Station 4 (F). Display/hide their locations on the map
730 married couples with children.
453 single-parent households (82 men, 371 women).
97.6% of residents of 15683 zip code speak English at home.
0.8% of residents speak Spanish at home (98% very well, 2% not well).
0.6% of residents speak other Indo-European language at home (59% very well, 32% well, 9% not at all).
0.9% of residents speak Asian or Pacific Island language at home (12% very well, 49% well, 21% not well, 19% not at all).
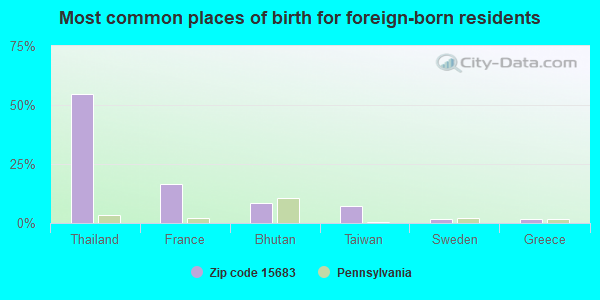
Foreign born population: 107 (1.3%) (46.2% of them are naturalized citizens)
This zip code:
1.3%
Whole state:
7.5%
55%Thailand
17%France
8%Bhutan
7%Taiwan
2%Sweden
2%Greece
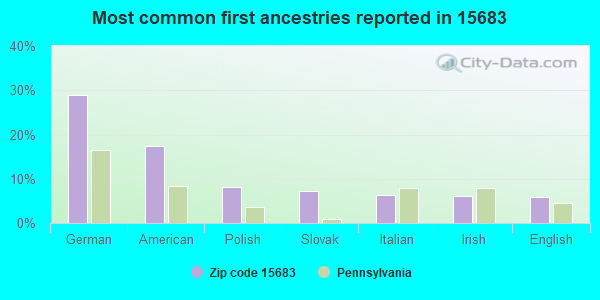
29%German
17%American
8%Polish
7%Slovak
6%Italian
6%Irish
6%English
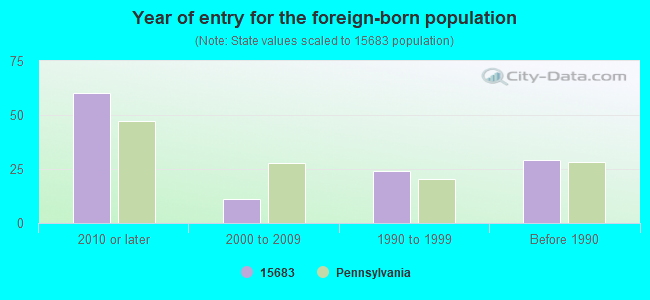
Year of entry for the foreign-born population
602010 or later
112000 to 2009
241990 to 1999
29Before 1990
Facilities with environmental interests located in this zip code:
ALLEGHENY DRY KILNS (DEXTER ROAD in SCOTTDALE, PA)
AIR MINOR (AIRS/AFS) Business SIC classification: HARDWOOD DIMENSION AND FLOORING MILLS Alternative names: ALLEGHENY DRY KILNS/SCOTTDALE
ATLANTIC SERVICE STATION (800 WATER ST-TANKS in SCOTTDALE, PA)
Conditionally Exempt Small Quantity Generators, less than 100 kg/month of hazardous waste (Resource Conservation and Recovery Act (tracking hazardous waste)) - notification Organizations: OPERNAME (CONTACT/OPERATOR)
, ATLANTIC REFINING & MARKETING (CONTACT/OWNER)
BELDEN & BLAKE SCOTTDALE STP (TR 742 in SCOTTDALE, PA)
National Pollutant Discharge Elimination System NON-MAJOR (Tracking pollutant discharge elimination systems) - permit Business SIC classification: MIXED, MANUFACTURED, OR LIQUEFIED PETROLEUM GAS PRODUCTION AND/OR DISTRIBUTION Alternative names: BELDEN AND BLAKE CORPORATION
Housing units lacking complete plumbing facilities: 1.9% Housing units lacking complete kitchen facilities: 3.8%
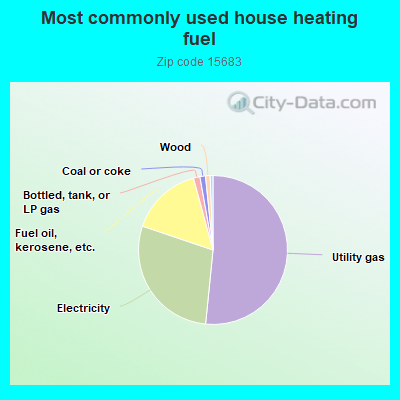
51.6%Utility gas
28.6%Electricity
15.6%Fuel oil, kerosene, etc.
1.4%Bottled, tank, or LP gas
1.2%Coal or coke
1.0%Wood
Population in 1990: 6,132. Population change in the 1990s: +2,264 (+36.9%).
Place of birth for U.S.-born residents:
This state: 6,898
Northeast: 58
Midwest: 359
South: 413
West: 165
68% of the 15683 zip code residents lived in the same house 5 years ago. Out of people who lived in different houses, 63% lived in this county. Out of people who lived in different counties, 50% lived in Pennsylvania.
93% of the 15683 zip code residents lived in the same house 1 year ago. Out of people who lived in different houses, 63% moved from this county. Out of people who lived in different houses, 30% moved from different county within same state. Out of people who lived in different houses, 7% moved from different state.
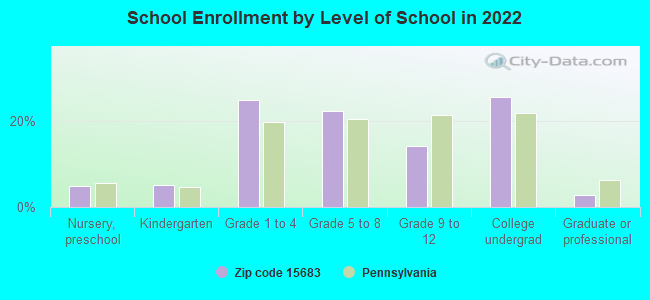
Private vs. public school enrollment:
Students in private schools in grades 1 to 8 (elementary and middle school): 49
Here:
7.0%
Pennsylvania:
15.7%
Students in private schools in grades 9 to 12 (high school): 5
Here:
2.6%
Pennsylvania:
13.4%
Students in private undergraduate colleges: 183
Here:
47.6%
Pennsylvania:
39.8%
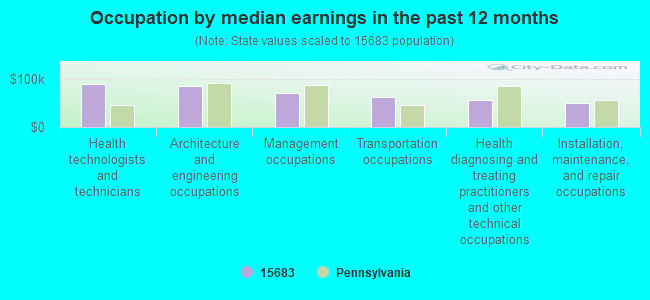
Occupation by median earnings in the past 12 months ($)
90,280Health technologists and technicians
85,761Architecture and engineering occupations
71,632Management occupations
62,612Transportation occupations
55,891Health diagnosing and treating practitioners and other technical occupations
50,671Installation, maintenance, and repair occupations
Companies with federal contracts located in this zip code (SCOTTDALE, PA):
SKOVIRA MACHINE COMPANY (RD#1 BOX 630; small business) : $5,436,129 in 139 contractsfrom 1999 to 2006
Contracts for Valves, Nonpowered, Valves, Powered, Packing and Gasket Materials, Nuts and Washers, and moreby Navy Signed by year:2000: $158,187; 2001: $222,512; 2002: $1,407,334; 2003: $708,559; 2004: $1,265,984; 2005: $953,699; 2006: $691,189.
Biggest contracts:
$966,900 with Navy for Valves, Nonpowered. Signed on 2002-12-18. Completion date: 2003-12-18.
$651,600 with Navy for Valves, Powered. Signed on 2004-08-30. Completion date: 2005-05-07.
$299,200, same as above.Signed on 2003-08-26. Completion date: 2004-06-01.
$292,500, same as above.Signed on 2006-06-28. Completion date: 2007-06-28.
MARWAS STEEL COMPANY (1 MT PLEASANT RD; small business) : $486,054 in 4 contractsfrom 2000 to 2002
$422,070 with U.S. Army Corps of Engineers - civil program financing only for Wire, Nonelectrical. Signed on 2000-03-03. Completion date: 2000-11-01.
$58,224 with U.S. Army Corps of Engineers - civil program financing only for Chain and Wire Rope. Signed on 2002-04-29. Completion date: 2002-07-01.
$6,037, same as above.Signed on 2002-10-28. Completion date: 2002-11-19.
-$277 with U.S. Army Corps of Engineers - civil program financing only for Wire, Nonelectrical. Signed on 2002-09-27. Completion date: 2000-11-01.
R E UPTEGRAFF MANUFACTURING (1 UPTEGRAFF DR; small business) 51 employees, $4953551 revenue. Woman Owned Business: $253,640 in 3 contractsfrom 2003 to 2005
$261,390 with ENERGY, Department of for Coils and Transformers. Signed on 2003-09-15. Completion date: 2004-09-15.
$0, same as above.Signed on 2004-01-23. Effective on 2004-01-12. Completion date: 2004-09-01.
-$7,750, same as above.Signed on 2005-09-02. Completion date: 2005-09-02.
PENN LINE SERVICE, INC (300 SCOTTDALE AVE) : $93,352 in 3 contractsfrom 2003 to 2005
$52,008 with Army for Construction of Structures and Facilities -- Other Non-Building Facilities. Signed on 2003-03-11. Completion date: 2003-04-24.
$20,672 with U.S. Army Corps of Engineers - civil program financing only for Pesticides Support Services. Signed on 2005-02-15. Completion date: 2004-08-30.
$20,672 with Army for Pesticides Support Services. Signed on 2005-02-15. Completion date: 2004-08-30.
Top industries in this zip code by the number of employees in 2005:
Management of Companies and Enterprises: Corporate, Subsidiary, and Regional Managing Offices (500-999 employees: 1 establishment)
Administrative and Support and Waste Management and Remediation Services: Solid Waste Collection (100-249: 1)
Construction: Power and Communication Line and Related Structures Construction (50-99: 2, 5-9: 1)
Arts, Entertainment, and Recreation: Fitness and Recreational Sports Centers (50-99: 1, 5-9: 1)
Construction: Highway, Street, and Bridge Construction (50-99: 1)
People in group quarters in 2010:
37 people in nursing facilities/skilled-nursing facilities
33 people in group homes intended for adults
2 people in other noninstitutional facilities
People in group quarters in 2000:
39 people in nursing homes
37 people in other noninstitutional group quarters
31 people in other group homes
21 people in schools, hospitals, or wards for the intellectually disabled
7 people in religious group quarters
Fatal accident statistics in 2012:
Fatal accident count: 1
Vehicles involved in fatal accidents: 1
Fatal accidents caused by drunken drivers: 1
Fatalities: 1
Persons involved in fatal accidents: 1
Pedestrians involved in fatal accidents: 0
Fatal accident statistics in 2010:
Fatal accident count: 1
Vehicles involved in fatal accidents: 2
Fatal accidents caused by drunken drivers: 0
Fatalities: 2
Persons involved in fatal accidents: 3
Pedestrians involved in fatal accidents: 0
Home Mortgage Disclosure Act Aggregated Statistics For Year 2009 (Based on 3 full and 2 partial tracts)
A) FHA, FSA/RHS & VA Home Purchase Loans
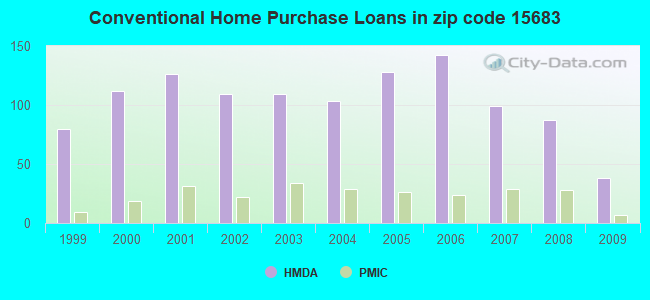
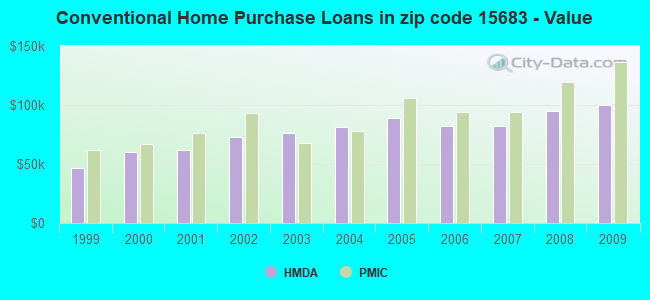
B) Conventional Home Purchase Loans
C) Refinancings
D) Home Improvement Loans
E) Loans on Dwellings For 5+ Families
F) Non-occupant Loans on < 5 Family Dwellings (A B C & D)
G) Loans On Manufactured Home Dwelling (A B C & D)
Number
Average Value
Number
Average Value
Number
Average Value
Number
Average Value
Number
Average Value
Number
Average Value
Number
Average Value
LOANS ORIGINATED
44
$110,507
38
$100,351
173
$97,871
28
$30,796
1
$18,000
10
$55,800
8
$35,551
APPLICATIONS APPROVED, NOT ACCEPTED
3
$78,657
9
$93,872
15
$89,959
2
$78,075
0
$0
2
$47,465
1
$38,150
APPLICATIONS DENIED
5
$87,778
5
$63,238
92
$114,550
21
$32,060
0
$0
3
$95,977
3
$8,477
APPLICATIONS WITHDRAWN
3
$72,847
1
$68,000
42
$108,970
1
$4,000
0
$0
1
$64,000
0
$0
FILES CLOSED FOR INCOMPLETENESS
0
$0
0
$0
5
$94,468
1
$98,910
0
$0
0
$0
0
$0
Aggregated Statistics For Year 2008 (Based on 3 full and 2 partial tracts)
A) FHA, FSA/RHS & VA Home Purchase Loans
B) Conventional Home Purchase Loans
C) Refinancings
D) Home Improvement Loans
F) Non-occupant Loans on < 5 Family Dwellings (A B C & D)
G) Loans On Manufactured Home Dwelling (A B C & D)
Number
Average Value
Number
Average Value
Number
Average Value
Number
Average Value
Number
Average Value
Number
Average Value
LOANS ORIGINATED
32
$99,801
87
$94,501
134
$91,707
43
$23,866
14
$37,612
8
$57,050
APPLICATIONS APPROVED, NOT ACCEPTED
1
$194,000
7
$104,533
13
$114,287
6
$28,120
2
$130,095
2
$33,710
APPLICATIONS DENIED
8
$60,471
15
$101,247
140
$102,714
46
$61,959
5
$66,392
26
$64,589
APPLICATIONS WITHDRAWN
0
$0
11
$118,062
41
$118,184
2
$39,130
1
$33,910
2
$75,355
FILES CLOSED FOR INCOMPLETENESS
2
$48,585
0
$0
13
$96,398
0
$0
0
$0
0
$0
Aggregated Statistics For Year 2007 (Based on 3 full and 2 partial tracts)
A) FHA, FSA/RHS & VA Home Purchase Loans
B) Conventional Home Purchase Loans
C) Refinancings
D) Home Improvement Loans
F) Non-occupant Loans on < 5 Family Dwellings (A B C & D)
G) Loans On Manufactured Home Dwelling (A B C & D)
Number
Average Value
Number
Average Value
Number
Average Value
Number
Average Value
Number
Average Value
Number
Average Value
LOANS ORIGINATED
25
$97,114
99
$82,098
148
$87,435
61
$32,197
23
$54,234
12
$65,311
APPLICATIONS APPROVED, NOT ACCEPTED
1
$91,840
13
$50,293
33
$92,354
12
$27,167
3
$68,377
4
$25,435
APPLICATIONS DENIED
1
$91,840
29
$86,709
257
$88,959
69
$44,178
5
$73,576
17
$88,635
APPLICATIONS WITHDRAWN
1
$132,820
7
$93,691
52
$98,498
3
$75,673
2
$118,980
1
$132,820
FILES CLOSED FOR INCOMPLETENESS
1
$118,690
4
$108,800
26
$91,726
0
$0
2
$73,000
0
$0
Aggregated Statistics For Year 2006 (Based on 3 full and 2 partial tracts)
A) FHA, FSA/RHS & VA Home Purchase Loans
B) Conventional Home Purchase Loans
C) Refinancings
D) Home Improvement Loans
E) Loans on Dwellings For 5+ Families
F) Non-occupant Loans on < 5 Family Dwellings (A B C & D)
G) Loans On Manufactured Home Dwelling (A B C & D)
Number
Average Value
Number
Average Value
Number
Average Value
Number
Average Value
Number
Average Value
Number
Average Value
Number
Average Value
LOANS ORIGINATED
20
$90,110
142
$81,787
194
$79,142
61
$38,963
1
$18,000
18
$50,762
11
$35,996
APPLICATIONS APPROVED, NOT ACCEPTED
0
$0
24
$57,955
32
$90,864
14
$34,282
0
$0
2
$9,915
3
$19,783
APPLICATIONS DENIED
2
$78,330
34
$57,287
211
$97,937
30
$34,935
0
$0
0
$0
15
$27,921
APPLICATIONS WITHDRAWN
0
$0
19
$76,317
116
$102,027
3
$104,157
0
$0
8
$53,222
2
$75,355
FILES CLOSED FOR INCOMPLETENESS
1
$72,000
1
$47,000
26
$89,828
1
$203,470
0
$0
2
$52,550
0
$0
Aggregated Statistics For Year 2005 (Based on 3 full and 2 partial tracts)
A) FHA, FSA/RHS & VA Home Purchase Loans
B) Conventional Home Purchase Loans
C) Refinancings
D) Home Improvement Loans
E) Loans on Dwellings For 5+ Families
F) Non-occupant Loans on < 5 Family Dwellings (A B C & D)
G) Loans On Manufactured Home Dwelling (A B C & D)
Number
Average Value
Number
Average Value
Number
Average Value
Number
Average Value
Number
Average Value
Number
Average Value
Number
Average Value
LOANS ORIGINATED
11
$99,815
128
$88,741
208
$77,726
58
$39,727
0
$0
21
$51,166
9
$47,131
APPLICATIONS APPROVED, NOT ACCEPTED
0
$0
17
$73,262
51
$72,376
12
$32,375
0
$0
2
$51,000
8
$44,890
APPLICATIONS DENIED
0
$0
44
$63,230
239
$88,797
54
$40,024
1
$127,170
10
$36,494
30
$44,960
APPLICATIONS WITHDRAWN
0
$0
21
$70,258
91
$102,313
20
$107,714
0
$0
2
$61,500
1
$31,090
FILES CLOSED FOR INCOMPLETENESS
1
$150,000
2
$52,000
14
$81,560
3
$24,993
0
$0
1
$50,000
0
$0
Aggregated Statistics For Year 2004 (Based on 3 full and 2 partial tracts)
A) FHA, FSA/RHS & VA Home Purchase Loans
B) Conventional Home Purchase Loans
C) Refinancings
D) Home Improvement Loans
F) Non-occupant Loans on < 5 Family Dwellings (A B C & D)
G) Loans On Manufactured Home Dwelling (A B C & D)
Number
Average Value
Number
Average Value
Number
Average Value
Number
Average Value
Number
Average Value
Number
Average Value
LOANS ORIGINATED
15
$98,105
103
$81,197
279
$84,083
95
$31,212
30
$61,355
8
$31,438
APPLICATIONS APPROVED, NOT ACCEPTED
1
$140,000
9
$48,410
81
$83,523
22
$17,131
2
$6,940
10
$38,886
APPLICATIONS DENIED
2
$103,000
28
$60,703
246
$77,562
52
$26,480
9
$55,788
21
$30,367
APPLICATIONS WITHDRAWN
3
$76,000
18
$73,223
105
$100,782
14
$29,823
5
$190,818
3
$200,297
FILES CLOSED FOR INCOMPLETENESS
0
$0
2
$71,390
42
$100,830
7
$41,196
0
$0
0
$0
Aggregated Statistics For Year 2003 (Based on 3 full and 2 partial tracts)
A) FHA, FSA/RHS & VA Home Purchase Loans
B) Conventional Home Purchase Loans
C) Refinancings
D) Home Improvement Loans
E) Loans on Dwellings For 5+ Families
F) Non-occupant Loans on < 5 Family Dwellings (A B C & D)
Number
Average Value
Number
Average Value
Number
Average Value
Number
Average Value
Number
Average Value
Number
Average Value
LOANS ORIGINATED
20
$84,484
109
$76,663
449
$77,629
70
$38,680
0
$0
25
$72,755
APPLICATIONS APPROVED, NOT ACCEPTED
2
$76,000
21
$55,914
97
$80,353
9
$24,249
0
$0
6
$87,842
APPLICATIONS DENIED
0
$0
33
$40,963
305
$78,849
61
$15,341
1
$3,673,800
9
$51,144
APPLICATIONS WITHDRAWN
3
$79,253
13
$74,858
117
$81,259
6
$51,988
0
$0
2
$67,500
FILES CLOSED FOR INCOMPLETENESS
0
$0
7
$66,773
20
$86,172
5
$33,000
0
$0
0
$0
Aggregated Statistics For Year 2002 (Based on 3 full and 2 partial tracts)
A) FHA, FSA/RHS & VA Home Purchase Loans
B) Conventional Home Purchase Loans
C) Refinancings
D) Home Improvement Loans
F) Non-occupant Loans on < 5 Family Dwellings (A B C & D)
Number
Average Value
Number
Average Value
Number
Average Value
Number
Average Value
Number
Average Value
LOANS ORIGINATED
29
$91,093
109
$72,474
332
$69,652
58
$31,905
12
$54,222
APPLICATIONS APPROVED, NOT ACCEPTED
0
$0
17
$38,000
101
$71,796
15
$30,673
3
$73,233
APPLICATIONS DENIED
2
$63,455
48
$41,608
268
$67,861
58
$16,669
9
$36,026
APPLICATIONS WITHDRAWN
1
$85,000
6
$52,615
143
$86,780
7
$16,413
1
$39,560
FILES CLOSED FOR INCOMPLETENESS
1
$75,000
2
$87,870
27
$74,182
2
$19,830
0
$0
Aggregated Statistics For Year 2001 (Based on 3 full and 2 partial tracts)
A) FHA, FSA/RHS & VA Home Purchase Loans
B) Conventional Home Purchase Loans
C) Refinancings
D) Home Improvement Loans
F) Non-occupant Loans on < 5 Family Dwellings (A B C & D)
Number
Average Value
Number
Average Value
Number
Average Value
Number
Average Value
Number
Average Value
LOANS ORIGINATED
29
$75,499
126
$61,929
383
$66,168
92
$24,809
15
$43,777
APPLICATIONS APPROVED, NOT ACCEPTED
2
$94,565
23
$55,727
106
$66,253
27
$30,580
5
$27,430
APPLICATIONS DENIED
8
$68,909
87
$49,057
282
$67,878
85
$15,412
8
$51,098
APPLICATIONS WITHDRAWN
2
$78,330
12
$62,088
143
$71,707
13
$24,298
8
$76,938
FILES CLOSED FOR INCOMPLETENESS
1
$89,000
3
$106,917
36
$71,131
0
$0
0
$0
Aggregated Statistics For Year 2000 (Based on 3 full and 2 partial tracts)
A) FHA, FSA/RHS & VA Home Purchase Loans
B) Conventional Home Purchase Loans
C) Refinancings
D) Home Improvement Loans
E) Loans on Dwellings For 5+ Families
F) Non-occupant Loans on < 5 Family Dwellings (A B C & D)
Number
Average Value
Number
Average Value
Number
Average Value
Number
Average Value
Number
Average Value
Number
Average Value
LOANS ORIGINATED
28
$70,575
112
$59,943
228
$56,307
86
$26,221
1
$153,000
6
$53,790
APPLICATIONS APPROVED, NOT ACCEPTED
3
$76,887
18
$38,211
74
$63,025
21
$14,262
0
$0
4
$35,198
APPLICATIONS DENIED
3
$83,927
101
$42,255
151
$70,015
71
$21,680
0
$0
3
$33,480
APPLICATIONS WITHDRAWN
1
$59,000
9
$50,158
51
$69,575
4
$16,438
0
$0
3
$99,403
FILES CLOSED FOR INCOMPLETENESS
1
$42,000
1
$59,000
11
$65,705
1
$56,520
0
$0
2
$19,830
Aggregated Statistics For Year 1999 (Based on 2 full and 1 partial tracts)
A) FHA, FSA/RHS & VA Home Purchase Loans
B) Conventional Home Purchase Loans
C) Refinancings
D) Home Improvement Loans
F) Non-occupant Loans on < 5 Family Dwellings (A B C & D)
2003 - 2018 National Fire Incident Reporting System (NFIRS) incidents
Based on the data from the years 2003 - 2018 the average number of fire incidents per year is 29. The highest number of fires - 61 took place in 2011, and the least - 4 in 2004. The data has a growing trend.
When looking into fire subcategories, the most reports belonged to: Structure Fires (54.0%), and Outside Fires (18.9%).
Fire incident types reported to NFIRS in Zip Code 15683


 Nearest zip codes: 15631, 15612, 15688, 15428, 15430, 15679.


 Based on the data from the years 2003 - 2018 the average number of fire incidents per year is 29. The highest number of fires - 61 took place in 2011, and the least - 4 in 2004. The data has a growing trend.
 When looking into fire subcategories, the most reports belonged to: Structure Fires (54.0%), and Outside Fires (18.9%).