Scottdale, Pennsylvania Submit your own pictures of this borough and show them to the world
OSM Map
General Map
Google Map
MSN Map
OSM Map
General Map
Google Map
MSN Map
OSM Map
General Map
Google Map
MSN Map
OSM Map
General Map
Google Map
MSN Map
Please wait while loading the map...
Population in 2022: 4,357 (100% urban, 0% rural). Population change since 2000: -8.7%Males: 2,140 Females: 2,217
March 2022 cost of living index in Scottdale: 88.9 (less than average, U.S. average is 100) Percentage of residents living in poverty in 2022: 14.3%for White Non-Hispanic residents , 100.0% for Black residents , 100.0% for American Indian residents )Business Search - 14 Million verified businesses
Data:
Median household income ($)
Median household income (% change since 2000)
Household income diversity
Ratio of average income to average house value (%)
Ratio of average income to average rent
Median household income ($) - White
Median household income ($) - Black or African American
Median household income ($) - Asian
Median household income ($) - Hispanic or Latino
Median household income ($) - American Indian and Alaska Native
Median household income ($) - Multirace
Median household income ($) - Other Race
Median household income for houses/condos with a mortgage ($)
Median household income for apartments without a mortgage ($)
Races - White alone (%)
Races - White alone (% change since 2000)
Races - Black alone (%)
Races - Black alone (% change since 2000)
Races - American Indian alone (%)
Races - American Indian alone (% change since 2000)
Races - Asian alone (%)
Races - Asian alone (% change since 2000)
Races - Hispanic (%)
Races - Hispanic (% change since 2000)
Races - Native Hawaiian and Other Pacific Islander alone (%)
Races - Native Hawaiian and Other Pacific Islander alone (% change since 2000)
Races - Two or more races (%)
Races - Two or more races (% change since 2000)
Races - Other race alone (%)
Races - Other race alone (% change since 2000)
Racial diversity
Unemployment (%)
Unemployment (% change since 2000)
Unemployment (%) - White
Unemployment (%) - Black or African American
Unemployment (%) - Asian
Unemployment (%) - Hispanic or Latino
Unemployment (%) - American Indian and Alaska Native
Unemployment (%) - Multirace
Unemployment (%) - Other Race
Population density (people per square mile)
Population - Males (%)
Population - Females (%)
Population - Males (%) - White
Population - Males (%) - Black or African American
Population - Males (%) - Asian
Population - Males (%) - Hispanic or Latino
Population - Males (%) - American Indian and Alaska Native
Population - Males (%) - Multirace
Population - Males (%) - Other Race
Population - Females (%) - White
Population - Females (%) - Black or African American
Population - Females (%) - Asian
Population - Females (%) - Hispanic or Latino
Population - Females (%) - American Indian and Alaska Native
Population - Females (%) - Multirace
Population - Females (%) - Other Race
Coronavirus confirmed cases (Apr 27, 2024)
Deaths caused by coronavirus (Apr 27, 2024)
Coronavirus confirmed cases (per 100k population) (Apr 27, 2024)
Deaths caused by coronavirus (per 100k population) (Apr 27, 2024)
Daily increase in number of cases (Apr 27, 2024)
Weekly increase in number of cases (Apr 27, 2024)
Cases doubled (in days) (Apr 27, 2024)
Hospitalized patients (Apr 18, 2022)
Negative test results (Apr 18, 2022)
Total test results (Apr 18, 2022)
COVID Vaccine doses distributed (per 100k population) (Sep 19, 2023)
COVID Vaccine doses administered (per 100k population) (Sep 19, 2023)
COVID Vaccine doses distributed (Sep 19, 2023)
COVID Vaccine doses administered (Sep 19, 2023)
Likely homosexual households (%)
Likely homosexual households (% change since 2000)
Likely homosexual households - Lesbian couples (%)
Likely homosexual households - Lesbian couples (% change since 2000)
Likely homosexual households - Gay men (%)
Likely homosexual households - Gay men (% change since 2000)
Cost of living index
Median gross rent ($)
Median contract rent ($)
Median monthly housing costs ($)
Median house or condo value ($)
Median house or condo value ($ change since 2000)
Mean house or condo value by units in structure - 1, detached ($)
Mean house or condo value by units in structure - 1, attached ($)
Mean house or condo value by units in structure - 2 ($)
Mean house or condo value by units in structure by units in structure - 3 or 4 ($)
Mean house or condo value by units in structure - 5 or more ($)
Mean house or condo value by units in structure - Boat, RV, van, etc. ($)
Mean house or condo value by units in structure - Mobile home ($)
Median house or condo value ($) - White
Median house or condo value ($) - Black or African American
Median house or condo value ($) - Asian
Median house or condo value ($) - Hispanic or Latino
Median house or condo value ($) - American Indian and Alaska Native
Median house or condo value ($) - Multirace
Median house or condo value ($) - Other Race
Median resident age
Resident age diversity
Median resident age - Males
Median resident age - Females
Median resident age - White
Median resident age - Black or African American
Median resident age - Asian
Median resident age - Hispanic or Latino
Median resident age - American Indian and Alaska Native
Median resident age - Multirace
Median resident age - Other Race
Median resident age - Males - White
Median resident age - Males - Black or African American
Median resident age - Males - Asian
Median resident age - Males - Hispanic or Latino
Median resident age - Males - American Indian and Alaska Native
Median resident age - Males - Multirace
Median resident age - Males - Other Race
Median resident age - Females - White
Median resident age - Females - Black or African American
Median resident age - Females - Asian
Median resident age - Females - Hispanic or Latino
Median resident age - Females - American Indian and Alaska Native
Median resident age - Females - Multirace
Median resident age - Females - Other Race
Commute - mean travel time to work (minutes)
Travel time to work - Less than 5 minutes (%)
Travel time to work - Less than 5 minutes (% change since 2000)
Travel time to work - 5 to 9 minutes (%)
Travel time to work - 5 to 9 minutes (% change since 2000)
Travel time to work - 10 to 19 minutes (%)
Travel time to work - 10 to 19 minutes (% change since 2000)
Travel time to work - 20 to 29 minutes (%)
Travel time to work - 20 to 29 minutes (% change since 2000)
Travel time to work - 30 to 39 minutes (%)
Travel time to work - 30 to 39 minutes (% change since 2000)
Travel time to work - 40 to 59 minutes (%)
Travel time to work - 40 to 59 minutes (% change since 2000)
Travel time to work - 60 to 89 minutes (%)
Travel time to work - 60 to 89 minutes (% change since 2000)
Travel time to work - 90 or more minutes (%)
Travel time to work - 90 or more minutes (% change since 2000)
Marital status - Never married (%)
Marital status - Now married (%)
Marital status - Separated (%)
Marital status - Widowed (%)
Marital status - Divorced (%)
Median family income ($)
Median family income (% change since 2000)
Median non-family income ($)
Median non-family income (% change since 2000)
Median per capita income ($)
Median per capita income (% change since 2000)
Median family income ($) - White
Median family income ($) - Black or African American
Median family income ($) - Asian
Median family income ($) - Hispanic or Latino
Median family income ($) - American Indian and Alaska Native
Median family income ($) - Multirace
Median family income ($) - Other Race
Median year house/condo built
Median year apartment built
Year house built - Built 2005 or later (%)
Year house built - Built 2000 to 2004 (%)
Year house built - Built 1990 to 1999 (%)
Year house built - Built 1980 to 1989 (%)
Year house built - Built 1970 to 1979 (%)
Year house built - Built 1960 to 1969 (%)
Year house built - Built 1950 to 1959 (%)
Year house built - Built 1940 to 1949 (%)
Year house built - Built 1939 or earlier (%)
Average household size
Household density (households per square mile)
Average household size - White
Average household size - Black or African American
Average household size - Asian
Average household size - Hispanic or Latino
Average household size - American Indian and Alaska Native
Average household size - Multirace
Average household size - Other Race
Occupied housing units (%)
Vacant housing units (%)
Owner occupied housing units (%)
Renter occupied housing units (%)
Vacancy status - For rent (%)
Vacancy status - For sale only (%)
Vacancy status - Rented or sold, not occupied (%)
Vacancy status - For seasonal, recreational, or occasional use (%)
Vacancy status - For migrant workers (%)
Vacancy status - Other vacant (%)
Residents with income below the poverty level (%)
Residents with income below 50% of the poverty level (%)
Children below poverty level (%)
Poor families by family type - Married-couple family (%)
Poor families by family type - Male, no wife present (%)
Poor families by family type - Female, no husband present (%)
Poverty status for native-born residents (%)
Poverty status for foreign-born residents (%)
Poverty among high school graduates not in families (%)
Poverty among people who did not graduate high school not in families (%)
Residents with income below the poverty level (%) - White
Residents with income below the poverty level (%) - Black or African American
Residents with income below the poverty level (%) - Asian
Residents with income below the poverty level (%) - Hispanic or Latino
Residents with income below the poverty level (%) - American Indian and Alaska Native
Residents with income below the poverty level (%) - Multirace
Residents with income below the poverty level (%) - Other Race
Air pollution - Air Quality Index (AQI)
Air pollution - CO
Air pollution - NO2
Air pollution - SO2
Air pollution - Ozone
Air pollution - PM10
Air pollution - PM25
Air pollution - Pb
Crime - Murders per 100,000 population
Crime - Rapes per 100,000 population
Crime - Robberies per 100,000 population
Crime - Assaults per 100,000 population
Crime - Burglaries per 100,000 population
Crime - Thefts per 100,000 population
Crime - Auto thefts per 100,000 population
Crime - Arson per 100,000 population
Crime - City-data.com crime index
Crime - Violent crime index
Crime - Property crime index
Crime - Murders per 100,000 population (5 year average)
Crime - Rapes per 100,000 population (5 year average)
Crime - Robberies per 100,000 population (5 year average)
Crime - Assaults per 100,000 population (5 year average)
Crime - Burglaries per 100,000 population (5 year average)
Crime - Thefts per 100,000 population (5 year average)
Crime - Auto thefts per 100,000 population (5 year average)
Crime - Arson per 100,000 population (5 year average)
Crime - City-data.com crime index (5 year average)
Crime - Violent crime index (5 year average)
Crime - Property crime index (5 year average)
1996 Presidential Elections Results (%) - Democratic Party (Clinton)
1996 Presidential Elections Results (%) - Republican Party (Dole)
1996 Presidential Elections Results (%) - Other
2000 Presidential Elections Results (%) - Democratic Party (Gore)
2000 Presidential Elections Results (%) - Republican Party (Bush)
2000 Presidential Elections Results (%) - Other
2004 Presidential Elections Results (%) - Democratic Party (Kerry)
2004 Presidential Elections Results (%) - Republican Party (Bush)
2004 Presidential Elections Results (%) - Other
2008 Presidential Elections Results (%) - Democratic Party (Obama)
2008 Presidential Elections Results (%) - Republican Party (McCain)
2008 Presidential Elections Results (%) - Other
2012 Presidential Elections Results (%) - Democratic Party (Obama)
2012 Presidential Elections Results (%) - Republican Party (Romney)
2012 Presidential Elections Results (%) - Other
2016 Presidential Elections Results (%) - Democratic Party (Clinton)
2016 Presidential Elections Results (%) - Republican Party (Trump)
2016 Presidential Elections Results (%) - Other
2020 Presidential Elections Results (%) - Democratic Party (Biden)
2020 Presidential Elections Results (%) - Republican Party (Trump)
2020 Presidential Elections Results (%) - Other
Ancestries Reported - Arab (%)
Ancestries Reported - Czech (%)
Ancestries Reported - Danish (%)
Ancestries Reported - Dutch (%)
Ancestries Reported - English (%)
Ancestries Reported - French (%)
Ancestries Reported - French Canadian (%)
Ancestries Reported - German (%)
Ancestries Reported - Greek (%)
Ancestries Reported - Hungarian (%)
Ancestries Reported - Irish (%)
Ancestries Reported - Italian (%)
Ancestries Reported - Lithuanian (%)
Ancestries Reported - Norwegian (%)
Ancestries Reported - Polish (%)
Ancestries Reported - Portuguese (%)
Ancestries Reported - Russian (%)
Ancestries Reported - Scotch-Irish (%)
Ancestries Reported - Scottish (%)
Ancestries Reported - Slovak (%)
Ancestries Reported - Subsaharan African (%)
Ancestries Reported - Swedish (%)
Ancestries Reported - Swiss (%)
Ancestries Reported - Ukrainian (%)
Ancestries Reported - United States (%)
Ancestries Reported - Welsh (%)
Ancestries Reported - West Indian (%)
Ancestries Reported - Other (%)
Educational Attainment - No schooling completed (%)
Educational Attainment - Less than high school (%)
Educational Attainment - High school or equivalent (%)
Educational Attainment - Less than 1 year of college (%)
Educational Attainment - 1 or more years of college (%)
Educational Attainment - Associate degree (%)
Educational Attainment - Bachelor's degree (%)
Educational Attainment - Master's degree (%)
Educational Attainment - Professional school degree (%)
Educational Attainment - Doctorate degree (%)
School Enrollment - Nursery, preschool (%)
School Enrollment - Kindergarten (%)
School Enrollment - Grade 1 to 4 (%)
School Enrollment - Grade 5 to 8 (%)
School Enrollment - Grade 9 to 12 (%)
School Enrollment - College undergrad (%)
School Enrollment - Graduate or professional (%)
School Enrollment - Not enrolled in school (%)
School enrollment - Public schools (%)
School enrollment - Private schools (%)
School enrollment - Not enrolled (%)
Median number of rooms in houses and condos
Median number of rooms in apartments
Housing units lacking complete plumbing facilities (%)
Housing units lacking complete kitchen facilities (%)
Density of houses
Urban houses (%)
Rural houses (%)
Households with people 60 years and over (%)
Households with people 65 years and over (%)
Households with people 75 years and over (%)
Households with one or more nonrelatives (%)
Households with no nonrelatives (%)
Population in households (%)
Family households (%)
Nonfamily households (%)
Population in families (%)
Family households with own children (%)
Median number of bedrooms in owner occupied houses
Mean number of bedrooms in owner occupied houses
Median number of bedrooms in renter occupied houses
Mean number of bedrooms in renter occupied houses
Median number of vehichles in owner occupied houses
Mean number of vehichles in owner occupied houses
Median number of vehichles in renter occupied houses
Mean number of vehichles in renter occupied houses
Mortgage status - with mortgage (%)
Mortgage status - with second mortgage (%)
Mortgage status - with home equity loan (%)
Mortgage status - with both second mortgage and home equity loan (%)
Mortgage status - without a mortgage (%)
Average family size
Average family size - White
Average family size - Black or African American
Average family size - Asian
Average family size - Hispanic or Latino
Average family size - American Indian and Alaska Native
Average family size - Multirace
Average family size - Other Race
Geographical mobility - Same house 1 year ago (%)
Geographical mobility - Moved within same county (%)
Geographical mobility - Moved from different county within same state (%)
Geographical mobility - Moved from different state (%)
Geographical mobility - Moved from abroad (%)
Place of birth - Born in state of residence (%)
Place of birth - Born in other state (%)
Place of birth - Native, outside of US (%)
Place of birth - Foreign born (%)
Housing units in structures - 1, detached (%)
Housing units in structures - 1, attached (%)
Housing units in structures - 2 (%)
Housing units in structures - 3 or 4 (%)
Housing units in structures - 5 to 9 (%)
Housing units in structures - 10 to 19 (%)
Housing units in structures - 20 to 49 (%)
Housing units in structures - 50 or more (%)
Housing units in structures - Mobile home (%)
Housing units in structures - Boat, RV, van, etc. (%)
House/condo owner moved in on average (years ago)
Renter moved in on average (years ago)
Year householder moved into unit - Moved in 1999 to March 2000 (%)
Year householder moved into unit - Moved in 1995 to 1998 (%)
Year householder moved into unit - Moved in 1990 to 1994 (%)
Year householder moved into unit - Moved in 1980 to 1989 (%)
Year householder moved into unit - Moved in 1970 to 1979 (%)
Year householder moved into unit - Moved in 1969 or earlier (%)
Means of transportation to work - Drove car alone (%)
Means of transportation to work - Carpooled (%)
Means of transportation to work - Public transportation (%)
Means of transportation to work - Bus or trolley bus (%)
Means of transportation to work - Streetcar or trolley car (%)
Means of transportation to work - Subway or elevated (%)
Means of transportation to work - Railroad (%)
Means of transportation to work - Ferryboat (%)
Means of transportation to work - Taxicab (%)
Means of transportation to work - Motorcycle (%)
Means of transportation to work - Bicycle (%)
Means of transportation to work - Walked (%)
Means of transportation to work - Other means (%)
Working at home (%)
Industry diversity
Most Common Industries - Agriculture, forestry, fishing and hunting, and mining (%)
Most Common Industries - Agriculture, forestry, fishing and hunting (%)
Most Common Industries - Mining, quarrying, and oil and gas extraction (%)
Most Common Industries - Construction (%)
Most Common Industries - Manufacturing (%)
Most Common Industries - Wholesale trade (%)
Most Common Industries - Retail trade (%)
Most Common Industries - Transportation and warehousing, and utilities (%)
Most Common Industries - Transportation and warehousing (%)
Most Common Industries - Utilities (%)
Most Common Industries - Information (%)
Most Common Industries - Finance and insurance, and real estate and rental and leasing (%)
Most Common Industries - Finance and insurance (%)
Most Common Industries - Real estate and rental and leasing (%)
Most Common Industries - Professional, scientific, and management, and administrative and waste management services (%)
Most Common Industries - Professional, scientific, and technical services (%)
Most Common Industries - Management of companies and enterprises (%)
Most Common Industries - Administrative and support and waste management services (%)
Most Common Industries - Educational services, and health care and social assistance (%)
Most Common Industries - Educational services (%)
Most Common Industries - Health care and social assistance (%)
Most Common Industries - Arts, entertainment, and recreation, and accommodation and food services (%)
Most Common Industries - Arts, entertainment, and recreation (%)
Most Common Industries - Accommodation and food services (%)
Most Common Industries - Other services, except public administration (%)
Most Common Industries - Public administration (%)
Occupation diversity
Most Common Occupations - Management, business, science, and arts occupations (%)
Most Common Occupations - Management, business, and financial occupations (%)
Most Common Occupations - Management occupations (%)
Most Common Occupations - Business and financial operations occupations (%)
Most Common Occupations - Computer, engineering, and science occupations (%)
Most Common Occupations - Computer and mathematical occupations (%)
Most Common Occupations - Architecture and engineering occupations (%)
Most Common Occupations - Life, physical, and social science occupations (%)
Most Common Occupations - Education, legal, community service, arts, and media occupations (%)
Most Common Occupations - Community and social service occupations (%)
Most Common Occupations - Legal occupations (%)
Most Common Occupations - Education, training, and library occupations (%)
Most Common Occupations - Arts, design, entertainment, sports, and media occupations (%)
Most Common Occupations - Healthcare practitioners and technical occupations (%)
Most Common Occupations - Health diagnosing and treating practitioners and other technical occupations (%)
Most Common Occupations - Health technologists and technicians (%)
Most Common Occupations - Service occupations (%)
Most Common Occupations - Healthcare support occupations (%)
Most Common Occupations - Protective service occupations (%)
Most Common Occupations - Fire fighting and prevention, and other protective service workers including supervisors (%)
Most Common Occupations - Law enforcement workers including supervisors (%)
Most Common Occupations - Food preparation and serving related occupations (%)
Most Common Occupations - Building and grounds cleaning and maintenance occupations (%)
Most Common Occupations - Personal care and service occupations (%)
Most Common Occupations - Sales and office occupations (%)
Most Common Occupations - Sales and related occupations (%)
Most Common Occupations - Office and administrative support occupations (%)
Most Common Occupations - Natural resources, construction, and maintenance occupations (%)
Most Common Occupations - Farming, fishing, and forestry occupations (%)
Most Common Occupations - Construction and extraction occupations (%)
Most Common Occupations - Installation, maintenance, and repair occupations (%)
Most Common Occupations - Production, transportation, and material moving occupations (%)
Most Common Occupations - Production occupations (%)
Most Common Occupations - Transportation occupations (%)
Most Common Occupations - Material moving occupations (%)
People in Group quarters - Institutionalized population (%)
People in Group quarters - Correctional institutions (%)
People in Group quarters - Federal prisons and detention centers (%)
People in Group quarters - Halfway houses (%)
People in Group quarters - Local jails and other confinement facilities (including police lockups) (%)
People in Group quarters - Military disciplinary barracks (%)
People in Group quarters - State prisons (%)
People in Group quarters - Other types of correctional institutions (%)
People in Group quarters - Nursing homes (%)
People in Group quarters - Hospitals/wards, hospices, and schools for the handicapped (%)
People in Group quarters - Hospitals/wards and hospices for chronically ill (%)
People in Group quarters - Hospices or homes for chronically ill (%)
People in Group quarters - Military hospitals or wards for chronically ill (%)
People in Group quarters - Other hospitals or wards for chronically ill (%)
People in Group quarters - Hospitals or wards for drug/alcohol abuse (%)
People in Group quarters - Mental (Psychiatric) hospitals or wards (%)
People in Group quarters - Schools, hospitals, or wards for the mentally retarded (%)
People in Group quarters - Schools, hospitals, or wards for the physically handicapped (%)
People in Group quarters - Institutions for the deaf (%)
People in Group quarters - Institutions for the blind (%)
People in Group quarters - Orthopedic wards and institutions for the physically handicapped (%)
People in Group quarters - Wards in general hospitals for patients who have no usual home elsewhere (%)
People in Group quarters - Wards in military hospitals for patients who have no usual home elsewhere (%)
People in Group quarters - Juvenile institutions (%)
People in Group quarters - Long-term care (%)
People in Group quarters - Homes for abused, dependent, and neglected children (%)
People in Group quarters - Residential treatment centers for emotionally disturbed children (%)
People in Group quarters - Training schools for juvenile delinquents (%)
People in Group quarters - Short-term care, detention or diagnostic centers for delinquent children (%)
People in Group quarters - Type of juvenile institution unknown (%)
People in Group quarters - Noninstitutionalized population (%)
People in Group quarters - College dormitories (includes college quarters off campus) (%)
People in Group quarters - Military quarters (%)
People in Group quarters - On base (%)
People in Group quarters - Barracks, unaccompanied personnel housing (UPH), (Enlisted/Officer), ;and similar group living quarters for military personnel (%)
People in Group quarters - Transient quarters for temporary residents (%)
People in Group quarters - Military ships (%)
People in Group quarters - Group homes (%)
People in Group quarters - Homes or halfway houses for drug/alcohol abuse (%)
People in Group quarters - Homes for the mentally ill (%)
People in Group quarters - Homes for the mentally retarded (%)
People in Group quarters - Homes for the physically handicapped (%)
People in Group quarters - Other group homes (%)
People in Group quarters - Religious group quarters (%)
People in Group quarters - Dormitories (%)
People in Group quarters - Agriculture workers' dormitories on farms (%)
People in Group quarters - Job Corps and vocational training facilities (%)
People in Group quarters - Other workers' dormitories (%)
People in Group quarters - Crews of maritime vessels (%)
People in Group quarters - Other nonhousehold living situations (%)
People in Group quarters - Other noninstitutional group quarters (%)
Residents speaking English at home (%)
Residents speaking English at home - Born in the United States (%)
Residents speaking English at home - Native, born elsewhere (%)
Residents speaking English at home - Foreign born (%)
Residents speaking Spanish at home (%)
Residents speaking Spanish at home - Born in the United States (%)
Residents speaking Spanish at home - Native, born elsewhere (%)
Residents speaking Spanish at home - Foreign born (%)
Residents speaking other language at home (%)
Residents speaking other language at home - Born in the United States (%)
Residents speaking other language at home - Native, born elsewhere (%)
Residents speaking other language at home - Foreign born (%)
Class of Workers - Employee of private company (%)
Class of Workers - Self-employed in own incorporated business (%)
Class of Workers - Private not-for-profit wage and salary workers (%)
Class of Workers - Local government workers (%)
Class of Workers - State government workers (%)
Class of Workers - Federal government workers (%)
Class of Workers - Self-employed workers in own not incorporated business and Unpaid family workers (%)
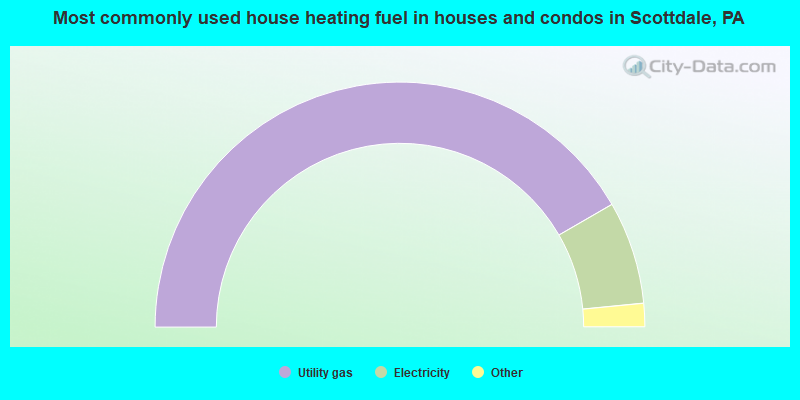
House heating fuel used in houses and condos - Utility gas (%)
House heating fuel used in houses and condos - Bottled, tank, or LP gas (%)
House heating fuel used in houses and condos - Electricity (%)
House heating fuel used in houses and condos - Fuel oil, kerosene, etc. (%)
House heating fuel used in houses and condos - Coal or coke (%)
House heating fuel used in houses and condos - Wood (%)
House heating fuel used in houses and condos - Solar energy (%)
House heating fuel used in houses and condos - Other fuel (%)
House heating fuel used in houses and condos - No fuel used (%)
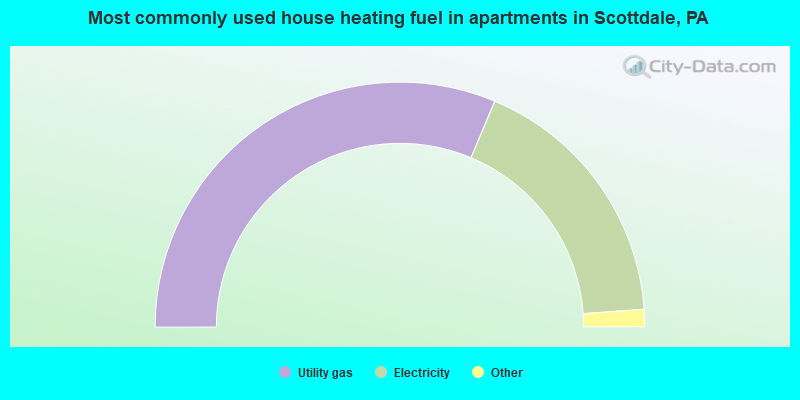
House heating fuel used in apartments - Utility gas (%)
House heating fuel used in apartments - Bottled, tank, or LP gas (%)
House heating fuel used in apartments - Electricity (%)
House heating fuel used in apartments - Fuel oil, kerosene, etc. (%)
House heating fuel used in apartments - Coal or coke (%)
House heating fuel used in apartments - Wood (%)
House heating fuel used in apartments - Solar energy (%)
House heating fuel used in apartments - Other fuel (%)
House heating fuel used in apartments - No fuel used (%)
Armed forces status - In Armed Forces (%)
Armed forces status - Civilian (%)
Armed forces status - Civilian - Veteran (%)
Armed forces status - Civilian - Nonveteran (%)
Fatal accidents locations in years 2005-2021
Fatal accidents locations in 2005
Fatal accidents locations in 2006
Fatal accidents locations in 2007
Fatal accidents locations in 2008
Fatal accidents locations in 2009
Fatal accidents locations in 2010
Fatal accidents locations in 2011
Fatal accidents locations in 2012
Fatal accidents locations in 2013
Fatal accidents locations in 2014
Fatal accidents locations in 2015
Fatal accidents locations in 2016
Fatal accidents locations in 2017
Fatal accidents locations in 2018
Fatal accidents locations in 2019
Fatal accidents locations in 2020
Fatal accidents locations in 2021
Alcohol use - People drinking some alcohol every month (%)
Alcohol use - People not drinking at all (%)
Alcohol use - Average days/month drinking alcohol
Alcohol use - Average drinks/week
Alcohol use - Average days/year people drink much
Audiometry - Average condition of hearing (%)
Audiometry - People that can hear a whisper from across a quiet room (%)
Audiometry - People that can hear normal voice from across a quiet room (%)
Audiometry - Ears ringing, roaring, buzzing (%)
Audiometry - Had a job exposure to loud noise (%)
Audiometry - Had off-work exposure to loud noise (%)
Blood Pressure & Cholesterol - Has high blood pressure (%)
Blood Pressure & Cholesterol - Checking blood pressure at home (%)
Blood Pressure & Cholesterol - Frequently checking blood cholesterol (%)
Blood Pressure & Cholesterol - Has high cholesterol level (%)
Consumer Behavior - Money monthly spent on food at supermarket/grocery store
Consumer Behavior - Money monthly spent on food at other stores
Consumer Behavior - Money monthly spent on eating out
Consumer Behavior - Money monthly spent on carryout/delivered foods
Consumer Behavior - Income spent on food at supermarket/grocery store (%)
Consumer Behavior - Income spent on food at other stores (%)
Consumer Behavior - Income spent on eating out (%)
Consumer Behavior - Income spent on carryout/delivered foods (%)
Current Health Status - General health condition (%)
Current Health Status - Blood donors (%)
Current Health Status - Has blood ever tested for HIV virus (%)
Current Health Status - Left-handed people (%)
Dermatology - People using sunscreen (%)
Diabetes - Diabetics (%)
Diabetes - Had a blood test for high blood sugar (%)
Diabetes - People taking insulin (%)
Diet Behavior & Nutrition - Diet health (%)
Diet Behavior & Nutrition - Milk product consumption (# of products/month)
Diet Behavior & Nutrition - Meals not home prepared (#/week)
Diet Behavior & Nutrition - Meals from fast food or pizza place (#/week)
Diet Behavior & Nutrition - Ready-to-eat foods (#/month)
Diet Behavior & Nutrition - Frozen meals/pizza (#/month)
Drug Use - People that ever used marijuana or hashish (%)
Drug Use - Ever used hard drugs (%)
Drug Use - Ever used any form of cocaine (%)
Drug Use - Ever used heroin (%)
Drug Use - Ever used methamphetamine (%)
Health Insurance - People covered by health insurance (%)
Kidney Conditions-Urology - Avg. # of times urinating at night
Medical Conditions - People with asthma (%)
Medical Conditions - People with anemia (%)
Medical Conditions - People with psoriasis (%)
Medical Conditions - People with overweight (%)
Medical Conditions - Elderly people having difficulties in thinking or remembering (%)
Medical Conditions - People who ever received blood transfusion (%)
Medical Conditions - People having trouble seeing even with glass/contacts (%)
Medical Conditions - People with arthritis (%)
Medical Conditions - People with gout (%)
Medical Conditions - People with congestive heart failure (%)
Medical Conditions - People with coronary heart disease (%)
Medical Conditions - People with angina pectoris (%)
Medical Conditions - People who ever had heart attack (%)
Medical Conditions - People who ever had stroke (%)
Medical Conditions - People with emphysema (%)
Medical Conditions - People with thyroid problem (%)
Medical Conditions - People with chronic bronchitis (%)
Medical Conditions - People with any liver condition (%)
Medical Conditions - People who ever had cancer or malignancy (%)
Mental Health - People who have little interest in doing things (%)
Mental Health - People feeling down, depressed, or hopeless (%)
Mental Health - People who have trouble sleeping or sleeping too much (%)
Mental Health - People feeling tired or having little energy (%)
Mental Health - People with poor appetite or overeating (%)
Mental Health - People feeling bad about themself (%)
Mental Health - People who have trouble concentrating on things (%)
Mental Health - People moving or speaking slowly or too fast (%)
Mental Health - People having thoughts they would be better off dead (%)
Oral Health - Average years since last visit a dentist
Oral Health - People embarrassed because of mouth (%)
Oral Health - People with gum disease (%)
Oral Health - General health of teeth and gums (%)
Oral Health - Average days a week using dental floss/device
Oral Health - Average days a week using mouthwash for dental problem
Oral Health - Average number of teeth
Pesticide Use - Households using pesticides to control insects (%)
Pesticide Use - Households using pesticides to kill weeds (%)
Physical Activity - People doing vigorous-intensity work activities (%)
Physical Activity - People doing moderate-intensity work activities (%)
Physical Activity - People walking or bicycling (%)
Physical Activity - People doing vigorous-intensity recreational activities (%)
Physical Activity - People doing moderate-intensity recreational activities (%)
Physical Activity - Average hours a day doing sedentary activities
Physical Activity - Average hours a day watching TV or videos
Physical Activity - Average hours a day using computer
Physical Functioning - People having limitations keeping them from working (%)
Physical Functioning - People limited in amount of work they can do (%)
Physical Functioning - People that need special equipment to walk (%)
Physical Functioning - People experiencing confusion/memory problems (%)
Physical Functioning - People requiring special healthcare equipment (%)
Prescription Medications - Average number of prescription medicines taking
Preventive Aspirin Use - Adults 40+ taking low-dose aspirin (%)
Reproductive Health - Vaginal deliveries (%)
Reproductive Health - Cesarean deliveries (%)
Reproductive Health - Deliveries resulted in a live birth (%)
Reproductive Health - Pregnancies resulted in a delivery (%)
Reproductive Health - Women breastfeeding newborns (%)
Reproductive Health - Women that had a hysterectomy (%)
Reproductive Health - Women that had both ovaries removed (%)
Reproductive Health - Women that have ever taken birth control pills (%)
Reproductive Health - Women taking birth control pills (%)
Reproductive Health - Women that have ever used Depo-Provera or injectables (%)
Reproductive Health - Women that have ever used female hormones (%)
Sexual Behavior - People 18+ that ever had sex (vaginal, anal, or oral) (%)
Sexual Behavior - Males 18+ that ever had vaginal sex with a woman (%)
Sexual Behavior - Males 18+ that ever performed oral sex on a woman (%)
Sexual Behavior - Males 18+ that ever had anal sex with a woman (%)
Sexual Behavior - Males 18+ that ever had any sex with a man (%)
Sexual Behavior - Females 18+ that ever had vaginal sex with a man (%)
Sexual Behavior - Females 18+ that ever performed oral sex on a man (%)
Sexual Behavior - Females 18+ that ever had anal sex with a man (%)
Sexual Behavior - Females 18+ that ever had any kind of sex with a woman (%)
Sexual Behavior - Average age people first had sex
Sexual Behavior - Average number of female sex partners in lifetime (males 18+)
Sexual Behavior - Average number of female vaginal sex partners in lifetime (males 18+)
Sexual Behavior - Average age people first performed oral sex on a woman (18+)
Sexual Behavior - Average number of woman performed oral sex on in lifetime (18+)
Sexual Behavior - Average number of male sex partners in lifetime (males 18+)
Sexual Behavior - Average number of male anal sex partners in lifetime (males 18+)
Sexual Behavior - Average age people first performed oral sex on a man (18+)
Sexual Behavior - Average number of male oral sex partners in lifetime (18+)
Sexual Behavior - People using protection when performing oral sex (%)
Sexual Behavior - Average number of times people have vaginal or anal sex a year
Sexual Behavior - People having sex without condom (%)
Sexual Behavior - Average number of male sex partners in lifetime (females 18+)
Sexual Behavior - Average number of male vaginal sex partners in lifetime (females 18+)
Sexual Behavior - Average number of female sex partners in lifetime (females 18+)
Sexual Behavior - Circumcised males 18+ (%)
Sleep Disorders - Average hours sleeping at night
Sleep Disorders - People that has trouble sleeping (%)
Smoking-Cigarette Use - People smoking cigarettes (%)
Taste & Smell - People 40+ having problems with smell (%)
Taste & Smell - People 40+ having problems with taste (%)
Taste & Smell - People 40+ that ever had wisdom teeth removed (%)
Taste & Smell - People 40+ that ever had tonsils teeth removed (%)
Taste & Smell - People 40+ that ever had a loss of consciousness because of a head injury (%)
Taste & Smell - People 40+ that ever had a broken nose or other serious injury to face or skull (%)
Taste & Smell - People 40+ that ever had two or more sinus infections (%)
Weight - Average height (inches)
Weight - Average weight (pounds)
Weight - Average BMI
Weight - People that are obese (%)
Weight - People that ever were obese (%)
Weight - People trying to lose weight (%)
Officers per 1,000 residents here:
1.48Pennsylvania average:
2.70
Latest news from Scottdale, PA collected exclusively by city-data.com from local newspapers, TV, and radio stations
Ancestries: German (28.8%), American (16.6%), Slovak (9.3%), Polish (9.0%), Irish (8.4%), Italian (8.1%).
Current Local Time:
Land area: 1.17 square miles.
Population density: 3,739 people per square mile (average).
94 residents are foreign born (1.5% Asia , 0.5% Europe ).
This borough:
2.2%Pennsylvania:
7.3%
Median real estate property taxes paid for housing units with mortgages in 2022: $1,443 (0.9%)Median real estate property taxes paid for housing units with no mortgage in 2022: $1,605 (1.2%)
Nearest city with pop. 50,000+: Pittsburgh, PA
Nearest city with pop. 1,000,000+: Philadelphia, PA
Nearest cities:
Latitude: 40.10 N, Longitude: 79.59 W
Unemployment in December 2023: Here:
3.0%Pennsylvania:
2.9%
Most common industries in Scottdale, PA (%)
Both Males Females
Health care (9.5%)
Educational services (8.0%)
Construction (5.9%)
Accommodation & food services (5.0%)
Metal & metal products (4.9%)
Publishing, motion picture & sound recording industries (4.9%)
Finance & insurance (3.6%)
Metal & metal products (8.8%)
Construction (7.9%)
Nonmetallic mineral products (5.8%)
Educational services (5.7%)
Publishing, motion picture & sound recording industries (5.3%)
Motor vehicle & parts dealers (4.3%)
Professional, scientific, technical services (4.2%)
Health care (17.1%)
Educational services (10.5%)
Accommodation & food services (8.5%)
Finance & insurance (7.0%)
Publishing, motion picture & sound recording industries (4.4%)
Religious, grantmaking, civic, professional, similar organizations (4.4%)
Construction (3.6%)
Most common occupations in Scottdale, PA (%)
Both Males Females
Laborers and material movers, hand (5.4%)
Other production occupations, including supervisors (5.2%)
Material recording, scheduling, dispatching, and distributing workers (5.0%)
Building and grounds cleaning and maintenance occupations (4.0%)
Other sales and related occupations, including supervisors (3.9%)
Preschool, kindergarten, elementary, and middle school teachers (3.6%)
Driver/sales workers and truck drivers (3.6%)
Laborers and material movers, hand (8.6%)
Other production occupations, including supervisors (7.6%)
Driver/sales workers and truck drivers (6.2%)
Material recording, scheduling, dispatching, and distributing workers (6.0%)
Vehicle and mobile equipment mechanics, installers, and repairers (5.3%)
Metal workers and plastic workers (5.2%)
Electrical equipment mechanics and other installation, maintenance, and repair workers, including supervisors (5.0%)
Preschool, kindergarten, elementary, and middle school teachers (6.7%)
Secretaries and administrative assistants (6.3%)
Customer service representatives (5.3%)
Cashiers (5.0%)
Building and grounds cleaning and maintenance occupations (4.3%)
Other office and administrative support workers, including supervisors (4.1%)
Health technologists and technicians (4.0%)
Tornado activity:
Scottdale-area historical tornado activity is slightly below Pennsylvania state average. It is 35% smaller than the overall U.S. average.
On 6/2/1998, a category F4 (max. wind speeds 207-260 mph) tornado 20.0 miles away from the Scottdale borough center injured 5 people and caused $6 million in damages.
On 6/3/1980, a category F4 tornado 33.4 miles away from the borough center injured 140 people and caused between $50,000,000 and $500,000,000 in damages.
Earthquake activity:
Scottdale-area historical earthquake activity is significantly above Pennsylvania state average. It is 49% smaller than the overall U.S. average. On 8/23/2011 at 17:51:04, a magnitude 5.8 (5.8 MW, Depth: 3.7 mi, Class: Moderate, Intensity: VI - VII) earthquake occurred 175.8 miles away from Scottdale center On 9/25/1998 at 19:52:52, a magnitude 5.2 (4.8 MB, 4.3 MS, 5.2 LG, 4.5 MW, Depth: 3.1 mi) earthquake occurred 104.9 miles away from Scottdale center On 1/31/1986 at 16:46:43, a magnitude 5.0 (5.0 MB) earthquake occurred 132.3 miles away from Scottdale center On 7/27/1980 at 18:52:21, a magnitude 5.2 (5.1 MB, 4.7 MS, 5.0 UK, 5.2 UK) earthquake occurred 267.7 miles away from Scottdale center On 8/9/2020 at 12:07:37, a magnitude 5.1 (5.1 MW, Depth: 4.7 mi) earthquake occurred 263.8 miles away from Scottdale center On 1/16/1994 at 01:49:16, a magnitude 4.6 (4.6 MB, 4.6 LG, Depth: 3.1 mi, Class: Light, Intensity: IV - V) earthquake occurred 188.4 miles away from the city center Magnitude types: regional Lg-wave magnitude (LG), body-wave magnitude (MB), surface-wave magnitude (MS), moment magnitude (MW) Natural disasters: The number of natural disasters in Westmoreland County (17) is near the US average (15).Major Disasters (Presidential) Declared: 12Emergencies Declared: 5Floods: 5, Snowstorms: 4, Storms: 4, Winter Storms: 4, Hurricanes: 2, Blizzard: 1, Snowfall: 1, Tropical Depression: 1, Tropical Storm: 1, Other: 1 (Note: some incidents may be assigned to more than one category). Hospitals and medical centers in Scottdale: SCOTTDALE MANOR REHABILITATION (900 PORTER AVENUE)
WESTVIEW NURSING HOME (900 PORTER AVE P O BOX 72)
Other hospitals and medical centers near Scottdale: HARMON HOUSE CARE CENTER (Nursing Home, about 4 miles away; MOUNT PLEASANT, PA)
EXCELA HEALTH FRICK HOSPITAL (about 4 miles away; MOUNT PLEASANT, PA)
FRICK HOSPITAL SNU (Nursing Home, about 4 miles away; MOUNT PLEASANT, PA)
DCI OF MOUNT PLEASANT (Dialysis Facility, about 5 miles away; MOUNT PLEASANT, PA)
HIGHLANDS HOSPITAL (about 6 miles away; CONNELLSVILLE, PA)
HOME HEALTH SRVCS THORNE GROUP (Home Health Center, about 10 miles away; YOUNGWOOD, PA)
VALLEY COMMUNITY SERVS/RUFFSDA (Hospital, about 10 miles away; RUFFS DALE, PA)
Amtrak stations near Scottdale: 6 miles: CONNELLSVILLE (FRONT & WATER STS.) Services: enclosed waiting area, public payphones, free short-term parking, call for taxi service, public transit connection.
15 miles: GREENSBURG (HARRISON AVE.) Services: enclosed waiting area, public payphones, free short-term parking, free long-term parking, call for taxi service.
19 miles: LATROBE (329 KCKINLEY AVE.) Services: enclosed waiting area, public payphones, full-service food facilities, call for taxi service.
Colleges/universities with over 2000 students nearest to Scottdale:
Westmoreland County Community College (about 10 miles; Youngwood, PA ; Full-time enrollment: 4,669)
Seton Hill University (about 15 miles; Greensburg, PA ; FT enrollment: 2,167)
California University of Pennsylvania (about 16 miles; California, PA ; FT enrollment: 7,773)
Carnegie Mellon University (about 31 miles; Pittsburgh, PA ; FT enrollment: 14,186)
University of Pittsburgh-Pittsburgh Campus (about 31 miles; Pittsburgh, PA ; FT enrollment: 27,137)
Wyo Tech-Blairsville (about 31 miles; Blairsville, PA ; FT enrollment: 2,602)
Duquesne University (about 32 miles; Pittsburgh, PA ; FT enrollment: 8,211)
Public elementary/middle schools in Scottdale:
Private elementary/middle school in Scottdale: ST JOHN THE BAPTIST SCHOOL Students: 82, Location: 504 S BROADWAY ST, Grades: PK-8)
See full list of schools located in Scottdale Library in Scottdale: SCOTTDALE PUBLIC LIBRARY Operating income: $149,904; Location: 106 SPRING STREET; 30,772 books ; 881 audio materials ; 702 video materials ; 3 local licensed databases ; 41 state licensed databases ; 1 other licensed databases ; 59 print serial subscriptions )
User-submitted facts and corrections:
Scottdale, Pa is a beautiful town in which to live. Back in the days when Pittsburgh was the steel town of america many wealthy barrons made their home in Scottdale. As a matter of fact Scottdale once had the most millionairs living in one place at one time in the world. Now the millionairs are gone; however, their beautiful large homes remain. It's such a joy just to take a quiet walk down the tree lined slate side walks and admire these homes- many of which are still lived in and maintained.
Notable locations in Scottdale: (A) , Central Day Care Center (B) , Scottdale Public Library (C) , Scottdale Volunteer Fire Department (D) , Scottdale Volunteer Fire Department Main Station (E) , Scottdale Volunteer Fire Department Station 4 (F) . Display/hide their locations on the map
Park in Scottdale: (1) . Display/hide its location on the map
Courts:
Birthplace of: Russ Grimm - Football player and coach, Chris Shipley - Technology writer, James DeWitt Hill - Air mail pilot, Johnny Arthur - Actor, Jack Onslow - Baseball player and coach, Bird Carroll - Football player, Donn Grimm - Football player, Ed Loucks - Football player, Ira S. Webb - Film producer, Jim Heise - Baseball player.
Westmoreland County has a predicted average indoor radon screening level greater than 4 pCi/L (pico curies per liter) - Highest Potential Average household size: This borough:
2.2 peoplePennsylvania:
2.5 people
Percentage of family households: This borough:
61.0%Whole state:
65.0%
Percentage of households with unmarried partners: This borough:
6.2%Whole state:
6.6%
Likely homosexual households (counted as self-reported same-sex unmarried-partner households)
Lesbian couples: 0.4% of all households Gay men: 0.2% of all households
3 people in group homes intended for adults in 2010People in group quarters in Scottdale in 2000:
39 people in nursing homes
37 people in other noninstitutional group quarters
7 people in religious group quarters
Banks with branches in Scottdale (2011 data):
PNC Bank, National Association: Scottdale Branch at 157 Pittsburgh Street, branch established on 1933/09/13; Scottdale Motor Bank Branch at Pittsburgh And Broadway, branch established on 1982/09/27. Info updated 2012/03/20: Bank assets: $263,309.6 mil, Deposits: $197,343.0 mil, headquarters in Wilmington, DE, positive income , Commercial Lending Specialization, 3085 total offices , Holding Company: Pnc Financial Services Group, Inc., The
Standard Bank, PaSB: Scottdale Branch at 100 Pittsburgh Street, branch established on 1984/03/01. Info updated 2006/11/03: Bank assets: $436.8 mil, Deposits: $325.5 mil, headquarters in Murrysville, PA, positive income , Mortgage Lending Specialization, 12 total offices , Holding Company: Standard Financial Corporation
The Scottdale Bank & Trust Company: at 150 Pittsburgh Street, branch established on 1901/02/25. Info updated 2006/11/03: Bank assets: $233.6 mil, Deposits: $190.1 mil, local headquarters , positive income , 4 total offices , Holding Company: Lawrence Keister & Co
For population 15 years and over in Scottdale:
Never married: 31.0%Now married: 46.0%Separated: 1.4%Widowed: 10.3%Divorced: 11.3% For population 25 years and over in Scottdale:
High school or higher: 89.2%Bachelor's degree or higher: 20.8%Graduate or professional degree: 8.7%Unemployed: 9.8%Mean travel time to work (commute): 22.6 minutes
Education Gini index (Inequality in education) Here:
11.0Pennsylvania average:
11.4
Religion statistics for Scottdale, PA (based on Westmoreland County data)
Religion Adherents Congregations Catholic 121,691 60 Mainline Protestant 67,009 194 Evangelical Protestant 26,600 170 Orthodox 2,036 17 Black Protestant 1,320 11 Other 1,164 16 None 145,349 -
Source: Clifford Grammich, Kirk Hadaway, Richard Houseal, Dale E.Jones, Alexei Krindatch, Richie Stanley and Richard H.Taylor. 2012. 2010 U.S.Religion Census: Religious Congregations & Membership Study. Association of Statisticians of American Religious Bodies. Jones, Dale E., et al. 2002. Congregations and Membership in the United States 2000. Nashville, TN: Glenmary Research Center. Graphs represent county-level data
Food Environment Statistics: Number of grocery stores : 54Westmoreland County :
1.49 / 10,000 pop.State :
2.04 / 10,000 pop.
Number of supercenters and club stores : 5Westmoreland County :
0.14 / 10,000 pop.Pennsylvania :
0.09 / 10,000 pop.
Number of convenience stores (no gas) : 17This county :
0.47 / 10,000 pop.Pennsylvania :
0.88 / 10,000 pop.
Number of convenience stores (with gas) : 111This county :
3.06 / 10,000 pop.State :
2.52 / 10,000 pop.
Number of full-service restaurants : 246Westmoreland County :
6.79 / 10,000 pop.Pennsylvania :
7.12 / 10,000 pop.
Adult diabetes rate : This county :
8.7%Pennsylvania :
9.1%
Adult obesity rate : Here :
23.9%Pennsylvania :
27.2%
Low-income preschool obesity rate : Here :
12.9%Pennsylvania :
11.5%
Health and Nutrition: Healthy diet rate : This city:
49.6%Pennsylvania:
50.2%
Average overall health of teeth and gums : This city:
43.8%Pennsylvania:
47.1%
Average BMI : This city:
28.8Pennsylvania:
28.7
People feeling badly about themselves : Scottdale:
18.4%Pennsylvania:
20.8%
People not drinking alcohol at all : Scottdale:
7.9%Pennsylvania:
10.9%
Average hours sleeping at night : Overweight people : Scottdale:
27.9%State:
34.3%
General health condition : Scottdale:
57.5%State:
56.2%
Average condition of hearing : Scottdale:
74.3%Pennsylvania:
78.3%
More about Health and Nutrition of Scottdale, PA Residents
Local government employment and payroll (March 2022)
Function
Full-time employees
Monthly full-time payroll
Average yearly full-time wage
Part-time employees
Monthly part-time payroll
Police Protection - Officers
6 $18,726 $37,452 0 $0 Streets and Highways
4 $8,574 $25,722 0 $0 Other Government Administration
2 $4,481 $26,886 1 $723 Other and Unallocable
0 $0 1 $556 Police - Other
0 $0 7 $4,034 Financial Administration
0 $0 1 $2,220
Totals for Government
12 $31,781 $31,781 10 $7,533
Scottdale government finances - Expenditure in 2017 (per resident):
Current Operations - Regular Highways: $561,000 ($128.76)
Police Protection: $546,000 ($125.32)Central Staff Services: $217,000 ($49.80)General - Other: $145,000 ($33.28)Local Fire Protection: $80,000 ($18.36)Parks and Recreation: $50,000 ($11.48)Housing and Community Development: $46,000 ($10.56)Libraries: $25,000 ($5.74)Solid Waste Management: $13,000 ($2.98)Sewerage: $10,000 ($2.30)Protective Inspection and Regulation - Other: $7,000 ($1.61)Health - Other: $4,000 ($0.92)General - Interest on Debt: $38,000 ($8.72)
Scottdale government finances - Revenue in 2017 (per resident):
Charges - Sewerage: $114,000 ($26.16)
Parking Facilities: $13,000 ($2.98)Other: $8,000 ($1.84)Parks and Recreation: $2,000 ($0.46)Federal Intergovernmental - Other: $14,000 ($3.21)
Local Intergovernmental - Other: $13,000 ($2.98)
Miscellaneous - Fines and Forfeits: $31,000 ($7.11)
General Revenue - Other: $5,000 ($1.15)Interest Earnings: $3,000 ($0.69)Donations From Private Sources: $2,000 ($0.46)State Intergovernmental - Other: $278,000 ($63.81)
Tax - Property: $609,000 ($139.78)
Individual Income: $437,000 ($100.30)Occupation and Business License - Other: $206,000 ($47.28)Public Utility License: $75,000 ($17.21)Documentary and Stock Transfer: $33,000 ($7.57)
Scottdale government finances - Debt in 2017 (per resident):
Long Term Debt - Beginning Outstanding - Unspecified Public Purpose: $953,000 ($218.73)
Outstanding Unspecified Public Purpose: $946,000 ($217.12)Retired Unspecified Public Purpose: $81,000 ($18.59)Issue, Unspecified Public Purpose: $74,000 ($16.98)
Scottdale government finances - Cash and Securities in 2017 (per resident):
Other Funds - Cash and Securities: $1,500,000 ($344.27)
Businesses in Scottdale, PA
Name Count Name Count
Ace Hardware 1 Jones New York 1 GNC 1 Rite Aid 1
Strongest AM radio stations in Scottdale:
WKHB (620 AM; 6 kW; IRWIN, PA; Owner: BROADCAST COMMUNICATIONS, INC.)
KDKA (1020 AM; 50 kW; PITTSBURGH, PA; Owner: INFINITY BROADCASTING OPERATIONS, INC.)
WPNT (1340 AM; 1 kW; CONNELLSVILLE, PA; Owner: KEYMARKET LICENSES, LLC)
WASP (1130 AM; daytime; 5 kW; BROWNSVILLE, PA; Owner: KEYMARKET LICENSES, LLC)
WVSC (990 AM; 10 kW; SOMERSET, PA; Owner: FOREVER OF JOHNSTOWN, INC.)
WWVA (1170 AM; 53 kW; WHEELING, WV; Owner: CAPSTAR TX LIMITED PARTNERSHIP)
WLYE (850 AM; 10 kW; JOHNSTOWN, PA; Owner: FOREVER OF JOHNSTOWN, INC.)
WWCS (540 AM; 5 kW; CANONSBURG, PA; Owner: BIRACH BROADCASTING CORPORATION)
WJAS (1320 AM; 6 kW; PITTSBURGH, PA; Owner: RENDA BROADCASTING CORP. OF NEVADA)
WPIT (730 AM; 5 kW; PITTSBURGH, PA; Owner: PENNSYLVANIA MEDIA ASSOCIATES, INC.)
WCCS (1160 AM; 10 kW; HOMER CITY, PA; Owner: RENDA RADIO, INC.)
WYSN (1330 AM; 5 kW; SOMERSET, PA; Owner: DAME BROADCASTING, LLC)
WEAE (1250 AM; 5 kW; PITTSBURGH, PA; Owner: ABC, INC.)
Strongest FM radio stations in Scottdale:
WLSW (103.9 FM; SCOTTDALE, PA; Owner: L. STANLEY WALL)
WOGG (94.9 FM; OLIVER, PA; Owner: KEYMARKET LICENSES, LLC)
WVPM (90.9 FM; MORGANTOWN, WV; Owner: WEST VIRGINIA EDUCATIONAL BROADCASTING AUTHORITY)
WSSZ (107.1 FM; GREENSBURG, PA; Owner: MCL/MCM-INC.)
WQZS (93.3 FM; MEYERSDALE, PA; Owner: ROGER WAHL)
WQEJ (89.7 FM; JOHNSTOWN, PA; Owner: WQED MULTIMEDIA)
WRIJ (106.9 FM; MASONTOWN, PA; Owner: HE'S ALIVE INC.)
WSHH (99.7 FM; PITTSBURGH, PA; Owner: RENDA B/CING CORP. OF NEVADA)
WFRJ (88.9 FM; JOHNSTOWN, PA; Owner: FAMILY STATIONS, INC.)
WKYE (95.5 FM; JOHNSTOWN, PA; Owner: FOREVER OF JOHNSTOWN, INC.)
WQKK (92.1 FM; JOHNSTOWN, PA; Owner: DAME BROADCASTING, LLC)
WZPT (100.7 FM; NEW KENSINGTON, PA; Owner: INFINITY RADIO SUBSIDIARY OPERATIONS INC.)
WDSY-FM (107.9 FM; PITTSBURGH, PA; Owner: INFINITY RADIO SUBSIDIARY OPERATIONS INC.)
WLTJ (92.9 FM; PITTSBURGH, PA; Owner: WPNT, INC.)
WWSW-FM (94.5 FM; PITTSBURGH, PA; Owner: AMFM RADIO LICENSES, L.L.C.)
WROG (102.9 FM; CUMBERLAND, MD; Owner: TSCHUDY RADIO, INC)
WFWM (91.9 FM; FROSTBURG, MD; Owner: FROSTBURG STATE UNIVERSITY)
WKGO (106.1 FM; CUMBERLAND, MD; Owner: WTBO-WKGO CORPORATION, L.L.C.)
WLIC (97.1 FM; FROSTBURG, MD; Owner: HE'S ALIVE, INC.)
WJJJ (104.7 FM; PITTSBURGH, PA; Owner: CAPSTAR TX LIMITED PARTNERSHIP)
TV broadcast stations around Scottdale:
WTAE-TV (Channel 4; PITTSBURGH, PA; Owner: WTAE HEARST-ARGYLE TV, INC. (CA CORP.))
WPCB-TV (Channel 40; GREENSBURG, PA; Owner: CORNERSTONE TELEVISION, INC.)
WCWB (Channel 22; PITTSBURGH, PA; Owner: WCWB LICENSEE, LLC)
WPXI (Channel 11; PITTSBURGH, PA; Owner: WPXI-TV HOLDINGS, INC.)
W65CG (Channel 65; PITTSBURGH, PA; Owner: TRINITY BROADCASTING NETWORK)
WBGN-LP (Channel 59; PITTSBURGH, PA; Owner: BRUNO GOODWORTH NETWORK, INC.)
WPTG-LP (Channel 69; PITTSBURGH, PA; Owner: ABACUS TELEVISION)
WQEX (Channel 16; PITTSBURGH, PA; Owner: WQED MULTIMEDIA)
KDKA-TV (Channel 2; PITTSBURGH, PA; Owner: CBS BROADCASTING INC.)
W26AV (Channel 26; CHARLEROI, PA; Owner: DEBRA GOODWORTH)
WPGH-TV (Channel 53; PITTSBURGH, PA; Owner: WPGH LICENSEE, LLC)
WQED (Channel 13; PITTSBURGH, PA; Owner: WQED MULTIMEDIA)
W56CG (Channel 56; GREENSBURG, PA; Owner: TURNPIKE TELEVISION)
W61CC (Channel 61; PITTSBURGH, PA; Owner: THE VIDEOHOUSE, INC.)
WQVC-CA (Channel 28; GREENSBURG, PA; Owner: ABACUS TELEVISION)
WNPB-TV (Channel 24; MORGANTOWN, WV; Owner: WEST VIRGINIA EDUCATIONAL BROADCASTING AUTHORITY)
WIIC-LP (Channel 29; PITTSBURGH, PA; Owner: ABACUS TELEVISION)
WNPA (Channel 19; JEANNETTE, PA; Owner: VIACOM STATIONS GROUP OF PITTSBURGH INC.)
W35AW (Channel 35; UNIONTOWN, PA; Owner: DEBRA GOODWORTH)
WWAT-CA (Channel 45; UNIONTOWN, PA; Owner: ABACUS TELEVISION)
National Bridge Inventory (NBI) Statistics 19 Number of bridges354ft / 108m Total length $703,000 Total costs88,320 Total average daily traffic13,445 Total average daily truck traffic
New bridges - historical statistics
1 1900-1909 1 1920-1929 2 1950-1959 1 1970-1979 2 1980-1989 2 1990-1999 1 2000-2009 9 2010-2019
See full National Bridge Inventory statistics for Scottdale, PA
FCC Registered Antenna Towers: 4
Mark D Brammell, 10 Mt Pleasant Rd (Lat: 40.103611 Lon: -79.584667), Type: 57.9, Overall height: 56.4 m, Registrant: Westmoreland County Public Safety, Green-sburg, Phone: (724) 600-7302 Christine A Verre, S.R. 117, Box 60a (Lat: 40.087306 Lon: -79.560417), Type: 99.1, Overall height: 91.4 m, Registrant: Canon-sburg, Phone: (724) 416-2000 Christine A Verre, S.R. 117, Box 60a (Lat: 40.087306 Lon: -79.560417), Type: 99.1, Overall height: 91.4 m, Registrant: Canon-sburg, Phone: (724) 416-2000 Mark Brammell, 10 Mt Pleasant Rd (Lat: 40.103611 Lon: -79.584667), Type: 57.9, Overall height: 56.4 m, Registrant: Westmoreland County Public Safety, Green-sburg, Phone: (724) 600-7302 FCC Registered Broadcast Land Mobile Towers: 2
Lat: 40.098139 Lon: -79.586972, Call Sign: WPLH515, Assigned Frequencies: 464.325 MHz, 464.825 MHz, 467.762 MHz, 467.812 MHz, Grant Date: 04/28/2012, Expiration Date: 05/02/2022, Cancellation Date: 07/02/2022, Certifier: Robert P Endersbe, Registrant: Bearcom, 4009 Distribution Dr., Suite 200, Garland, TX 75041, Phone: (214) 765-7150, Fax: (214) 355-1707, Email:
Lat: 40.107111 Lon: -79.580083, Call Sign: KKA690, Assigned Frequencies: 159.915 MHz, 160.020 MHz, 160.125 MHz, Grant Date: 05/26/2022, Expiration Date: 03/05/2032, Registrant: Lauttamus Communications Inc., P.O. Box 2216, Weirton, WV 26062, Phone: (304) 723-5555, Fax: (304) 723-7451, Email:
FCC Registered Microwave Towers: 1
LAYTON, 4.9 Mi W Of (Lat: 40.095333 Lon: -79.690028), Overall height: 112.2 m, Call Sign: KGP82, Assigned Frequencies: 5945.20 MHz, 6063.80 MHz, Grant Date: 02/15/2000, Expiration Date: 02/01/2010, Cancellation Date: 02/14/2001, Registrant: At&t Corp., 1200 Peachtree Street, Locn 5w23, Atlanta, GA 30309, Phone: (404) 810-4021, Fax: (404) 810-7349, Email:
FCC Registered Amateur Radio Licenses: 29 (
See the full list of FCC Registered Amateur Radio Licenses in Scottdale )
FAA Registered Aircraft: 7
Aircraft: CESSNA 182P (Category: Land, Seats: 4, Weight: Up to 12,499 Pounds, Speed: 120 mph), Engine: CONT MOTOR O-470 SERIES (230 HP) (Reciprocating)N-Number: 1487S, N1487S, N-1487S, Serial Number: 18265034, Year manufactured: 1976, Airworthiness Date: 08/25/1976, Certificate Issue Date: 12/14/2017Registrant (Individual): Michael D Skovira, 330 Rustic Ln, Scottdale, PA 15683Aircraft: AERONCA 11AC (Category: Land, Seats: 2, Weight: Up to 12,499 Pounds, Speed: 75 mph), Engine: CONT MOTOR A&C65 SERIES (65 HP) (Reciprocating)N-Number: 3224E, N3224E, N-3224E, Serial Number: 11AC-1572, Year manufactured: 1947, Airworthiness Date: 01/14/1964, Certificate Issue Date: 09/12/2001Registrant (Individual): David Petrocsko, 127 3rd Ave, Scottdale, PA 15683Aircraft: CESSNA 172E (Category: Land, Seats: 4, Weight: Up to 12,499 Pounds, Speed: 105 mph), Engine: CONT MOTOR 0-300 SER (145 HP) (Reciprocating)N-Number: 5626T, N5626T, N-5626T, Serial Number: 17251526, Year manufactured: 1964, Airworthiness Date: 04/14/1964, Certificate Issue Date: 12/09/1985Registrant (Individual): James R Werkman, 1100 Arthur Ave, Scottdale, PA 15683Aircraft: PORTER PIETENPOL AIRCAMPER (Category: Land, Seats: 2, Weight: Up to 12,499 Pounds, Speed: 78 mph), Engine: CONT MOTOR A&C65 SERIES (65 HP) (Reciprocating)N-Number: 7738, N7738, N-7738, Serial Number: 72-2, Year manufactured: 1974, Airworthiness Date: 04/15/1981, Certificate Issue Date: 07/13/1989Registrant (Individual): David P Petrocsko, 127 3rd Ave, Scottdale, PA 15683Aircraft: PRECEPTOR AIRCRAFT CORP N-3 PUP (Category: Land, Weight: Up to 12,499 Pounds), Engine: AMA/EXPR UNKNOWN ENG (4 Cycle)N-Number: 8032K, N8032K, N-8032K, Serial Number: JH-001, Year manufactured: 2007, Airworthiness Date: 12/20/2007, Certificate Issue Date: 09/04/2007Registrant (Individual): Jon A Hribal, 114 Lake Forest Blvd, Scottdale, PA 15683Aircraft: AERONCA 7AC (Category: Land, Seats: 2, Weight: Up to 12,499 Pounds, Speed: 90 mph), Engine: CONT MOTOR A&C65 SERIES (65 HP) (Reciprocating)N-Number: 82938, N82938, N-82938, Serial Number: 7AC-1588, Year manufactured: 1946, Airworthiness Date: 09/17/1955, Certificate Issue Date: 07/01/1982Registrant (Individual): Robert D Stuckert, 255 Creek Rd, Scottdale, PA 15683Aircraft: CESSNA 170A (Category: Land, Seats: 4, Weight: Up to 12,499 Pounds, Speed: 105 mph), Engine: CONT MOTOR C145 SERIES (145 HP) (Reciprocating)N-Number: 9004A, N9004A, N-9004A, Serial Number: 18759, Year manufactured: 1949, Airworthiness Date: 04/25/1957, Certificate Issue Date: 12/17/2013Registrant (Individual): Robert D Stuckert, 255 Creek Rd, Scottdale, PA 15683
Home Mortgage Disclosure Act Aggregated Statistics For Year 2009(Based on 2 full tracts) A) FHA, FSA/RHS & VA B) Conventional C) Refinancings D) Home Improvement Loans E) Loans on Dwellings For 5+ Families F) Non-occupant Loans on G) Loans On Manufactured Number Average Value Number Average Value Number Average Value Number Average Value Number Average Value Number Average Value Number Average Value
LOANS ORIGINATED 22 $92,773 11 $83,364 59 $93,542 10 $33,500 1 $18,000 5 $61,000 1 $23,000 APPLICATIONS APPROVED, NOT ACCEPTED 0 $0 4 $115,250 5 $86,800 1 $53,000 0 $0 1 $37,000 0 $0 APPLICATIONS DENIED 3 $86,333 2 $115,000 38 $106,395 8 $36,500 0 $0 2 $115,000 0 $0 APPLICATIONS WITHDRAWN 2 $67,000 1 $68,000 13 $89,154 1 $4,000 0 $0 1 $64,000 0 $0 FILES CLOSED FOR INCOMPLETENESS 0 $0 0 $0 2 $109,000 0 $0 0 $0 0 $0 0 $0
Aggregated Statistics For Year 2008(Based on 2 full tracts) A) FHA, FSA/RHS & VA B) Conventional C) Refinancings D) Home Improvement Loans F) Non-occupant Loans on G) Loans On Manufactured Number Average Value Number Average Value Number Average Value Number Average Value Number Average Value Number Average Value
LOANS ORIGINATED 11 $81,455 25 $85,080 47 $79,830 13 $26,154 9 $36,889 0 $0 APPLICATIONS APPROVED, NOT ACCEPTED 1 $194,000 2 $39,000 6 $118,667 3 $30,333 1 $44,000 1 $34,000 APPLICATIONS DENIED 2 $69,500 4 $64,250 52 $104,827 19 $56,000 3 $71,333 4 $79,000 APPLICATIONS WITHDRAWN 0 $0 2 $148,000 15 $104,467 1 $50,000 0 $0 1 $76,000 FILES CLOSED FOR INCOMPLETENESS 1 $49,000 0 $0 5 $99,600 0 $0 0 $0 0 $0
Aggregated Statistics For Year 2007(Based on 2 full tracts) A) FHA, FSA/RHS & VA B) Conventional C) Refinancings D) Home Improvement Loans F) Non-occupant Loans on G) Loans On Manufactured Number Average Value Number Average Value Number Average Value Number Average Value Number Average Value Number Average Value
LOANS ORIGINATED 13 $90,846 44 $80,432 56 $79,107 23 $29,261 12 $51,083 1 $76,000 APPLICATIONS APPROVED, NOT ACCEPTED 0 $0 4 $34,500 12 $82,250 4 $27,500 1 $50,000 2 $23,500 APPLICATIONS DENIED 0 $0 11 $85,273 90 $78,467 28 $37,143 3 $59,000 4 $73,500 APPLICATIONS WITHDRAWN 0 $0 3 $94,000 23 $91,304 1 $19,000 1 $120,000 0 $0 FILES CLOSED FOR INCOMPLETENESS 0 $0 0 $0 13 $86,692 0 $0 2 $73,000 0 $0
Aggregated Statistics For Year 2006(Based on 2 full tracts) A) FHA, FSA/RHS & VA B) Conventional C) Refinancings D) Home Improvement Loans E) Loans on Dwellings For 5+ Families F) Non-occupant Loans on G) Loans On Manufactured Number Average Value Number Average Value Number Average Value Number Average Value Number Average Value Number Average Value Number Average Value
LOANS ORIGINATED 10 $81,800 65 $81,785 82 $74,951 29 $34,966 1 $18,000 11 $47,455 2 $16,500 APPLICATIONS APPROVED, NOT ACCEPTED 0 $0 8 $56,625 9 $76,000 6 $21,167 0 $0 1 $10,000 0 $0 APPLICATIONS DENIED 1 $79,000 13 $64,077 96 $83,073 15 $19,333 0 $0 0 $0 4 $19,000 APPLICATIONS WITHDRAWN 0 $0 11 $72,909 53 $103,075 2 $83,000 0 $0 4 $48,250 1 $76,000 FILES CLOSED FOR INCOMPLETENESS 1 $72,000 1 $47,000 16 $97,625 0 $0 0 $0 1 $53,000 0 $0
Aggregated Statistics For Year 2005(Based on 2 full tracts) A) FHA, FSA/RHS & VA B) Conventional C) Refinancings D) Home Improvement Loans F) Non-occupant Loans on G) Loans On Manufactured Number Average Value Number Average Value Number Average Value Number Average Value Number Average Value Number Average Value
LOANS ORIGINATED 6 $86,333 55 $70,582 88 $73,466 24 $45,375 11 $53,636 2 $51,500 APPLICATIONS APPROVED, NOT ACCEPTED 0 $0 8 $62,125 26 $72,885 4 $35,750 2 $51,000 1 $20,000 APPLICATIONS DENIED 0 $0 22 $67,409 107 $88,009 30 $32,600 5 $34,000 9 $38,333 APPLICATIONS WITHDRAWN 0 $0 12 $72,667 43 $107,721 6 $114,167 2 $61,500 0 $0 FILES CLOSED FOR INCOMPLETENESS 1 $150,000 2 $52,000 5 $89,400 1 $20,000 1 $50,000 0 $0
Aggregated Statistics For Year 2004(Based on 2 full tracts) A) FHA, FSA/RHS & VA B) Conventional C) Refinancings D) Home Improvement Loans F) Non-occupant Loans on G) Loans On Manufactured Number Average Value Number Average Value Number Average Value Number Average Value Number Average Value Number Average Value
LOANS ORIGINATED 7 $97,000 46 $78,413 103 $78,505 38 $30,289 13 $60,077 2 $44,500 APPLICATIONS APPROVED, NOT ACCEPTED 1 $140,000 5 $53,200 31 $81,839 8 $16,500 1 $7,000 3 $26,000 APPLICATIONS DENIED 2 $103,000 15 $77,133 100 $77,940 22 $24,409 5 $55,200 6 $30,167 APPLICATIONS WITHDRAWN 3 $76,000 12 $53,083 36 $88,194 6 $33,667 1 $65,000 1 $18,000 FILES CLOSED FOR INCOMPLETENESS 0 $0 1 $72,000 16 $95,625 4 $24,250 0 $0 0 $0
Aggregated Statistics For Year 2003(Based on 2 full tracts) A) FHA, FSA/RHS & VA B) Conventional C) Refinancings D) Home Improvement Loans F) Non-occupant Loans on Number Average Value Number Average Value Number Average Value Number Average Value Number Average Value
LOANS ORIGINATED 12 $74,833 50 $75,220 178 $72,522 29 $33,655 9 $62,667 APPLICATIONS APPROVED, NOT ACCEPTED 2 $76,000 6 $82,833 43 $69,465 2 $42,000 0 $0 APPLICATIONS DENIED 0 $0 13 $42,000 123 $71,911 22 $13,636 4 $47,250 APPLICATIONS WITHDRAWN 2 $83,000 9 $75,000 47 $78,191 3 $41,333 2 $67,500 FILES CLOSED FOR INCOMPLETENESS 0 $0 5 $57,800 7 $99,857 2 $50,000 0 $0
Aggregated Statistics For Year 2002(Based on 2 full tracts) A) FHA, FSA/RHS & VA B) Conventional C) Refinancings D) Home Improvement Loans F) Non-occupant Loans on Number Average Value Number Average Value Number Average Value Number Average Value Number Average Value
LOANS ORIGINATED 15 $91,467 35 $84,943 138 $65,841 18 $29,500 4 $48,750 APPLICATIONS APPROVED, NOT ACCEPTED 0 $0 8 $52,750 41 $74,171 8 $32,500 1 $26,000 APPLICATIONS DENIED 1 $64,000 14 $44,071 95 $62,337 22 $11,500 3 $42,667 APPLICATIONS WITHDRAWN 1 $85,000 3 $56,000 62 $84,935 1 $40,000 0 $0 FILES CLOSED FOR INCOMPLETENESS 1 $75,000 1 $74,000 9 $74,444 1 $20,000 0 $0
Aggregated Statistics For Year 2001(Based on 2 full tracts) A) FHA, FSA/RHS & VA B) Conventional C) Refinancings D) Home Improvement Loans F) Non-occupant Loans on Number Average Value Number Average Value Number Average Value Number Average Value Number Average Value
LOANS ORIGINATED 15 $71,533 42 $66,048 145 $64,021 36 $20,639 8 $41,750 APPLICATIONS APPROVED, NOT ACCEPTED 1 $45,000 8 $73,375 36 $63,694 9 $23,889 3 $29,333 APPLICATIONS DENIED 4 $69,500 29 $58,414 118 $73,144 34 $14,088 3 $46,667 APPLICATIONS WITHDRAWN 1 $79,000 5 $61,000 71 $67,972 3 $15,333 2 $59,000 FILES CLOSED FOR INCOMPLETENESS 1 $89,000 0 $0 17 $74,941 0 $0 0 $0
Aggregated Statistics For Year 2000(Based on 2 full tracts) A) FHA, FSA/RHS & VA B) Conventional C) Refinancings D) Home Improvement Loans E) Loans on Dwellings For 5+ Families F) Non-occupant Loans on Number Average Value Number Average Value Number Average Value Number Average Value Number Average Value Number Average Value
LOANS ORIGINATED 13 $66,692 50 $60,560 95 $56,053 32 $22,750 1 $153,000 4 $58,000 APPLICATIONS APPROVED, NOT ACCEPTED 2 $76,500 7 $41,429 37 $69,459 7 $15,000 0 $0 2 $35,500 APPLICATIONS DENIED 2 $51,000 40 $39,150 72 $77,847 30 $17,300 0 $0 1 $25,000 APPLICATIONS WITHDRAWN 1 $59,000 1 $36,000 25 $68,360 2 $18,500 0 $0 1 $72,000 FILES CLOSED FOR INCOMPLETENESS 1 $42,000 1 $59,000 8 $74,125 0 $0 0 $0 1 $20,000
Aggregated Statistics For Year 1999(Based on 2 partial tracts) A) FHA, FSA/RHS & VA B) Conventional C) Refinancings D) Home Improvement Loans F) Non-occupant Loans on Number Average Value Number Average Value Number Average Value Number Average Value Number Average Value
LOANS ORIGINATED 15 $57,052 50 $48,931 76 $55,769 33 $22,274 9 $46,671 APPLICATIONS APPROVED, NOT ACCEPTED 3 $44,940 12 $53,794 48 $61,322 14 $23,593 1 $50,620 APPLICATIONS DENIED 1 $26,780 39 $34,036 71 $53,675 26 $25,274 4 $44,538 APPLICATIONS WITHDRAWN 0 $0 7 $60,797 38 $53,405 5 $30,798 2 $39,775 FILES CLOSED FOR INCOMPLETENESS 0 $0 1 $44,320 6 $47,777 0 $0 0 $0
Detailed HMDA statistics for the following Tracts:
8063.00
, 8064.00
Private Mortgage Insurance Companies Aggregated Statistics For Year 2009(Based on 2 full tracts) A) Conventional B) Refinancings Number Average Value Number Average Value
LOANS ORIGINATED 3 $101,333 1 $75,000 APPLICATIONS APPROVED, NOT ACCEPTED 1 $176,000 1 $85,000 APPLICATIONS DENIED 0 $0 0 $0 APPLICATIONS WITHDRAWN 0 $0 0 $0 FILES CLOSED FOR INCOMPLETENESS 0 $0 0 $0
Aggregated Statistics For Year 2008(Based on 2 full tracts) A) Conventional B) Refinancings C) Non-occupant Loans on Number Average Value Number Average Value Number Average Value
LOANS ORIGINATED 7 $85,714 4 $135,500 1 $18,000 APPLICATIONS APPROVED, NOT ACCEPTED 0 $0 1 $88,000 0 $0 APPLICATIONS DENIED 1 $34,000 1 $92,000 1 $34,000 APPLICATIONS WITHDRAWN 0 $0 0 $0 0 $0 FILES CLOSED FOR INCOMPLETENESS 0 $0 0 $0 0 $0
Aggregated Statistics For Year 2007(Based on 2 full tracts) A) Conventional B) Refinancings Number Average Value Number Average Value
LOANS ORIGINATED 14 $92,429 4 $147,250 APPLICATIONS APPROVED, NOT ACCEPTED 1 $129,000 3 $106,000 APPLICATIONS DENIED 0 $0 0 $0 APPLICATIONS WITHDRAWN 1 $76,000 0 $0 FILES CLOSED FOR INCOMPLETENESS 0 $0 0 $0
Aggregated Statistics For Year 2006(Based on 2 full tracts) A) Conventional B) Refinancings C) Non-occupant Loans on Number Average Value Number Average Value Number Average Value
LOANS ORIGINATED 12 $92,500 5 $94,600 0 $0 APPLICATIONS APPROVED, NOT ACCEPTED 0 $0 1 $182,000 0 $0 APPLICATIONS DENIED 0 $0 0 $0 0 $0 APPLICATIONS WITHDRAWN 1 $56,000 1 $131,000 1 $56,000 FILES CLOSED FOR INCOMPLETENESS 0 $0 0 $0 0 $0
Aggregated Statistics For Year 2005(Based on 2 full tracts) A) Conventional B) Refinancings C) Non-occupant Loans on Number Average Value Number Average Value Number Average Value
LOANS ORIGINATED 9 $73,667 4 $97,750 1 $75,000 APPLICATIONS APPROVED, NOT ACCEPTED 3 $93,667 1 $100,000 2 $84,000 APPLICATIONS DENIED 0 $0 0 $0 0 $0 APPLICATIONS WITHDRAWN 0 $0 1 $56,000 0 $0 FILES CLOSED FOR INCOMPLETENESS 0 $0 0 $0 0 $0
Aggregated Statistics For Year 2004(Based on 2 full tracts) A) Conventional B) Refinancings C) Non-occupant Loans on Number Average Value Number Average Value Number Average Value
LOANS ORIGINATED 17 $75,235 5 $104,000 4 $54,750 APPLICATIONS APPROVED, NOT ACCEPTED 1 $182,000 1 $126,000 0 $0 APPLICATIONS DENIED 0 $0 0 $0 0 $0 APPLICATIONS WITHDRAWN 0 $0 1 $157,000 0 $0 FILES CLOSED FOR INCOMPLETENESS 1 $99,000 0 $0 0 $0
Aggregated Statistics For Year 2003(Based on 2 full tracts) A) Conventional B) Refinancings Number Average Value Number Average Value
LOANS ORIGINATED 16 $68,125 8 $92,000 APPLICATIONS APPROVED, NOT ACCEPTED 3 $65,667 3 $83,000 APPLICATIONS DENIED 0 $0 0 $0 APPLICATIONS WITHDRAWN 0 $0 2 $52,000 FILES CLOSED FOR INCOMPLETENESS 0 $0 1 $162,000
Aggregated Statistics For Year 2002(Based on 2 full tracts) A) Conventional B) Refinancings C) Non-occupant Loans on Number Average Value Number Average Value Number Average Value
LOANS ORIGINATED 8 $61,125 10 $81,100 2 $36,500 APPLICATIONS APPROVED, NOT ACCEPTED 2 $63,000 1 $73,000 1 $40,000 APPLICATIONS DENIED 0 $0 0 $0 0 $0 APPLICATIONS WITHDRAWN 0 $0 0 $0 0 $0 FILES CLOSED FOR INCOMPLETENESS 0 $0 0 $0 0 $0
Aggregated Statistics For Year 2001(Based on 2 full tracts) A) Conventional B) Refinancings C) Non-occupant Loans on Number Average Value Number Average Value Number Average Value
LOANS ORIGINATED 12 $69,333 14 $75,071 0 $0 APPLICATIONS APPROVED, NOT ACCEPTED 0 $0 2 $58,000 1 $80,000 APPLICATIONS DENIED 1 $75,000 0 $0 0 $0 APPLICATIONS WITHDRAWN 0 $0 1 $67,000 0 $0 FILES CLOSED FOR INCOMPLETENESS 0 $0 0 $0 0 $0
Aggregated Statistics For Year 2000(Based on 2 full tracts) A) Conventional B) Refinancings C) Non-occupant Loans on Number Average Value Number Average Value Number Average Value
LOANS ORIGINATED 9 $69,889 2 $103,000 1 $110,000 APPLICATIONS APPROVED, NOT ACCEPTED 1 $142,000 2 $78,500 0 $0 APPLICATIONS DENIED 2 $62,000 0 $0 0 $0 APPLICATIONS WITHDRAWN 0 $0 0 $0 0 $0 FILES CLOSED FOR INCOMPLETENESS 1 $88,000 0 $0 0 $0
Aggregated Statistics For Year 1999(Based on 2 partial tracts) A) Conventional B) Refinancings Number Average Value Number Average Value
LOANS ORIGINATED 7 $65,830 4 $75,232 APPLICATIONS APPROVED, NOT ACCEPTED 2 $78,490 0 $0 APPLICATIONS DENIED 1 $59,100 0 $0 APPLICATIONS WITHDRAWN 1 $24,410 0 $0 FILES CLOSED FOR INCOMPLETENESS 0 $0 0 $0
Detailed PMIC statistics for the following Tracts:
8063.00
, 8064.00
Most common first names in Scottdale, PA among deceased individuals Name Count Lived (average)
John 121 73.1 years Mary 115 80.9 years William 86 74.0 years James 86 72.0 years Charles 85 72.2 years George 77 77.3 years Joseph 70 73.0 years Robert 59 71.5 years Margaret 52 80.6 years Helen 52 79.6 years
Most common last names in Scottdale, PA among deceased individuals Last name Count Lived (average)
Miller 37 79.8 years King 32 77.8 years Stoner 27 74.9 years Thomas 26 76.3 years Smith 25 74.0 years Felgar 22 74.6 years Brown 20 71.9 years Anderson 19 75.8 years Hough 19 78.1 years Snyder 18 79.6 years
Scottdale compared to Pennsylvania state average:
Median house value below state average. Black race population percentage significantly below state average. Hispanic race population percentage significantly below state average. Foreign-born population percentage significantly below state average. Length of stay since moving in above state average.
Top Patent Applicants
Paul Dewald (6)
William Allen Shaffer (2)
Andrew W. Vargo (1)
Lori Ann Shrum (1)
Richard Foore (1)
Total of 11 patent applications in 2008-2024.
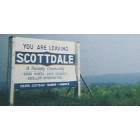
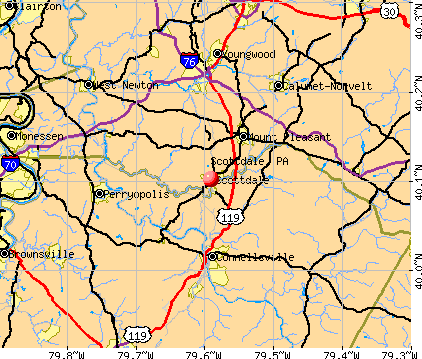


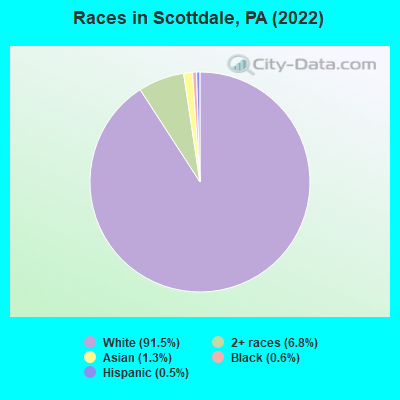
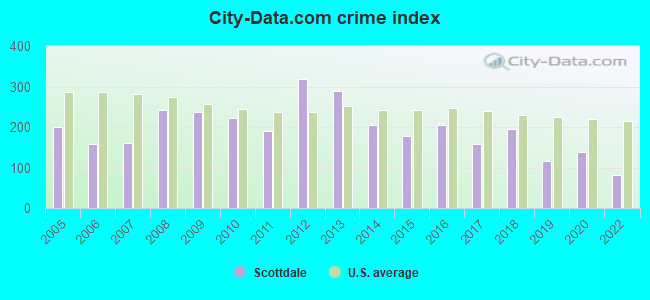
 Recent articles from our blog. Our writers, many of them Ph.D. graduates or candidates, create easy-to-read articles on a wide variety of topics.

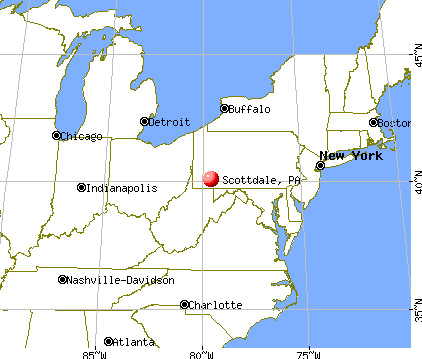
 (31.1 miles
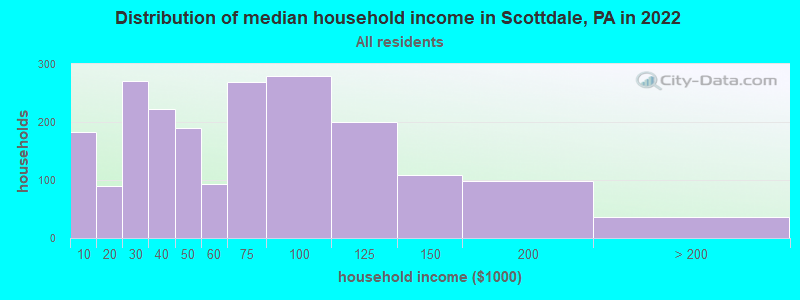
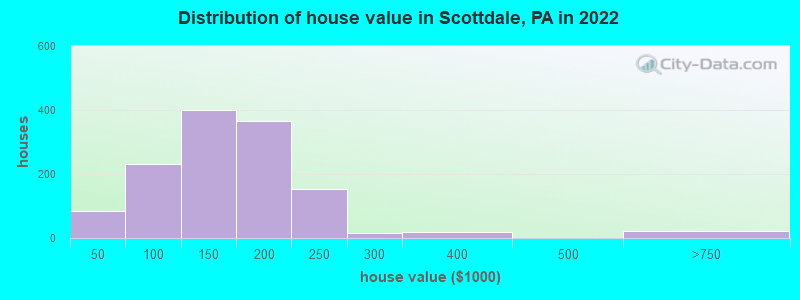

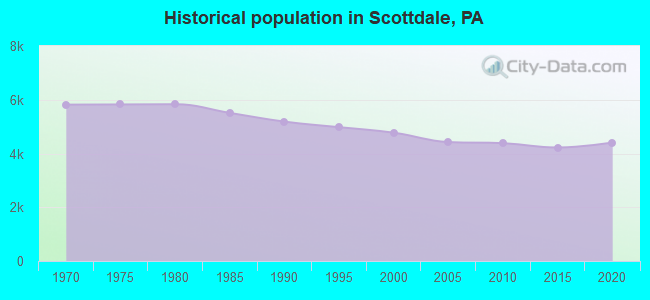
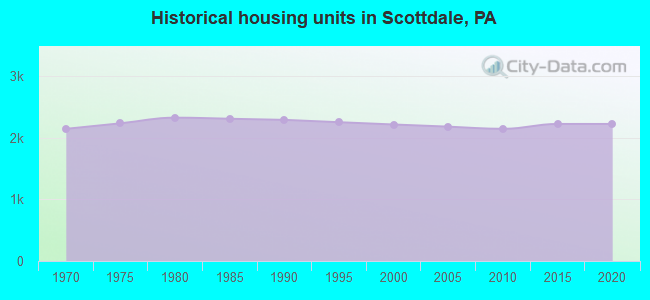
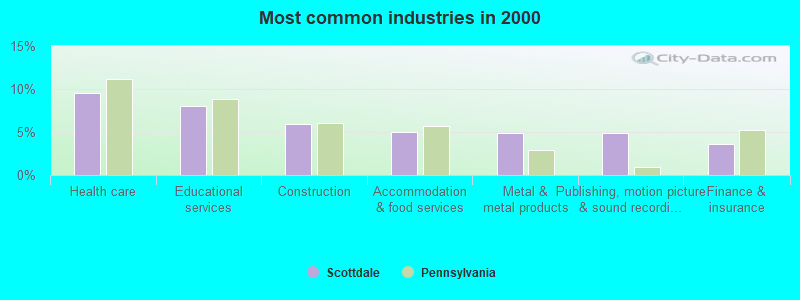
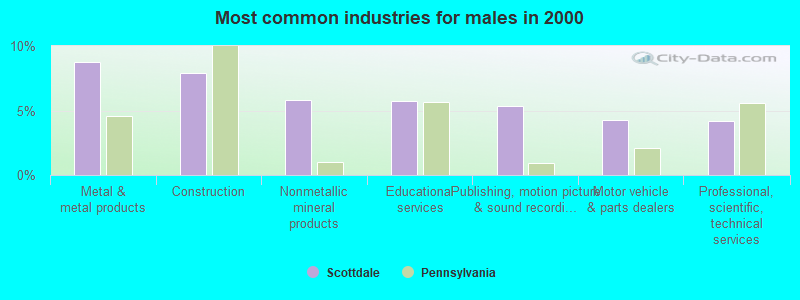
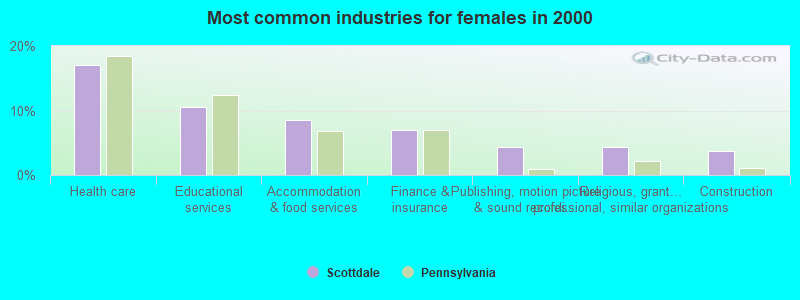
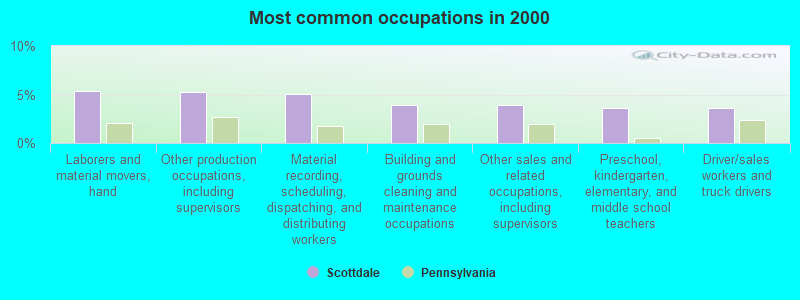
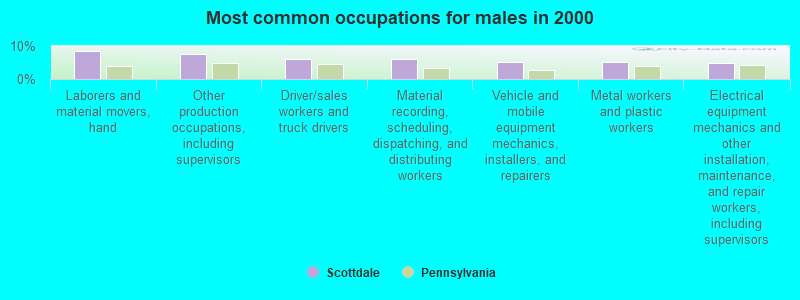
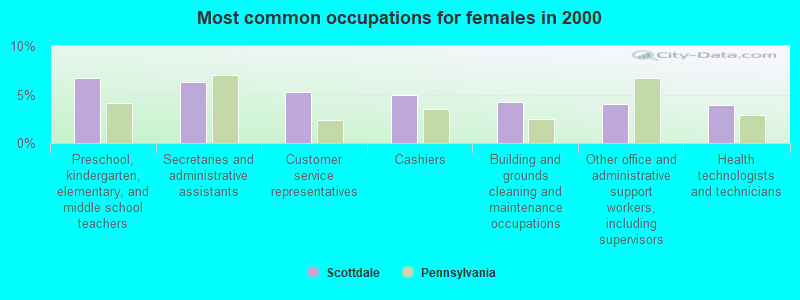
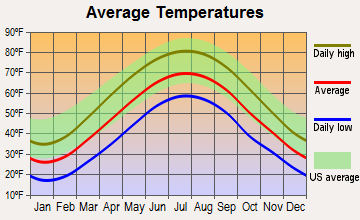
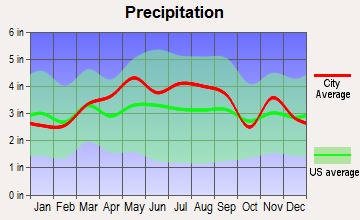
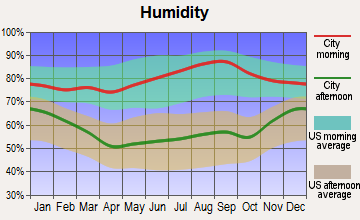
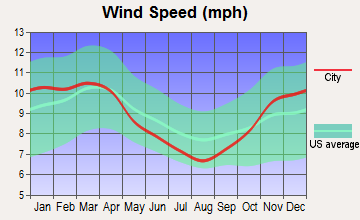
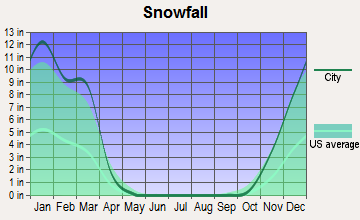
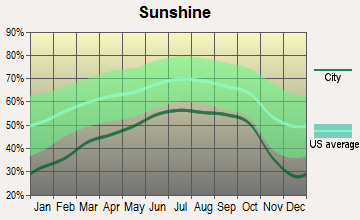
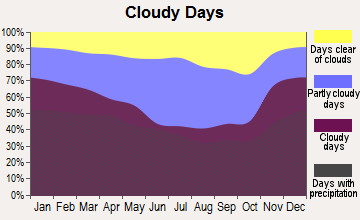


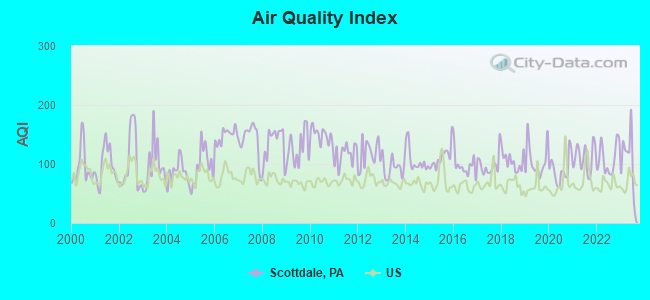
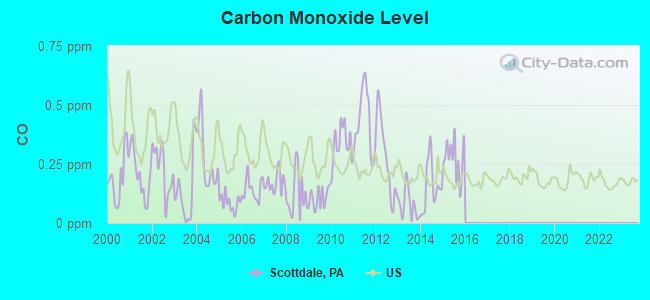
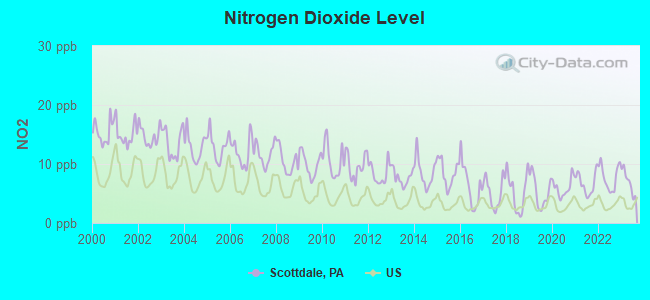
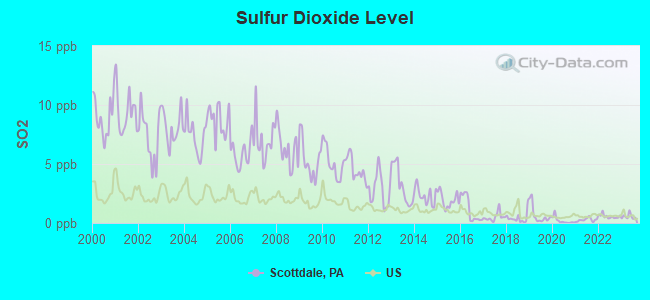
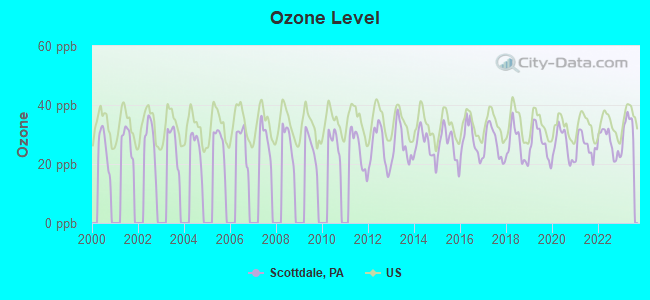
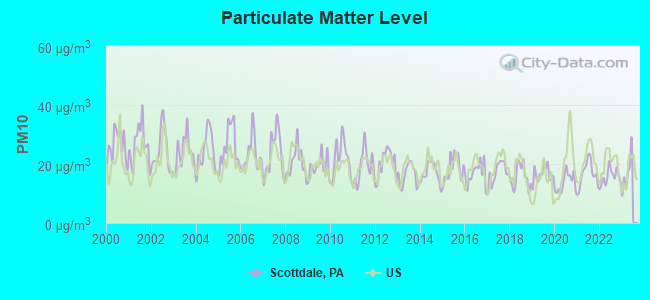
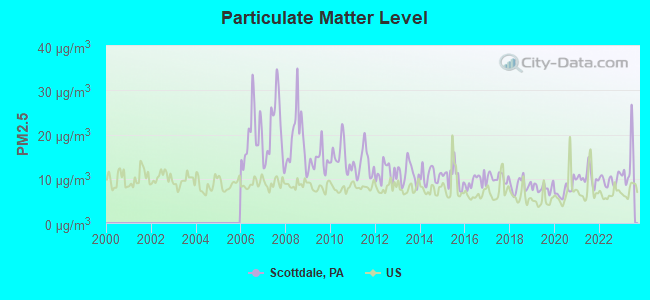
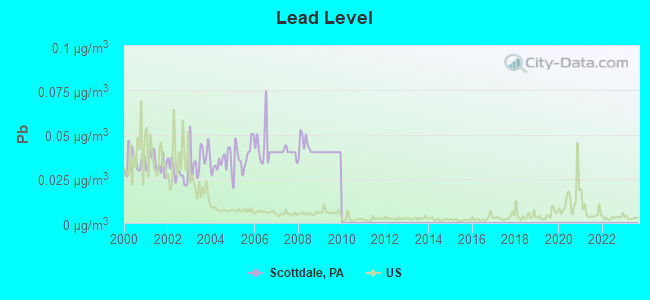

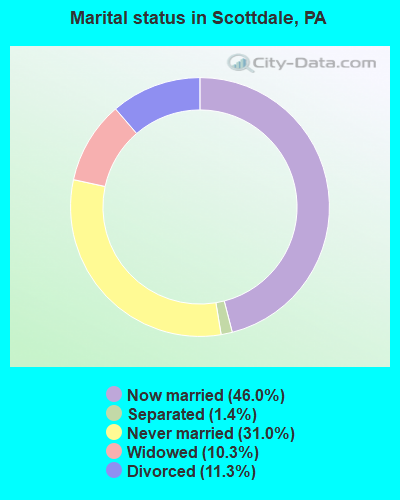
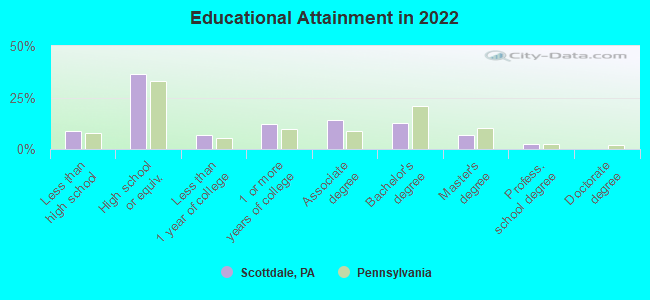
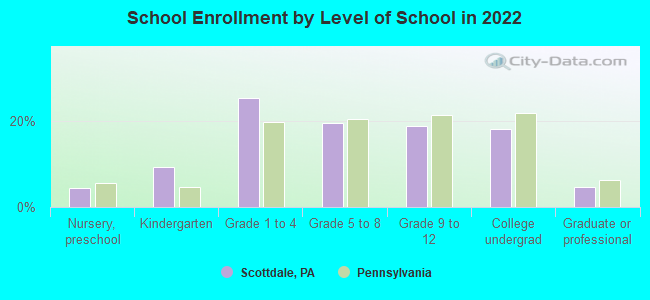
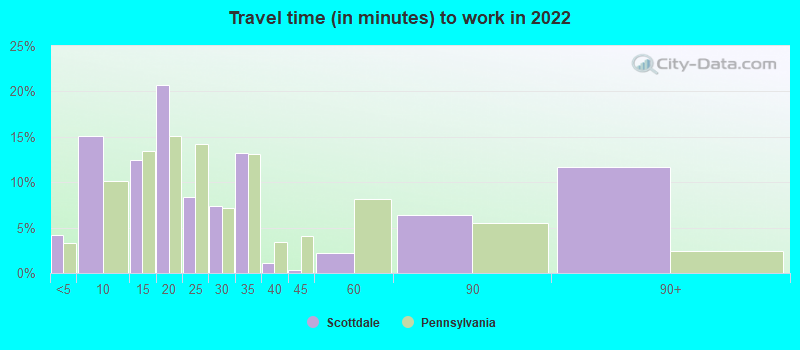
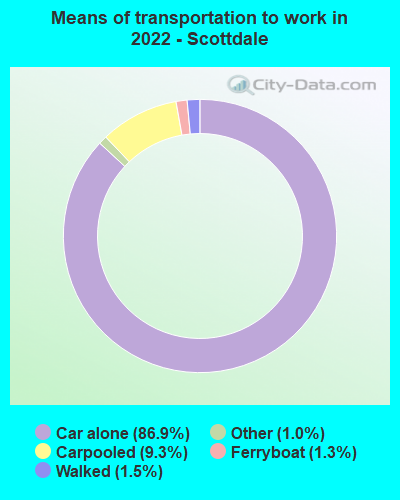
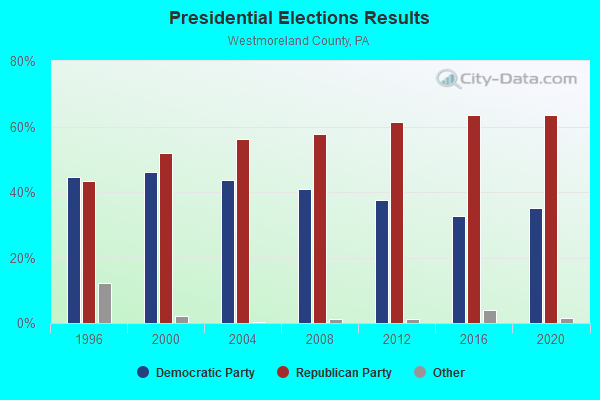
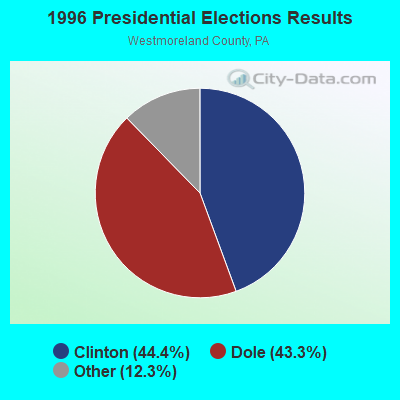
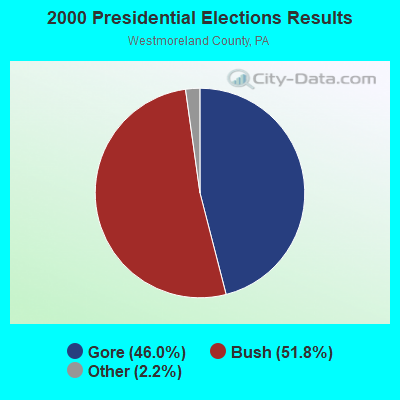
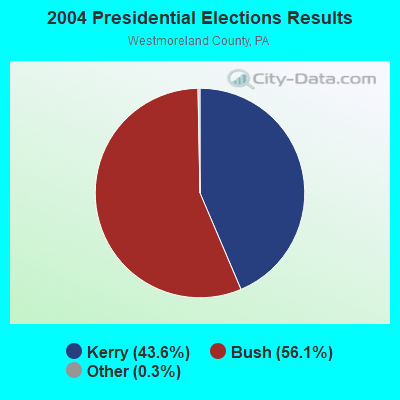
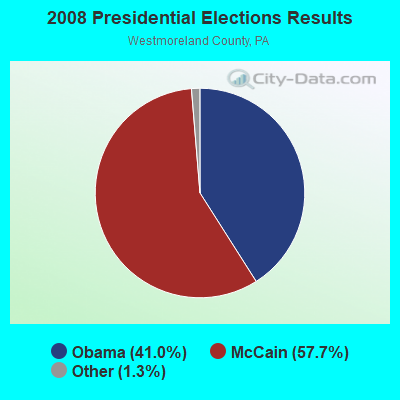
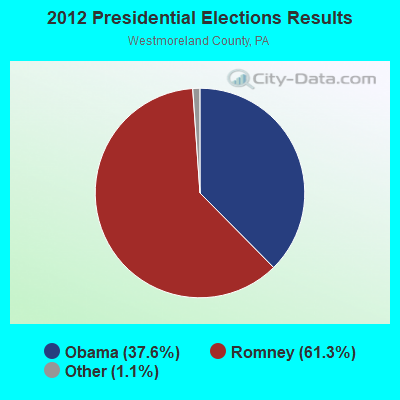
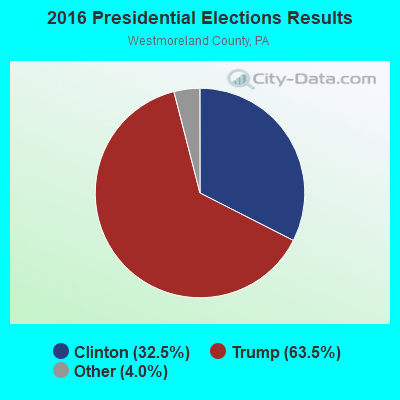
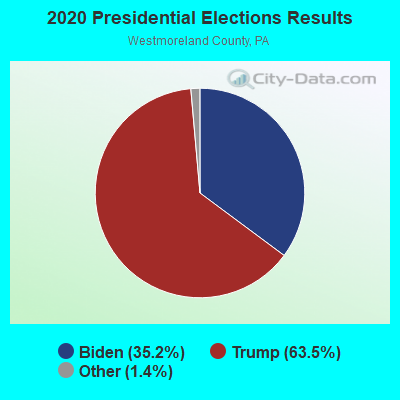
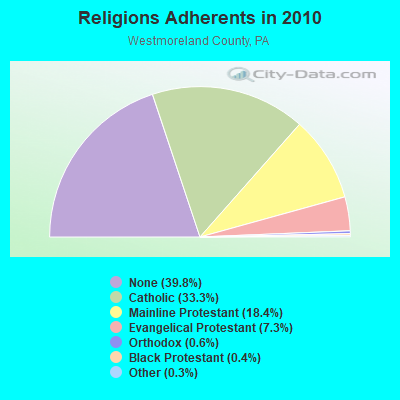
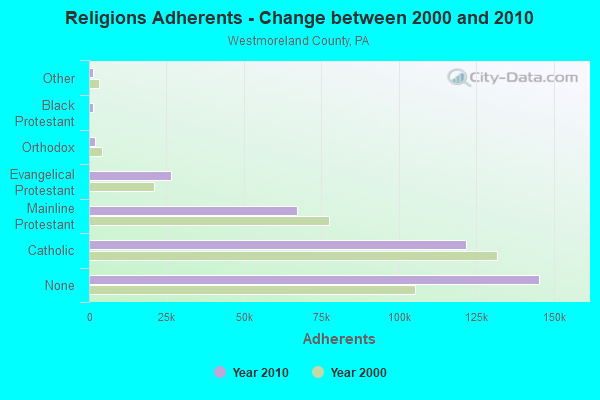
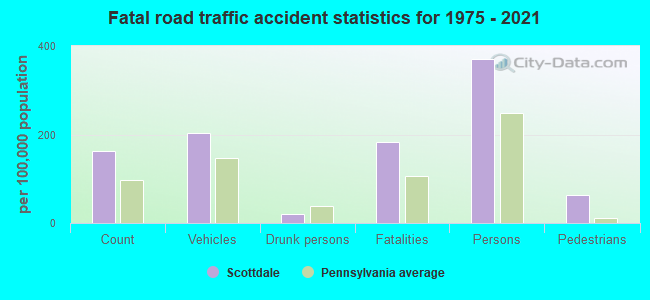
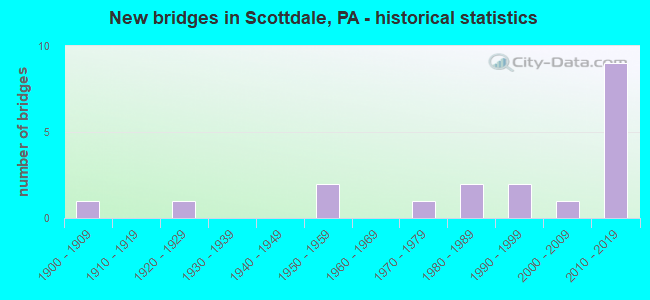
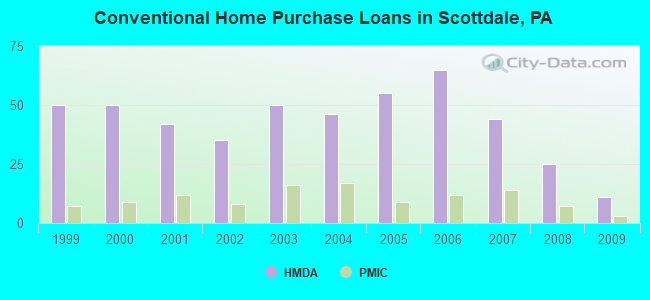
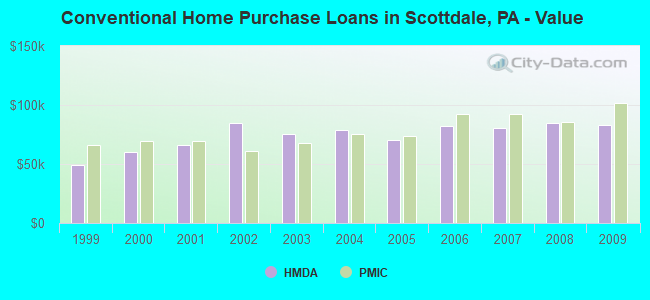
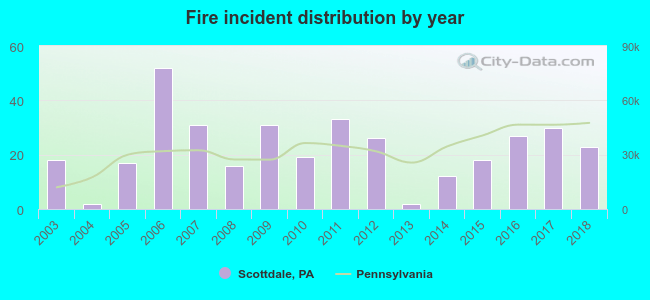 According to the data from the years 2003 - 2018 the average number of fire incidents per year is 22. The highest number of fires - 52 took place in 2006, and the least - 2 in 2004. The data has a growing trend.
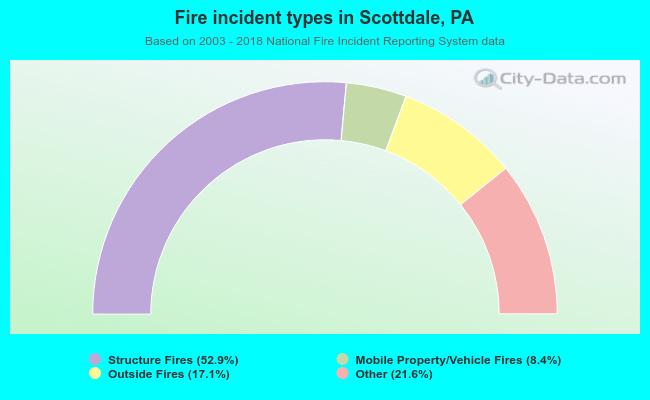 When looking into fire subcategories, the most incidents belonged to: Structure Fires (52.9%), and Other (21.6%).