Estimated zip code population in 2022: 25,336 Zip code population in 2010: 23,625 Zip code population in 2000: 22,679
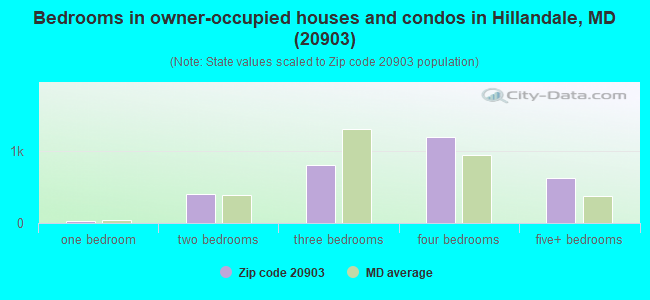
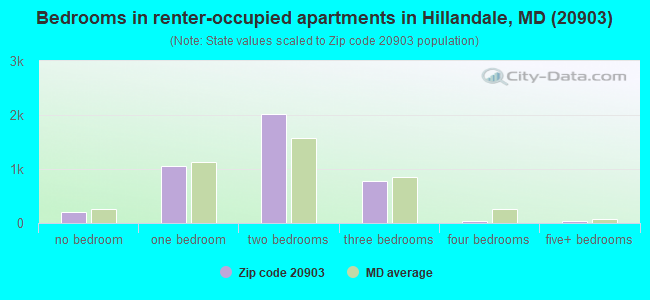
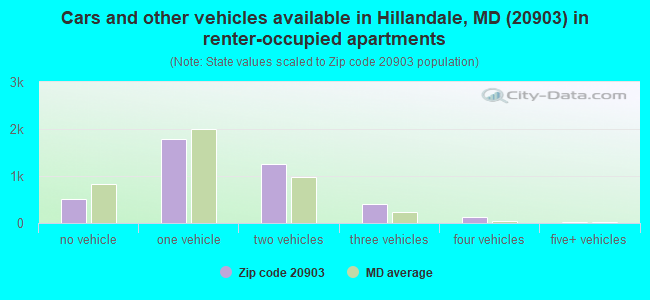
Houses and condos: 7,479 Renter-occupied apartments: 4,150
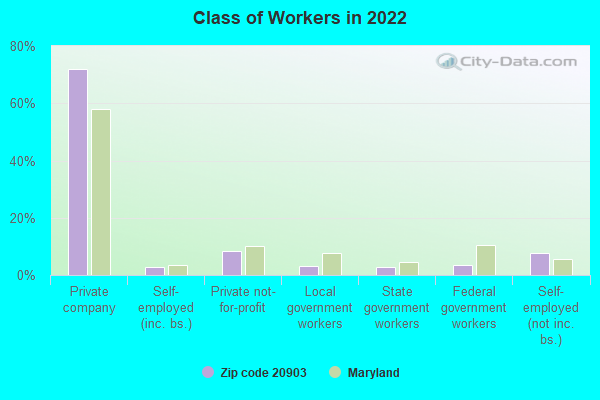
% of renters here:
58%
State:
32%
March 2022 cost of living index in zip code 20903: 181.1 (very high, U.S. average is 100)
Land area: 3.6 sq. mi. Water area: 0.0 sq. mi.
Population density: 7,034 people per square mile
(high).
OSM Map
General Map
Google Map
MSN Map
OSM Map
General Map
Google Map
MSN Map
OSM Map
General Map
Google Map
MSN Map
OSM Map
General Map
Google Map
MSN Map
Please wait while loading the map...
Real estate property taxes paid for housing units in 2022:
This zip code:
0.8% ($3,825)
Maryland:
0.9% ($3,777)
Median real estate property taxes paid for housing units with mortgages in 2022: $3,637 (0.8%) Median real estate property taxes paid for housing units with no mortgage in 2022: $4,183 (0.9%)
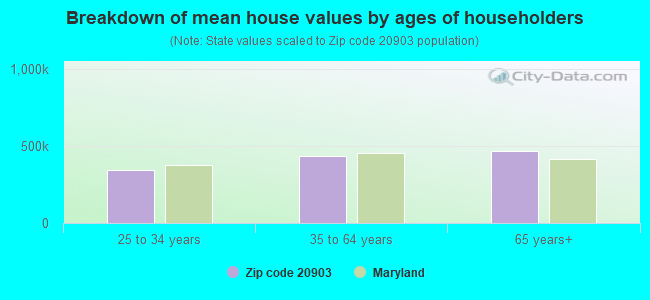
Estimated median house/condo value in 2022: $473,640
20903:
$473,640
Maryland:
$398,100
According to our research of Maryland and other state lists, there were 7 registered sex offenders living in 20903 zip code as of April 27, 2024. The ratio of all residents to sex offenders in zip code 20903 is 3,639 to 1. The ratio of registered sex offenders to all residents in this zip code is much lower than the state average.
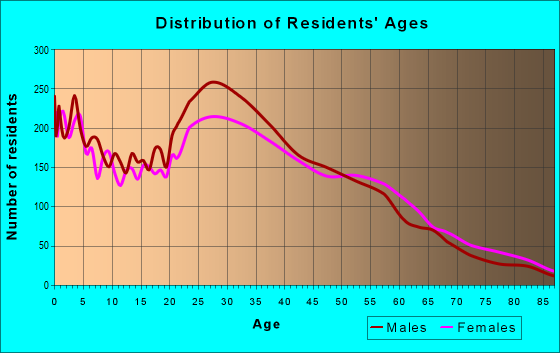
Median resident age:
This zip code:
33.0 years
Maryland median age:
39.7 years
Average household size:
This zip code:
3.5 people
Maryland:
2.5 people
Averages for the 2020 tax year for zip code 20903, filed in 2021:
Average Adjusted Gross Income (AGI) in 2020: $43,565 (Individual Income Tax Returns)
Here:
$43,565
State:
$86,905
Salary/wage: $44,650 (reported on 73.6% of returns)
Here:
$44,650
State:
$73,953
(% of AGI for various income ranges: 1274.8% for AGIs below $25k, 4047.2% for AGIs $25k-50k, 7271.0% for AGIs $50k-75k, 11092.0% for AGIs $75k-100k, 19206.8% for AGIs $100k-200k, 66163.8% for AGIs over 200k)
Taxable interest for individuals: $782 (reported on 17.8% of returns)
This zip code:
$782
Maryland:
$1,528
(% of AGI for various income ranges: 5.7% for AGIs below $25k, 6.9% for AGIs $25k-50k, 11.7% for AGIs $50k-75k, 27.0% for AGIs $75k-100k, 107.5% for AGIs $100k-200k, 825.0% for AGIs over 200k)
Ordinary dividends: $6,315 (reported on 7.2% of returns)
Here:
$6,315
State:
$8,028
(% of AGI for various income ranges: 5.1% for AGIs below $25k, 7.1% for AGIs $25k-50k, 26.6% for AGIs $50k-75k, 52.7% for AGIs $75k-100k, 295.7% for AGIs $100k-200k, 4265.0% for AGIs over 200k)
Net capital gain/loss in AGI: +$14,426 (reported on 8.0% of returns)
Here:
+$14,426
State:
+$25,238
(% of AGI for various income ranges: 1.6% for AGIs below $25k, 7.6% for AGIs $25k-50k, 25.7% for AGIs $50k-75k, 75.5% for AGIs $75k-100k, 325.7% for AGIs $100k-200k, 14813.7% for AGIs over 200k)
Profit/loss from business: +$7,627 (reported on 35.8% of returns)
Here:
+$7,627
State:
+$11,398
(% of AGI for various income ranges: 595.7% for AGIs below $25k, 264.4% for AGIs $25k-50k, 206.5% for AGIs $50k-75k, 254.5% for AGIs $75k-100k, 638.0% for AGIs $100k-200k, 5327.5% for AGIs over 200k)
Taxable individual retirement arrangement distribution: $23,061 (reported on 2.7% of returns)
20903:
$23,061
Maryland:
$20,944
(% of AGI for various income ranges: 14.4% for AGIs below $25k, 16.5% for AGIs $25k-50k, 39.0% for AGIs $50k-75k, 182.0% for AGIs $75k-100k, 483.6% for AGIs $100k-200k, 4295.0% for AGIs over 200k)
Self-employed (Keogh) retirement plans: $22,767 (reported on 0.2% of returns)
20903:
$22,767
Maryland:
$29,558
(% of AGI for various income ranges: 853.8% for AGIs over 200k)
Total itemized deductions: $26,742 (reported on 11.7% of returns)
Here:
$26,742
State:
$30,672
(% of AGI for various income ranges: 62.0% for AGIs below $25k, 296.7% for AGIs $25k-50k, 699.7% for AGIs $50k-75k, 1224.5% for AGIs $75k-100k, 2359.3% for AGIs $100k-200k, 7250.0% for AGIs over 200k)
Charity contributions: $8,976 (reported on 9.8% of returns)
Here:
$8,976
State:
$9,065
(% of AGI for various income ranges: 13.3% for AGIs below $25k, 92.9% for AGIs $25k-50k, 200.7% for AGIs $50k-75k, 287.3% for AGIs $75k-100k, 602.3% for AGIs $100k-200k, 2515.0% for AGIs over 200k)
Taxes paid: $6,977 (reported on 11.6% of returns)
20903:
$6,977
State:
$8,475
(% of AGI for various income ranges: 11.7% for AGIs below $25k, 59.6% for AGIs $25k-50k, 167.5% for AGIs $50k-75k, 383.4% for AGIs $75k-100k, 730.5% for AGIs $100k-200k, 1748.8% for AGIs over 200k)
Earned income credit: $2,305 (reported on 18.9% of returns)
Here:
$2,305
State:
$2,151
(% of AGI for various income ranges: 125.7% for AGIs below $25k, 74.9% for AGIs $25k-50k, 1.2% for AGIs $50k-75k)
Percentage of individuals using paid preparers for their 2020 taxes: 81.5%
Here:
81%
State:
90%
(% for various income ranges: 75.2% for AGIs below $25k, 86.1% for AGIs $25k-50k, 86.5% for AGIs $50k-75k, 88.2% for AGIs $75k-100k, 86.7% for AGIs $100k-200k, 88.5% for AGIs over 200k)
Averages for the 2012 tax year for zip code 20903, filed in 2013:
Average Adjusted Gross Income (AGI) in 2012: $38,600 (Individual Income Tax Returns)
Here:
$38,600
State:
$72,703
Salary/wage: $37,255 (reported on 81.0% of returns)
Here:
$37,255
State:
$62,228
(% of AGI for various income ranges: 76.3% for AGIs below $25k, 91.5% for AGIs $25k-50k, 85.9% for AGIs $50k-75k, 79.2% for AGIs $75k-100k, 73.6% for AGIs $100k-200k, 51.1% for AGIs over 200k)
Taxable interest for individuals: $962 (reported on 17.7% of returns)
This zip code:
$962
Maryland:
$1,413
(% of AGI for various income ranges: 0.2% for AGIs below $25k, 0.2% for AGIs $25k-50k, 0.5% for AGIs $50k-75k, 0.4% for AGIs $75k-100k, 0.7% for AGIs $100k-200k, 0.8% for AGIs over 200k)
Ordinary dividends: $6,512 (reported on 7.3% of returns)
Here:
$6,512
State:
$6,933
(% of AGI for various income ranges: 0.3% for AGIs below $25k, 0.2% for AGIs $25k-50k, 0.7% for AGIs $50k-75k, 1.4% for AGIs $75k-100k, 2.1% for AGIs $100k-200k, 3.6% for AGIs over 200k)
Net capital gain/loss in AGI: +$9,684 (reported on 5.4% of returns)
Here:
+$9,684
State:
+$14,830
(% of AGI for various income ranges: 0.2% for AGIs $75k-100k, 1.2% for AGIs $100k-200k, 8.4% for AGIs over 200k)
Profit/loss from business: +$7,679 (reported on 26.3% of returns)
Here:
+$7,679
State:
+$12,606
(% of AGI for various income ranges: 19.4% for AGIs below $25k, 2.6% for AGIs $25k-50k, 1.1% for AGIs $50k-75k, 3.1% for AGIs $75k-100k, 2.0% for AGIs $100k-200k, 4.5% for AGIs over 200k)
Taxable individual retirement arrangement distribution: $15,714 (reported on 3.2% of returns)
20903:
$15,714
Maryland:
$17,065
(% of AGI for various income ranges: 0.6% for AGIs below $25k, 0.4% for AGIs $25k-50k, 0.8% for AGIs $50k-75k, 1.3% for AGIs $75k-100k, 2.8% for AGIs $100k-200k, 2.6% for AGIs over 200k)
Self-employment retirement plans: $18,580 (reported on 0.4% of returns)
20903:
$18,580
Maryland:
$24,439
Total itemized deductions: $20,003 (28% of AGI, reported on 32.9% of returns)
Here:
$20,003
State:
$27,886
Here:
27.8% of AGI
State:
22.8% of AGI
(% of AGI for various income ranges: 9.8% for AGIs below $25k, 17.7% for AGIs $25k-50k, 20.4% for AGIs $50k-75k, 21.7% for AGIs $75k-100k, 19.4% for AGIs $100k-200k, 13.9% for AGIs over 200k)
Charity contributions: $3,406 (reported on 25.1% of returns)
Here:
$3,406
State:
$4,452
(% of AGI for various income ranges: 0.9% for AGIs below $25k, 2.1% for AGIs $25k-50k, 2.7% for AGIs $50k-75k, 3.2% for AGIs $75k-100k, 2.7% for AGIs $100k-200k, 2.0% for AGIs over 200k)
Taxes paid: $6,090 (reported on 32.7% of returns)
20903:
$6,090
State:
$11,690
(% of AGI for various income ranges: 1.3% for AGIs below $25k, 3.3% for AGIs $25k-50k, 5.4% for AGIs $50k-75k, 7.0% for AGIs $75k-100k, 8.1% for AGIs $100k-200k, 7.7% for AGIs over 200k)
Earned income credit: $2,387 (reported on 23.2% of returns)
Here:
$2,387
State:
$2,199
(% of AGI for various income ranges: 7.1% for AGIs below $25k, 1.2% for AGIs $25k-50k)
Percentage of individuals using paid preparers for their 2012 taxes: 65.5%
Here:
65%
State:
52%
(% for various income ranges: 68.8% for AGIs below $25k, 63.0% for AGIs $25k-50k, 65.1% for AGIs $50k-75k, 60.3% for AGIs $75k-100k, 54.4% for AGIs $100k-200k, 58.8% for AGIs over 200k)
Averages for the 2004 tax year for zip code 20903, filed in 2005:
Average Adjusted Gross Income (AGI) in 2004: $37,124 (Individual Income Tax Returns)
Here:
$37,124
State:
$60,339
Salary/wage: $34,778 (reported on 85.6% of returns)
Here:
$34,778
State:
$52,211
(% of AGI for various income ranges: 80.0% for AGIs below $10k, 86.8% for AGIs $10k-25k, 89.6% for AGIs $25k-50k, 80.8% for AGIs $50k-75k, 73.8% for AGIs $75k-100k, 69.2% for AGIs over 100k)
Taxable interest for individuals: $1,423 (reported on 30.0% of returns)
This zip code:
$1,423
Maryland:
$1,701
(% of AGI for various income ranges: 1.9% for AGIs below $10k, 0.6% for AGIs $10k-25k, 0.5% for AGIs $25k-50k, 1.3% for AGIs $50k-75k, 1.6% for AGIs $75k-100k, 1.8% for AGIs over 100k)
Taxable dividends: $4,458 (reported on 12.8% of returns)
Here:
$4,458
State:
$4,235
(% of AGI for various income ranges: 1.5% for AGIs below $10k, 0.3% for AGIs $10k-25k, 0.5% for AGIs $25k-50k, 1.1% for AGIs $50k-75k, 1.7% for AGIs $75k-100k, 3.4% for AGIs over 100k)
Net capital gain/loss: +$5,436 (reported on 10.2% of returns)
Here:
+$5,436
State:
+$15,888
(% of AGI for various income ranges: -1.0% for AGIs below $10k, -0.0% for AGIs $10k-25k, 0.3% for AGIs $25k-50k, 0.2% for AGIs $50k-75k, 0.7% for AGIs $75k-100k, 4.8% for AGIs over 100k)
Profit/loss from business: +$8,424 (reported on 19.2% of returns)
Here:
+$8,424
State:
+$12,221
(% of AGI for various income ranges: 26.4% for AGIs below $10k, 8.2% for AGIs $10k-25k, 2.2% for AGIs $25k-50k, 1.6% for AGIs $50k-75k, 1.5% for AGIs $75k-100k, 5.4% for AGIs over 100k)
IRA payment deduction: $2,752 (reported on 1.7% of returns)
20903:
$2,752
Maryland:
$2,968
(% of AGI for various income ranges: 0.2% for AGIs $10k-25k, 0.1% for AGIs $25k-50k, 0.2% for AGIs $50k-75k, 0.1% for AGIs $75k-100k, 0.1% for AGIs over 100k)
Self-employed pension: $11,197 (reported on 0.7% of returns)
Here:
$11,197
Maryland:
$17,155
Total itemized deductions: $18,923 (32% of AGI, reported on 43.5% of returns)
Here:
$18,923
State:
$22,960
Here:
31.9% of AGI
State:
23.3% of AGI
(% of AGI for various income ranges: 8.4% for AGIs below $10k, 16.2% for AGIs $10k-25k, 28.4% for AGIs $25k-50k, 24.7% for AGIs $50k-75k, 21.9% for AGIs $75k-100k, 18.6% for AGIs over 100k)
Charity contributions deductions: $3,439 (5% of AGI, reported on 36.9% of returns)
Here:
$3,439
State:
$4,031
Here:
5.4% of AGI
State:
3.9% of AGI
(% of AGI for various income ranges: 0.7% for AGIs below $10k, 2.0% for AGIs $10k-25k, 3.6% for AGIs $25k-50k, 4.2% for AGIs $50k-75k, 3.6% for AGIs $75k-100k, 3.6% for AGIs over 100k)
Total tax: $4,843 (reported on 70.0% of returns)
20903:
$4,843
State:
$10,167
(% of AGI for various income ranges: 5.3% for AGIs below $10k, 3.5% for AGIs $10k-25k, 5.1% for AGIs $25k-50k, 8.0% for AGIs $50k-75k, 10.7% for AGIs $75k-100k, 16.5% for AGIs over 100k)
Earned income credit: $1,796 (reported on 24.4% of returns)
Here:
$1,796
State:
$1,700
Percentage of individuals using paid preparers for their 2004 taxes: 62.8%
Here:
63%
State:
55%
(% for various income ranges: 61.0% for AGIs below $10k, 67.7% for AGIs $10k-25k, 62.9% for AGIs $25k-50k, 61.3% for AGIs $50k-75k, 56.7% for AGIs $75k-100k, 51.0% for AGIs over 100k)
Likely homosexual households (counted as self-reported same-sex unmarried-partner households)
Lesbian couples: 0.1% of all households
Gay men: 0.0% of all households
Household received Food Stamps/SNAP in the past 12 months: 1,207 Household did not receive Food Stamps/SNAP in the past 12 months: 6,063
Women who had a birth in the past 12 months: 309 (135 now married, 171 unmarried) Women who did not have a birth in the past 12 months: 5,401 (2,164 now married, 3,237 unmarried)
Housing units in zip code 20903 with a mortgage: 2,067 (152 second mortgage, 104 both second mortgage and home equity loan) Houses without a mortgage: 36
Median monthly owner costs for units with a mortgage: $2,298 Median monthly owner costs for units without a mortgage: $724
Residents with income below the poverty level in 2022:
This zip code:
14.9%
Whole state:
9.6%
Residents with income below 50% of the poverty level in 2022:
This zip code:
7.4%
Whole state:
4.7%
Median number of rooms in houses and condos:
Here:
7.5
State:
7.3
Median number of rooms in apartments:
Here:
4.0
State:
4.2
Notable locations in this zip code not listed on our city pages
Notable locations in zip code 20903: White Oak Golf Course (A), Hillandale Volunteer Fire Department Station 12 (B), Hillandale Fire Station Company 12 (C), Kirkland Center (D), Hoehler Residence Hall (E), Dining Hall (F), Barrett Residence Hall (G). Display/hide their locations on the map
Churches in zip code 20903 include: Church of Our Saviour (A), Clifton Park Baptist Church (B), Good Shepherd United Methodist Church (C), Saint Camillus Catholic Church (D), Unitarian Universalist Church of Silver Spring (E), International Foursquare Gospel Church of Silver Spring (F). Display/hide their locations on the map
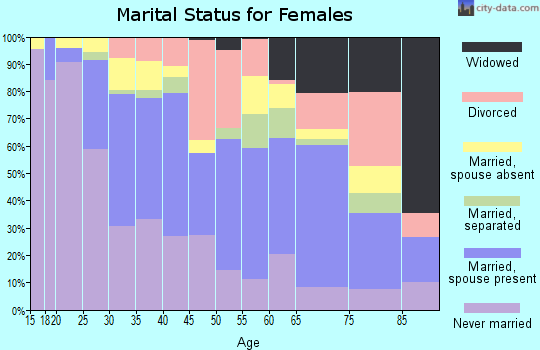
3,770 married couples with children.
2,475 single-parent households (730 men, 1,745 women).
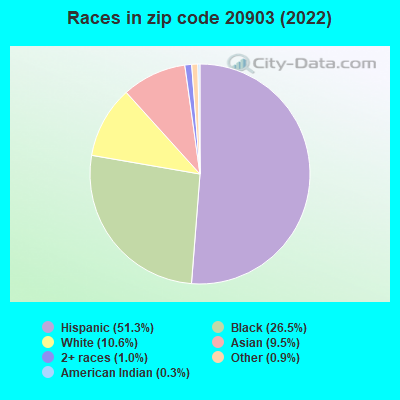
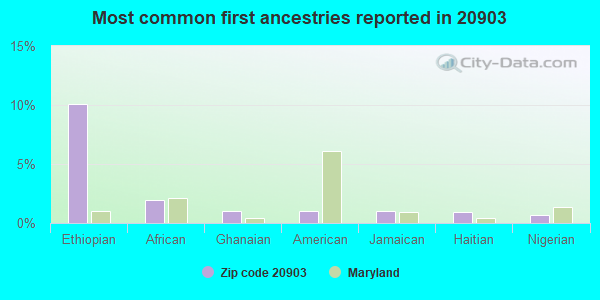
25.4% of residents of 20903 zip code speak English at home.
51.0% of residents speak Spanish at home (43% very well, 16% well, 24% not well, 16% not at all).
9.8% of residents speak other Indo-European language at home (57% very well, 28% well, 13% not well, 2% not at all).
4.9% of residents speak Asian or Pacific Island language at home (26% very well, 16% well, 54% not well, 4% not at all).
13.3% of residents speak other language at home (77% very well, 15% well, 5% not well, 3% not at all).
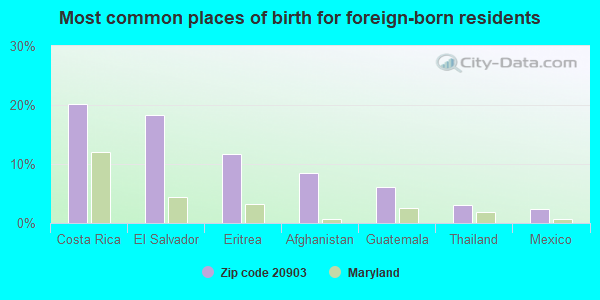
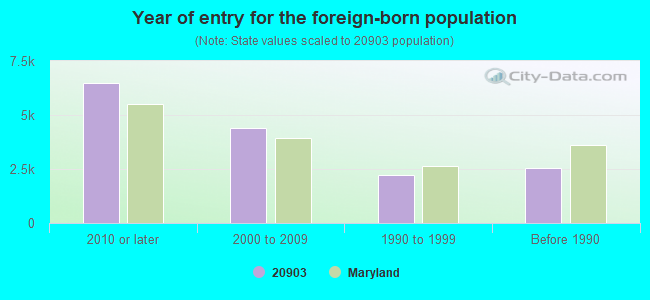
Foreign born population: 14,738 (58.2%) (38.9% of them are naturalized citizens)
Major facilities with environmental interests located in this zip code:
COCA COLA BOTTLING COMPANY INCORPORATED MID ATLANTIC (1710 ELTON ROAD in SILVER SPRING, MD)
AIR MINOR (AIRS/AFS) STATE MASTER (Maryland Permits tracking) - NPDES STORMWATER PERMIT STATE MASTER (Maryland Air Emissions Database) - AIR MINOR Small Quantity Generators, between 100 kg and 1000 kg of hazardous waste/month (Resource Conservation and Recovery Act (tracking hazardous waste)) - notification TRI REPORTER (Tracking of toxic chemicals releasing facilities) Business SIC classification: BOTTLED AND CANNED SOFT DRINKS AND CARBONATED WATERS; GROCERIES AND RELATED PRODUCTS Organizations: OPERNAME (CONTACT/OPERATOR)
, COCA-COLA ENTERPRISES (CONTACT/OWNER)
Alternative names: COCA-COLA BOTTLING CO. - SILVER SPRING, COCA-COLA ENTERPRISES INC., MID-ATLANTIC CORPORATION, MID-ATLANTIC COCA-COLA
BROAD ACRES ELEMENTARY SCHOOL (710 BEACON ROAD in SILVER SPRING, MD)
AIR MINOR (AIRS/AFS) STATE MASTER (Maryland Air Emissions Database) - AIR MINOR (National Center for Education Statistics) - STATE ID-150304 Conditionally Exempt Small Quantity Generators, less than 100 kg/month of hazardous waste (Resource Conservation and Recovery Act (tracking hazardous waste)) - notification Business SIC classification: ELEMENTARY AND SECONDARY SCHOOLS Organizations: MONTGOMERY CTY PUB SCHLS (CONTACT/OWNER)
, MONTGOMERY COUNTY PUBLIC SCHOOLS (SCHOOL DISTRICT)
Alternative names: BROAD ACRES ES
NEW HAMPSHIRE ESTATES ELEMENTARY SCHOOL (8720 CARROLL AVENUE in SILVER SPRING, MD)
AIR MINOR (AIRS/AFS) STATE MASTER (Maryland Air Emissions Database) - AIR MINOR (National Center for Education Statistics) - STATE ID-150791 Business SIC classification: ELEMENTARY AND SECONDARY SCHOOLS Organizations: MONTGOMERY COUNTY PUBLIC SCHOOLS (SCHOOL DISTRICT)
CLIFTON PARK EXXON (701 UNIVERSITY BOULEVARD in SILVER SPRING, MD)
AIR MINOR (AIRS/AFS) STATE MASTER (Maryland Air Emissions Database) - AIR MINOR Conditionally Exempt Small Quantity Generators, less than 100 kg/month of hazardous waste (Resource Conservation and Recovery Act (tracking hazardous waste)) - notification Business SIC classification: GASOLINE SERVICE STATIONS Organizations: OPERNAME (CONTACT/OPERATOR)
, EXXONMOBIL CORP (CONTACT/OWNER)
Alternative names: EXXON - 701 UNIVERSITY BOULEVARD, EXXON CO USA #25410, EXXON RAS 25410
EXXON 10206 NEW HAMPSHIRE AVENUE (10206 NEW HAMPSHIRE AVENUE in SILVER SPRING, MD)
AIR MINOR (AIRS/AFS) STATE MASTER (Maryland Air Emissions Database) - AIR MINOR Conditionally Exempt Small Quantity Generators, less than 100 kg/month of hazardous waste (Resource Conservation and Recovery Act (tracking hazardous waste)) - notification Business SIC classification: GASOLINE SERVICE STATIONS Organizations: OPERNAME (CONTACT/OPERATOR)
, EXXONMOBIL CORP (CONTACT/OWNER)
Alternative names: EXXON CO USA #24953, EXXON RAS 24953
CENTER FOR HANDICAPPED (10501 NEW HAMPSHIRE AVENUE in SILVER SPRING, MD)
AIR MINOR (AIRS/AFS) STATE MASTER (Maryland Air Emissions Database) - AIR MINOR Conditionally Exempt Small Quantity Generators, less than 100 kg/month of hazardous waste (Resource Conservation and Recovery Act (tracking hazardous waste)) - notification Business SIC classification: ELEMENTARY AND SECONDARY SCHOOLS Organizations: MONTGOMERY COUNTY SCHOOLS (CONTACT/OWNER)
Alternative names: CHI CENTERS
AFL CIO LABOR STUDIES CENTER (10000 NEW HAMPSHIRE AVENUE in SILVER SPRING, MD)
AIR MINOR (AIRS/AFS) STATE MASTER (Maryland Air Emissions Database) - AIR MINOR Business SIC classification: LABOR UNIONS AND SIMILAR LABOR ORGANIZATIONS
BEACON ROAD 524 (524 BEACON ROAD in SILVER SPRING, MD)
AIR MINOR (AIRS/AFS) STATE MASTER (Maryland Air Emissions Database) - AIR MINOR Business SIC classification: OPERATORS OF APARTMENT BUILDINGS
BP - 10228 NEW HAMPSHIRE AVENUE (10228 NEW HAMPSHIRE AVENUE in SILVER SPRING, MD)
AIR MINOR (AIRS/AFS) STATE MASTER (Maryland Air Emissions Database) - AIR MINOR Business SIC classification: GASOLINE SERVICE STATIONS Alternative names: AMOCO 10228 NEW HAMPSHIRE AVENUE
CARROLL AVENUE 8737 (8737 CARROLL AVENUE in SILVER SPRING, MD)
AIR MINOR (AIRS/AFS) STATE MASTER (Maryland Air Emissions Database) - AIR MINOR Business SIC classification: OPERATORS OF APARTMENT BUILDINGS
MOUNT PISGAH ROAD 9700 9710 (9700 MT. PISGAH ROAD in SILVER SPRING, MD)
AIR MINOR (AIRS/AFS) STATE MASTER (Maryland Air Emissions Database) - AIR MINOR Business SIC classification: OPERATORS OF APARTMENT BUILDINGS
MOUNT PISGAH ROAD 9727 (9727 MT. PISGAH ROAD in SILVER SPRING, MD)
AIR MINOR (AIRS/AFS) STATE MASTER (Maryland Air Emissions Database) - AIR MINOR Business SIC classification: OPERATORS OF APARTMENT BUILDINGS
MOUNT PISGAH ROAD 9737 (9737 MT. PISGAH ROAD in SILVER SPRING, MD)
AIR MINOR (AIRS/AFS) STATE MASTER (Maryland Air Emissions Database) - AIR MINOR Business SIC classification: OPERATORS OF APARTMENT BUILDINGS
Housing units lacking complete plumbing facilities: 0.7% Housing units lacking complete kitchen facilities: 0.2%
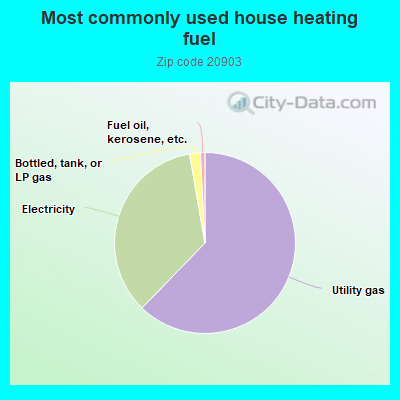
61.7%Utility gas
34.7%Electricity
1.9%Bottled, tank, or LP gas
0.8%Fuel oil, kerosene, etc.
Population in 1990: 16,724. Population change in the 1990s: +5,955 (+35.6%).
Place of birth for U.S.-born residents:
This state: 6,698
Northeast: 1,097
Midwest: 299
South: 2,252
West: 252
56% of the 20903 zip code residents lived in the same house 5 years ago. Out of people who lived in different houses, 53% lived in this county. Out of people who lived in different counties, 50% lived in Maryland.
90% of the 20903 zip code residents lived in the same house 1 year ago. Out of people who lived in different houses, 60% moved from this county. Out of people who lived in different houses, 16% moved from different county within same state. Out of people who lived in different houses, 12% moved from different state. Out of people who lived in different houses, 11% moved from abroad.
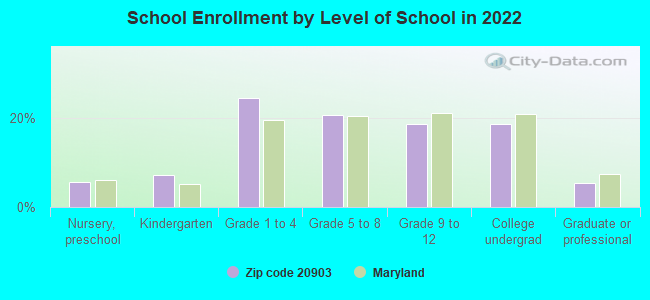
Private vs. public school enrollment:
Students in private schools in grades 1 to 8 (elementary and middle school): 156
Here:
4.6%
Maryland:
15.2%
Students in private schools in grades 9 to 12 (high school): 76
Here:
5.5%
Maryland:
14.4%
Students in private undergraduate colleges: 314
Here:
22.6%
Maryland:
20.2%
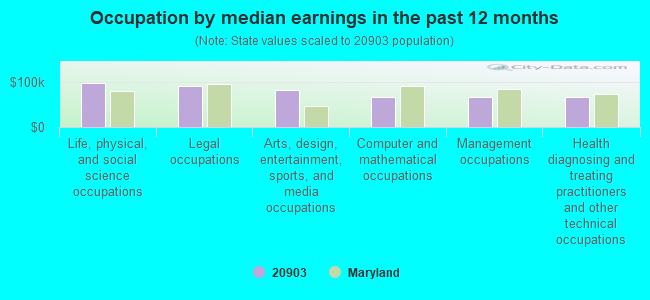
Occupation by median earnings in the past 12 months ($)
97,239Life, physical, and social science occupations
90,745Legal occupations
81,537Arts, design, entertainment, sports, and media occupations
66,454Computer and mathematical occupations
66,306Management occupations
66,000Health diagnosing and treating practitioners and other technical occupations
Companies with federal contracts located in this zip code (SILVER SPRING, MD):
CHI CENTERS, INC (10501 NEW HAMPSHIRE AVE; small business) : $4,729,928 in 69 contractsfrom 2000 to 2006
Contracts for Custodial Janitorial Services, Mailing and Distribution Services, Construction of Structures and Facilities -- Hospitals and Infirmaries, Maintenance, Repair or Alteration of Real Property -- Other Utilities, and moreby Navy, Army, Food and Drug Administration Signed by year:2000: $650,975; 2001: $1,122,213; 2002: $334,995; 2003: $894,964; 2004: $944,394; 2005: $527,751; 2006: $254,636.
Biggest contracts:
$419,167 with Navy for Custodial Janitorial Services. Signed on 2004-01-29. Completion date: 2005-01-31.
$418,401, same as above.Signed on 2003-02-01. Completion date: 2008-01-31.
$409,488, same as above.Signed on 2001-11-15. Completion date: 2002-11-15.
$339,857, same as above.Signed on 2000-11-15. Completion date: 2001-11-15.
IMPERIUM INC (1738 ELTON ROAD, #218; small business) : $2,643,261 in 16 contractsfrom 2000 to 2005
Contracts for Defense Electronics and Communication Equipment -- Applied Research and Exploratory Development (R&D), Defense Missile and Space Systems -- Basic Research (R&D), Space Flight -- Advanced Development (R&D), Defense Missile and Space Systems -- Management and Support (R&D), and moreby Navy, Air Force, NASA Signed by year:2000: $207,884; 2001: $70,000; 2002: $473,997; 2003: $740,714; 2004: $804,245; 2005: $346,421; 2006: $0.
Biggest contracts:
$400,000 with Navy for Defense Electronics and Communication Equipment -- Applied Research and Exploratory Development (R&D). Signed on 2004-07-07. Completion date: 2006-07-07.
$375,000 with Air Force for Defense Missile and Space Systems -- Basic Research (R&D). Signed on 2003-05-30. Completion date: 2005-08-30.
$346,421 with Navy for Defense Electronics and Communication Equipment -- Applied Research and Exploratory Development (R&D). Signed on 2005-05-13. Completion date: 2006-07-07.
$342,133 with Air Force for Defense Missile and Space Systems -- Basic Research (R&D). Signed on 2004-02-09. Completion date: 2005-08-30.
SANAZ SADAGHIANI (8830 PONY BR RD APT 1212; small business) : $335,781 in 4 contractsfrom 2002 to 2005
$87,155 with Departmental Offices for Personal Services Contracts. Taking place in DC. Signed on 2005-05-23. Completion date: 2006-05-27.
$85,949, same as above.Signed on 2004-05-27. Effective on 2004-05-28. Completion date: 2005-05-27.
$83,000, same as above.Signed on 2002-05-15. Completion date: 2003-05-15.
$79,677, same as above.Signed on 2003-05-15. Completion date: 2004-05-15.
NEELAM ENTERPRISES INC (1829 POWDERMILL LN; small business) : $310,780 in 8 contractsin 2002
Contracts for Valves, Nonpowered, Miscellaneous Communication Equipment, Antennas, Waveguides, and Related Equipment, Power and Hand Pumps, and moreby Defense Logistics Agency Signed by year:2000: $0; 2001: $0; 2002: $310,780; 2003: $0; 2004: $0; 2005: $0; 2006: $0.
Biggest contracts:
$96,875 with Defense Logistics Agency for Valves, Nonpowered. Signed on 2002-03-25. Completion date: 2003-03-25.
$44,550 with Defense Logistics Agency for Miscellaneous Communication Equipment. Signed on 2002-06-07. Completion date: 2003-02-12.
$34,195 with Defense Logistics Agency for Antennas, Waveguides, and Related Equipment. Signed on 2002-04-05. Completion date: 2002-07-14.
$29,315 with Defense Logistics Agency for Power and Hand Pumps. Signed on 2002-06-19. Completion date: 2002-12-01.
PARK DREAMS INTERNATIONAL, LTD (10321 ROYAL ROAD)
$118,500 with Army for Filters and Networks. Signed on 2001-09-27. Completion date: 2001-10-31.
FREDA L KROSNICK, PATENT ATTO (1118 CRESTHAVEN DR; small business) : $31,077 in 3 contractsfrom 2005 to 2006
$50,000 with Army for Legal Services. Signed on 2005-03-07. Completion date: 2007-12-16.
$0, same as above.Signed on 2006-03-27. Completion date: 2007-12-16.
-$18,923, same as above.Signed on 2006-03-27. Completion date: 2007-12-16.
EDWIN DILL (9001 NEW HAMPSHIRE AVE) : $14,824 in 4 contractsfrom 2003 to 2004
$6,485 with Navy for Chaplain Services. Taking place in VA. Signed on 2003-04-25. Completion date: 2004-04-24.
$5,600, same as above.Signed on 2004-12-09. Completion date: 2005-09-30.
$5,600, same as above.Signed on 2003-10-20. Completion date: 2004-09-30.
-$2,861, same as above.Signed on 2004-06-25. Completion date: 2004-06-25.
Top industries in this zip code by the number of employees in 2005:
Health Care and Social Assistance: Services for the Elderly and Persons with Disabilities (250-499 employees: 1 establishment, 20-49 employees: 1 establishment)
Construction: New Housing Operative Builders (100-249: 1, 50-99: 1)
Real Estate and Rental and Leasing: Residential Property Managers (50-99: 1, 20-49: 2, 10-19: 2, 5-9: 2, 1-4: 2)
Health Care and Social Assistance: Home Health Care Services (100-249: 1)
Health Care and Social Assistance: Offices of Dentists (10-19: 4, 5-9: 3, 1-4: 4)
2004 - 2018 National Fire Incident Reporting System (NFIRS) incidents
According to the data from the years 2004 - 2018 the average number of fires per year is 30. The highest number of reported fire incidents - 49 took place in 2013, and the least - 13 in 2004. The data has an increasing trend.
When looking into fire subcategories, the most reports belonged to: Structure Fires (36.9%), and Mobile Property/Vehicle Fires (30.9%).
Fire incident types reported to NFIRS in Zip Code 20903
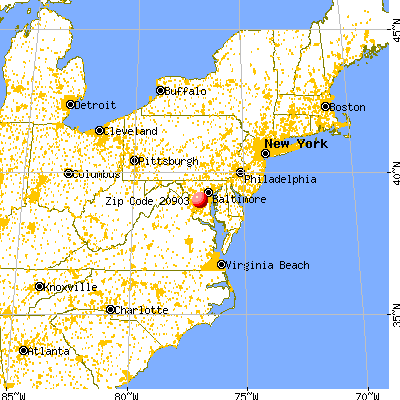


 Nearest zip codes: 20783, 20901, 20912, 20904, 20742, 20740.
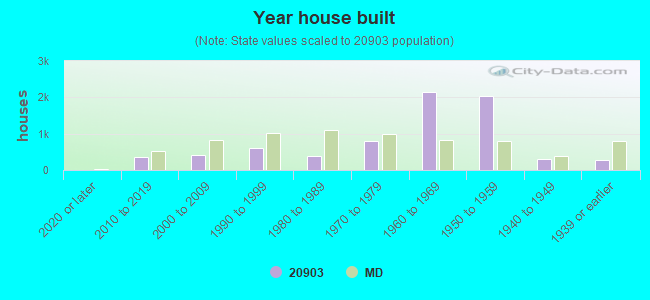


 According to the data from the years 2004 - 2018 the average number of fires per year is 30. The highest number of reported fire incidents - 49 took place in 2013, and the least - 13 in 2004. The data has an increasing trend.
 When looking into fire subcategories, the most reports belonged to: Structure Fires (36.9%), and Mobile Property/Vehicle Fires (30.9%).