Estimated zip code population in 2022: 9,223 Zip code population in 2010: 9,962 Zip code population in 2000: 10,283
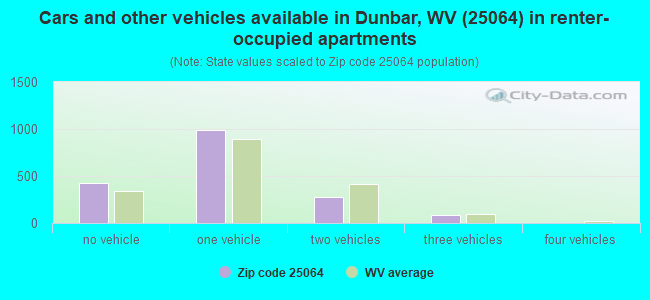
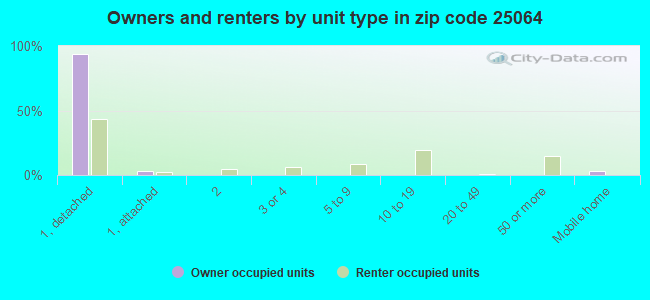
Houses and condos: 5,246 Renter-occupied apartments: 1,786
% of renters here:
39%
State:
26%
March 2022 cost of living index in zip code 25064: 85.6 (less than average, U.S. average is 100)
Land area: 6.9 sq. mi. Water area: 0.4 sq. mi.
Population density: 1,345 people per square mile
(low).
OSM Map
General Map
Google Map
MSN Map
OSM Map
General Map
Google Map
MSN Map
OSM Map
General Map
Google Map
MSN Map
OSM Map
General Map
Google Map
MSN Map
Please wait while loading the map...
Real estate property taxes paid for housing units in 2022:
This zip code:
0.6% ($801)
West Virginia:
0.5% ($821)
Median real estate property taxes paid for housing units with mortgages in 2022: $957 (0.7%) Median real estate property taxes paid for housing units with no mortgage in 2022: $721 (0.6%)
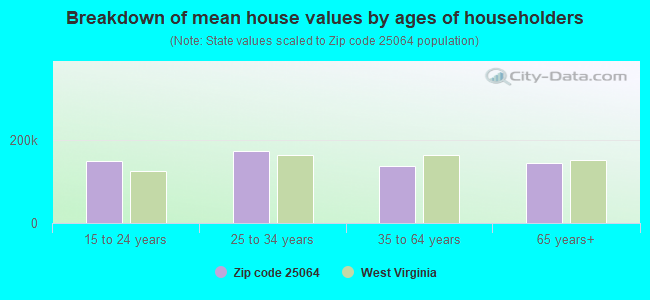
Estimated median house/condo value in 2022: $127,654
25064:
$127,654
West Virginia:
$155,100
According to our research of West Virginia and other state lists, there were 24 registered sex offenders living in 25064 zip code as of April 27, 2024. The ratio of all residents to sex offenders in zip code 25064 is 396 to 1. The ratio of registered sex offenders to all residents in this zip code is near the state average.
Median resident age:
This zip code:
44.3 years
West Virginia median age:
42.9 years
Average household size:
This zip code:
2.0 people
West Virginia:
2.3 people
Averages for the 2020 tax year for zip code 25064, filed in 2021:
Average Adjusted Gross Income (AGI) in 2020: $43,401 (Individual Income Tax Returns)
Here:
$43,401
State:
$56,292
Salary/wage: $37,932 (reported on 82.5% of returns)
Here:
$37,932
State:
$49,093
(% of AGI for various income ranges: 1027.0% for AGIs below $25k, 3381.3% for AGIs $25k-50k, 6030.9% for AGIs $50k-75k, 8953.2% for AGIs $75k-100k, 14447.5% for AGIs $100k-200k)
Taxable interest for individuals: $935 (reported on 19.5% of returns)
This zip code:
$935
West Virginia:
$1,141
(% of AGI for various income ranges: 8.2% for AGIs below $25k, 13.7% for AGIs $25k-50k, 27.0% for AGIs $50k-75k, 37.7% for AGIs $75k-100k, 130.5% for AGIs $100k-200k)
Ordinary dividends: $3,744 (reported on 9.9% of returns)
Here:
$3,744
State:
$5,456
(% of AGI for various income ranges: 11.2% for AGIs below $25k, 13.9% for AGIs $25k-50k, 44.6% for AGIs $50k-75k, 68.6% for AGIs $75k-100k, 475.0% for AGIs $100k-200k)
Net capital gain/loss in AGI: +$4,330 (reported on 7.6% of returns)
Here:
+$4,330
State:
+$11,656
(% of AGI for various income ranges: 9.6% for AGIs $25k-50k, 20.7% for AGIs $50k-75k, 103.2% for AGIs $75k-100k, 367.0% for AGIs $100k-200k)
Profit/loss from business: +$8,292 (reported on 8.5% of returns)
Here:
+$8,292
State:
+$12,084
(% of AGI for various income ranges: 37.2% for AGIs below $25k, 70.6% for AGIs $25k-50k, 80.2% for AGIs $50k-75k, 200.5% for AGIs $75k-100k, 490.0% for AGIs $100k-200k)
Taxable individual retirement arrangement distribution: $12,935 (reported on 7.1% of returns)
25064:
$12,935
West Virginia:
$15,311
(% of AGI for various income ranges: 35.2% for AGIs below $25k, 76.9% for AGIs $25k-50k, 187.8% for AGIs $50k-75k, 334.5% for AGIs $75k-100k, 545.0% for AGIs $100k-200k)
Total itemized deductions: $29,100 (reported on 1.8% of returns)
Here:
$29,100
State:
$31,950
(% of AGI for various income ranges: 40.6% for AGIs below $25k, 129.3% for AGIs $50k-75k, 588.5% for AGIs $100k-200k)
Charity contributions: $9,786 (reported on 1.6% of returns)
Here:
$9,786
State:
$12,364
(% of AGI for various income ranges: 24.4% for AGIs $25k-50k, 209.5% for AGIs $100k-200k)
Taxes paid: $6,562 (reported on 1.8% of returns)
25064:
$6,562
State:
$7,665
(% of AGI for various income ranges: 3.8% for AGIs below $25k, 24.6% for AGIs $50k-75k, 180.0% for AGIs $100k-200k)
Earned income credit: $2,175 (reported on 21.4% of returns)
Here:
$2,175
State:
$2,258
(% of AGI for various income ranges: 95.3% for AGIs below $25k, 65.9% for AGIs $25k-50k)
Percentage of individuals using paid preparers for their 2020 taxes: 91.7%
Here:
92%
State:
93%
(% for various income ranges: 92.4% for AGIs below $25k, 93.2% for AGIs $25k-50k, 90.3% for AGIs $50k-75k, 87.5% for AGIs $75k-100k, 87.5% for AGIs $100k-200k, 100.0% for AGIs over 200k)
Averages for the 2012 tax year for zip code 25064, filed in 2013:
Average Adjusted Gross Income (AGI) in 2012: $39,480 (Individual Income Tax Returns)
Here:
$39,480
State:
$48,628
Salary/wage: $34,854 (reported on 85.5% of returns)
Here:
$34,854
State:
$42,328
(% of AGI for various income ranges: 77.1% for AGIs below $25k, 80.7% for AGIs $25k-50k, 77.5% for AGIs $50k-75k, 76.0% for AGIs $75k-100k, 74.8% for AGIs $100k-200k, 50.5% for AGIs over 200k)
Taxable interest for individuals: $1,325 (reported on 23.2% of returns)
This zip code:
$1,325
West Virginia:
$1,211
(% of AGI for various income ranges: 1.0% for AGIs below $25k, 0.6% for AGIs $25k-50k, 0.7% for AGIs $50k-75k, 0.7% for AGIs $75k-100k, 0.8% for AGIs $100k-200k, 1.2% for AGIs over 200k)
Ordinary dividends: $2,775 (reported on 12.2% of returns)
Here:
$2,775
State:
$4,262
(% of AGI for various income ranges: 0.7% for AGIs below $25k, 0.7% for AGIs $25k-50k, 0.6% for AGIs $50k-75k, 0.6% for AGIs $75k-100k, 1.5% for AGIs $100k-200k, 1.7% for AGIs over 200k)
Net capital gain/loss in AGI: +$2,000 (reported on 7.2% of returns)
Here:
+$2,000
State:
+$8,875
(% of AGI for various income ranges: 0.2% for AGIs $75k-100k, 0.8% for AGIs $100k-200k, 3.3% for AGIs over 200k)
Profit/loss from business: +$10,000 (reported on 7.9% of returns)
Here:
+$10,000
State:
+$13,636
(% of AGI for various income ranges: 3.4% for AGIs below $25k, 1.4% for AGIs $25k-50k, 1.2% for AGIs $50k-75k, 1.4% for AGIs $75k-100k, 3.9% for AGIs $100k-200k)
Taxable individual retirement arrangement distribution: $10,975 (reported on 8.5% of returns)
25064:
$10,975
West Virginia:
$11,787
(% of AGI for various income ranges: 2.1% for AGIs below $25k, 1.8% for AGIs $25k-50k, 2.4% for AGIs $50k-75k, 2.9% for AGIs $75k-100k, 4.1% for AGIs $100k-200k)
Total itemized deductions: $16,645 (18% of AGI, reported on 14.1% of returns)
Here:
$16,645
State:
$21,148
Here:
18.4% of AGI
State:
18.1% of AGI
(% of AGI for various income ranges: 2.8% for AGIs below $25k, 3.6% for AGIs $25k-50k, 4.9% for AGIs $50k-75k, 6.3% for AGIs $75k-100k, 11.2% for AGIs $100k-200k, 9.8% for AGIs over 200k)
Charity contributions: $4,511 (reported on 9.8% of returns)
Here:
$4,511
State:
$4,508
(% of AGI for various income ranges: 0.2% for AGIs below $25k, 0.5% for AGIs $25k-50k, 1.1% for AGIs $50k-75k, 1.4% for AGIs $75k-100k, 2.5% for AGIs $100k-200k, 1.2% for AGIs over 200k)
Taxes paid: $5,802 (reported on 14.1% of returns)
25064:
$5,802
State:
$8,103
(% of AGI for various income ranges: 0.3% for AGIs below $25k, 0.7% for AGIs $25k-50k, 1.5% for AGIs $50k-75k, 2.4% for AGIs $75k-100k, 4.5% for AGIs $100k-200k, 5.7% for AGIs over 200k)
Earned income credit: $2,075 (reported on 22.8% of returns)
Here:
$2,075
State:
$2,140
(% of AGI for various income ranges: 6.4% for AGIs below $25k, 0.9% for AGIs $25k-50k)
Percentage of individuals using paid preparers for their 2012 taxes: 40.3%
Here:
40%
State:
49%
(% for various income ranges: 39.5% for AGIs below $25k, 38.7% for AGIs $25k-50k, 38.5% for AGIs $50k-75k, 43.8% for AGIs $75k-100k, 50.0% for AGIs $100k-200k, 75.0% for AGIs over 200k)
Averages for the 2004 tax year for zip code 25064, filed in 2005:
Average Adjusted Gross Income (AGI) in 2004: $33,788 (Individual Income Tax Returns)
Here:
$33,788
State:
$37,498
Salary/wage: $30,865 (reported on 84.9% of returns)
Here:
$30,865
State:
$33,645
(% of AGI for various income ranges: 83.9% for AGIs below $10k, 74.2% for AGIs $10k-25k, 81.7% for AGIs $25k-50k, 80.4% for AGIs $50k-75k, 81.5% for AGIs $75k-100k, 63.5% for AGIs over 100k)
Taxable interest for individuals: $1,639 (reported on 36.5% of returns)
This zip code:
$1,639
West Virginia:
$1,465
(% of AGI for various income ranges: 5.2% for AGIs below $10k, 2.8% for AGIs $10k-25k, 1.3% for AGIs $25k-50k, 1.5% for AGIs $50k-75k, 1.3% for AGIs $75k-100k, 1.9% for AGIs over 100k)
Taxable dividends: $1,698 (reported on 16.7% of returns)
Here:
$1,698
State:
$2,913
(% of AGI for various income ranges: 1.2% for AGIs below $10k, 1.0% for AGIs $10k-25k, 0.5% for AGIs $25k-50k, 0.6% for AGIs $50k-75k, 0.7% for AGIs $75k-100k, 1.8% for AGIs over 100k)
Net capital gain/loss: +$4,794 (reported on 10.6% of returns)
Here:
+$4,794
State:
+$6,331
(% of AGI for various income ranges: -0.5% for AGIs below $10k, 0.2% for AGIs $10k-25k, 0.3% for AGIs $25k-50k, 0.1% for AGIs $50k-75k, 0.7% for AGIs $75k-100k, 8.5% for AGIs over 100k)
Profit/loss from business: +$7,494 (reported on 9.9% of returns)
Here:
+$7,494
State:
+$11,074
(% of AGI for various income ranges: 3.8% for AGIs below $10k, 3.1% for AGIs $10k-25k, 1.4% for AGIs $25k-50k, 1.6% for AGIs $50k-75k, 1.5% for AGIs $75k-100k, 3.8% for AGIs over 100k)
IRA payment deduction: $2,573 (reported on 2.2% of returns)
25064:
$2,573
West Virginia:
$2,796
(% of AGI for various income ranges: 0.1% for AGIs $10k-25k, 0.2% for AGIs $25k-50k, 0.2% for AGIs $50k-75k, 0.3% for AGIs $75k-100k)
Total itemized deductions: $13,785 (20% of AGI, reported on 16.3% of returns)
Here:
$13,785
State:
$16,976
Here:
19.8% of AGI
State:
19.0% of AGI
(% of AGI for various income ranges: 2.4% for AGIs below $10k, 3.2% for AGIs $10k-25k, 5.3% for AGIs $25k-50k, 6.4% for AGIs $50k-75k, 10.8% for AGIs $75k-100k, 10.0% for AGIs over 100k)
Charity contributions deductions: $3,072 (4% of AGI, reported on 13.4% of returns)
Here:
$3,072
State:
$3,529
Here:
4.2% of AGI
State:
3.7% of AGI
(% of AGI for various income ranges: 0.6% for AGIs $10k-25k, 0.8% for AGIs $25k-50k, 1.1% for AGIs $50k-75k, 2.2% for AGIs $75k-100k, 2.0% for AGIs over 100k)
Total tax: $4,358 (reported on 73.6% of returns)
25064:
$4,358
State:
$5,372
(% of AGI for various income ranges: 1.5% for AGIs below $10k, 3.9% for AGIs $10k-25k, 7.4% for AGIs $25k-50k, 10.0% for AGIs $50k-75k, 11.9% for AGIs $75k-100k, 17.3% for AGIs over 100k)
Earned income credit: $1,676 (reported on 19.5% of returns)
Here:
$1,676
State:
$1,662
Percentage of individuals using paid preparers for their 2004 taxes: 51.0%
Here:
51%
State:
55%
(% for various income ranges: 49.1% for AGIs below $10k, 53.0% for AGIs $10k-25k, 48.8% for AGIs $25k-50k, 50.7% for AGIs $50k-75k, 53.9% for AGIs $75k-100k, 58.1% for AGIs over 100k)
Household received Food Stamps/SNAP in the past 12 months: 623 Household did not receive Food Stamps/SNAP in the past 12 months: 3,978
Women who had a birth in the past 12 months: 81 (59 now married, 22 unmarried) Women who did not have a birth in the past 12 months: 2,075 (527 now married, 1,550 unmarried)
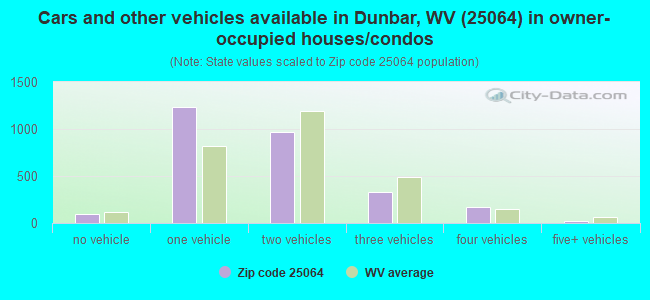
Housing units in zip code 25064 with a mortgage: 1,180 (44 second mortgage, 30 both second mortgage and home equity loan) Houses without a mortgage: 37
Median monthly owner costs for units with a mortgage: $1,029 Median monthly owner costs for units without a mortgage: $392
Residents with income below the poverty level in 2022:
This zip code:
16.5%
Whole state:
17.9%
Residents with income below 50% of the poverty level in 2022:
This zip code:
7.5%
Whole state:
9.7%
Median number of rooms in houses and condos:
Here:
6.2
State:
6.5
Median number of rooms in apartments:
Here:
4.6
State:
4.7
Notable locations in this zip code not listed on our city pages
Notable locations in zip code 25064: Shawnee Regional Park Golf Course (A), Dunbar Fire Department Station 1 (B), Institute Volunteer Fire Department (C), Kanawha County Emergency Ambulance Authority Station 259 (D), Bayer Cropscience Ambulance (E), Dunbar Fire Department Station 2 (F), Dunbar City Hall (G). Display/hide their locations on the map
Churches in zip code 25064 include: First Baptist Church of Dunbar (A), Fairlawn Baptist Church (B), Dunbar First Church of God (C), Dunbar Church of the Nazarene (D), Dunbar Church of Christ (E). Display/hide their locations on the map
519 married couples with children.
467 single-parent households (142 men, 325 women).
97.6% of residents of 25064 zip code speak English at home.
1.1% of residents speak Spanish at home (70% very well, 19% well, 11% not well).
0.3% of residents speak other Indo-European language at home (100% very well).
1.3% of residents speak Asian or Pacific Island language at home (57% very well, 40% well, 3% not well).
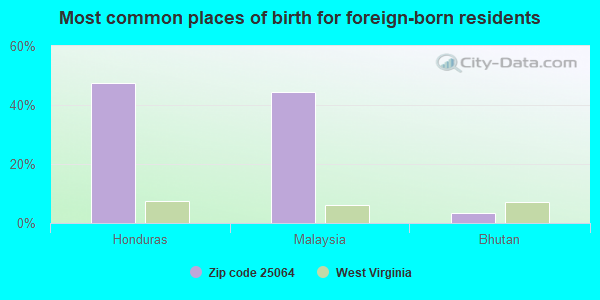
Foreign born population: 65 (0.7%) (39.4% of them are naturalized citizens)
This zip code:
0.7%
Whole state:
1.8%
48%Honduras
44%Malaysia
3%Bhutan
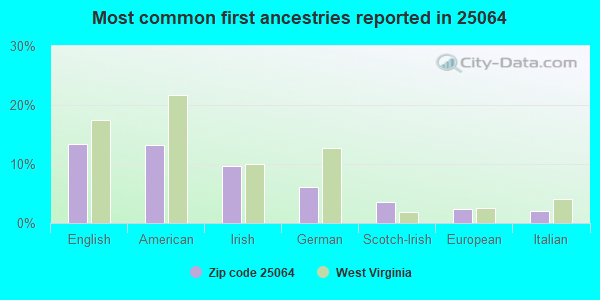
13%English
13%American
10%Irish
6%German
4%Scotch-Irish
2%European
2%Italian
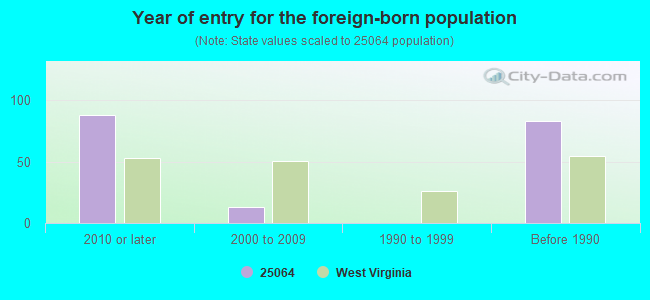
Year of entry for the foreign-born population
882010 or later
132000 to 2009
01990 to 1999
83Before 1990
Major facilities with environmental interests located in this zip code:
AHERA DUNBAR MIDDLE SCHOOL (325 27TH ST. in DUNBAR, WV)
ENFORCEMENT/COMPLIANCE ACTIVITY (Integrated Compliance Information System) COMPLIANCE ACTIVITY (Tracking inspections of insecticide, fungicide, and rodenticide, and toxic substances) (National Center for Education Statistics) - STATE ID-39405 Business SIC classification: ELEMENTARY AND SECONDARY SCHOOLS Organizations: KANAWHA COUNTY SCHOOL DISTRICT (SCHOOL DISTRICT)
BEN FRANKLIN VOCATIONAL CENTER (500 28TH ST in DUNBAR, WV)
(National Center for Education Statistics) - STATE ID-39701 Conditionally Exempt Small Quantity Generators, less than 100 kg/month of hazardous waste (Resource Conservation and Recovery Act (tracking hazardous waste)) Organizations: KANAWHA CO SCHOOLS (CONTACT/OWNER)
, KANAWHA COUNTY SCHOOL DISTRICT (SCHOOL DISTRICT)
Alternative names: BENIGMIN FRANKLIN CAREER CTR
DUNBAR PRIMARY CENTER (2401 MYERS AVE in DUNBAR, WV)
ENFORCEMENT/COMPLIANCE ACTIVITY (Integrated Compliance Information System) COMPLIANCE ACTIVITY (Tracking inspections of insecticide, fungicide, and rodenticide, and toxic substances) (National Center for Education Statistics) - STATE ID-39222 Business SIC classification: ELEMENTARY AND SECONDARY SCHOOLS Organizations: KANAWHA COUNTY SCHOOL DISTRICT (SCHOOL DISTRICT)
Alternative names: DUNBAR PRIMARY SCHOOL
CUSTOM PLATING & POLISHING (1428 OHIO AVE in DUNBAR, WV)
AIR MINOR (AIRS/AFS) SUPERFUND (Superfund database) (Resource Conservation and Recovery Act (tracking hazardous waste)) Business SIC and NAICS classification: ELECTROPLATING, PLATING, POLISHING, ANODIZING, AND COLORING Organizations: TRAC ENTERPRISES LIMITED LIABILITY (CONTACT/OWNER)
Alternative names: CUSTOM PLATING AND POLISHING SITE
DUNBAR INTERMEDIATE CENTER (1330 MYERS AVENUE in DUNBAR, WV)
(National Center for Education Statistics) - STATE ID-39283 Organizations: KANAWHA COUNTY SCHOOL DISTRICT (SCHOOL DISTRICT)
AMERICAN ENERGY (2303 ROXALANA RD in DUNBAR, WV)
(Integrated Compliance Information System) - ICIS-03-1993-0462, FORMAL ENFORCEMENT ACTION
CITY OF DUNBAR GARAGE (2800 CHARLES AVENUE in DUNBAR, WV)
National Pollutant Discharge Elimination System MAJOR (Tracking pollutant discharge elimination systems) - permit National Pollutant Discharge Elimination System NON-MAJOR (Tracking pollutant discharge elimination systems) - permit Conditionally Exempt Small Quantity Generators, less than 100 kg/month of hazardous waste (Resource Conservation and Recovery Act (tracking hazardous waste)) - notification Business SIC classification: SEWERAGE SYSTEMS Organizations: CITY OF DUNBAR ST DEPT (CONTACT/OWNER)
, DUNBAR CITY OF (CONTACT/OWNER)
Alternative names: DUNBAR CITY OF, DUNBAR WWTP
EASTERN ENERGY ASSOCIATES (105 STEVENS DR in DUNBAR, WV)
(Integrated Compliance Information System) - ICIS-03-1994-0119, FORMAL ENFORCEMENT ACTION, ICIS-03-1994-0070,
AUTOMOTIVE MAINTANCE & RPR (1417 DUNBAR AVE in DUNBAR, WV)
(Resource Conservation and Recovery Act (tracking hazardous waste)) Organizations: OPERNAME (CONTACT/OPERATOR)
, GOLDSHERRY WAYNE (CONTACT/OWNER)
BAYLISS & RAMEY INC (2261 ROXALANA RD in DUNBAR, WV)
(Resource Conservation and Recovery Act (tracking hazardous waste)) Organizations: OPERNAME (CONTACT/OPERATOR)
, BAYLISS JOHN MH JR (CONTACT/OWNER)
BJ SERVICES DUNBAR (2106 ROXALANA ROAD in DUNBAR, WV)
National Pollutant Discharge Elimination System NON-MAJOR (Tracking pollutant discharge elimination systems) - permit Small Quantity Generators, between 100 kg and 1000 kg of hazardous waste/month (Resource Conservation and Recovery Act (tracking hazardous waste)) - notification Business SIC classification: SPECIAL WAREHOUSING AND STORAGE Organizations: BARBARA WALKER (CONTACT/OWNER)
Alternative names: B J SERVICES COMPANY UNITED STATES OF AMERICA, BJ SERVICES CO USA
BOBS BODY SHOP (3992 DUNBAR AVE in DUNBAR, WV)
(Resource Conservation and Recovery Act (tracking hazardous waste)) Organizations: OPERNAME (CONTACT/OPERATOR)
, HELMICK, BOB (CONTACT/OWNER)
CHESAPEAKE & POTOMAC TELEPHONE CO (202 TWELFTH ST in DUNBAR, WV)
(Resource Conservation and Recovery Act (tracking hazardous waste)) Organizations: OPERNAME (CONTACT/OPERATOR)
, VERIZON WEST VIRGINIA INC (CONTACT/OWNER)
Alternative names: VERIZON WEST VIRGINIA INC
Housing units lacking complete plumbing facilities: 4.9% Housing units lacking complete kitchen facilities: 2.9%
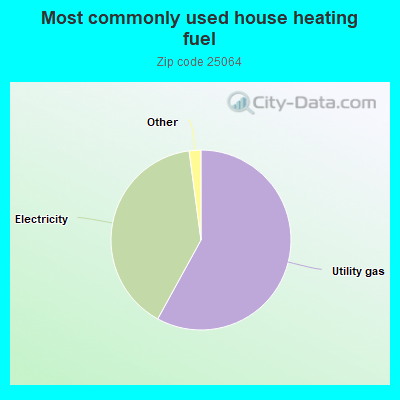
58.0%Utility gas
39.9%Electricity
0.8%Wood
0.6%Fuel oil, kerosene, etc.
0.6%No fuel used
Population in 1990: 11,543.
Place of birth for U.S.-born residents:
This state: 7,053
Northeast: 249
Midwest: 435
South: 985
West: 255
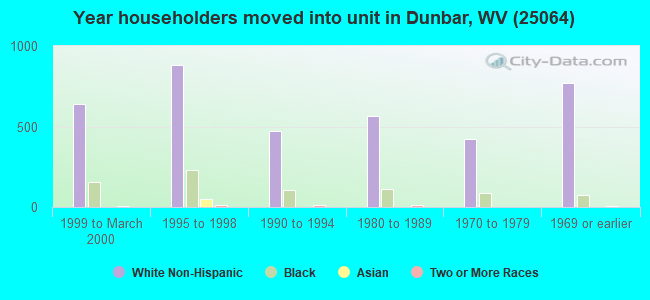
57% of the 25064 zip code residents lived in the same house 5 years ago. Out of people who lived in different houses, 61% lived in this county. Out of people who lived in different counties, 50% lived in West Virginia.
89% of the 25064 zip code residents lived in the same house 1 year ago. Out of people who lived in different houses, 53% moved from this county. Out of people who lived in different houses, 10% moved from different county within same state. Out of people who lived in different houses, 28% moved from different state. Out of people who lived in different houses, 6% moved from abroad.
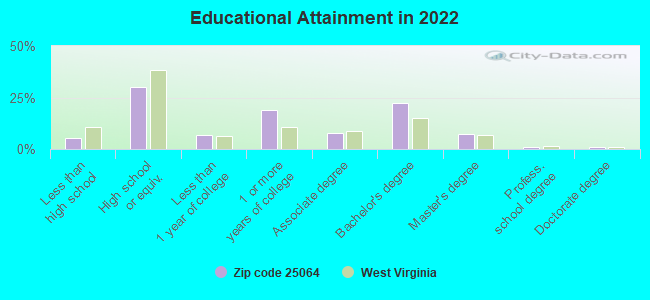
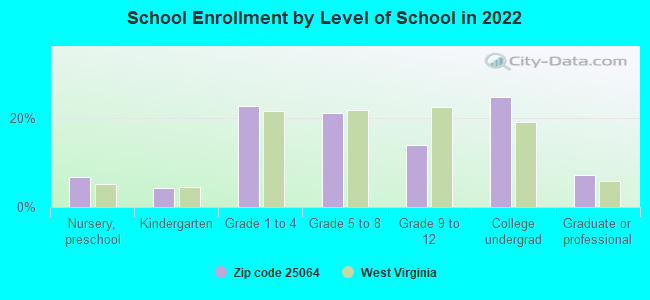
Private vs. public school enrollment:
Students in private schools in grades 1 to 8 (elementary and middle school): 79
Here:
11.6%
West Virginia:
12.2%
Students in private schools in grades 9 to 12 (high school): 5
Here:
2.3%
West Virginia:
8.8%
Students in private undergraduate colleges: 72
Here:
18.8%
West Virginia:
17.3%
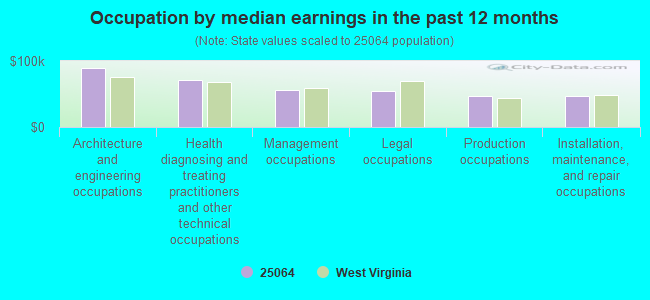
Occupation by median earnings in the past 12 months ($)
89,521Architecture and engineering occupations
71,339Health diagnosing and treating practitioners and other technical occupations
55,329Management occupations
55,260Legal occupations
47,670Production occupations
46,713Installation, maintenance, and repair occupations
Companies with federal contracts located in this zip code (DUNBAR, WV):
SENECA COMMUNICATIONS, INC (13TH STREET & DUNBAR AVE; small business) : $281,474 in 11 contractsfrom 2000 to 2005
Contracts for ADPE System Configuration, ADP Input/Output and Storage Devices, Radio and Television Communication Equipment, Except Airborne, Video Recording and Reproducing Equipment, and moreby Federal Bureau of Investigation, Army, U.S. Fish and Wildlife Service, U.S. Army Corps of Engineers - civil program financing only, and others Signed by year:2000: $79,000; 2001: $42,742; 2002: $31,000; 2003: $0; 2004: $51,062; 2005: $77,670; 2006: $0.
Biggest contracts:
$79,000 with Federal Bureau of Investigation for ADPE System Configuration. Taking place in KY. Signed on 2000-05-15. Completion date: 2000-09-15.
$42,742 with Army for ADP Input/Output and Storage Devices. Signed on 2001-09-29. Completion date: 2001-12-31.
$31,000 with Federal Bureau of Investigation for Radio and Television Communication Equipment, Except Airborne. Taking place in KY. Signed on 2002-07-15. Completion date: 2002-09-15.
$20,595 with U.S. Fish and Wildlife Service for Video Recording and Reproducing Equipment. Signed on 2004-09-20. Completion date: 2004-09-30.
SHAMBLIN STONE INC (70 DUNBAR AVE; small business) : $40,236 in 6 contractsin 2003
Contracts for Mineral Construction Materials, Bulk by U.S. Army Corps of Engineers - civil program financing only Signed by year:2000: $0; 2001: $0; 2002: $0; 2003: $40,236; 2004: $0; 2005: $0; 2006: $0.
Biggest contracts:
$19,000 with U.S. Army Corps of Engineers - civil program financing only for Mineral Construction Materials, Bulk. Signed on 2003-03-24. Completion date: 2004-03-03.
$10,000, same as above.Signed on 2003-06-05. Completion date: 2004-03-03.
$10,000, same as above.Signed on 2003-05-15. Completion date: 2004-03-03.
$1,000, same as above.Signed on 2003-03-10. Completion date: 2004-03-03.
DUNBAR PLAZA ASSOCIATES (1007 DUNBAR AVE; small business)
$23,045 with Army for Lodging - Hotel/Motel. Signed on 2003-08-02. Completion date: 2003-09-30.
FLUID POWER PRODUCTS (901 DUNBAR AVENUE; small business)
$4,291 with U.S. Army Corps of Engineers - civil program financing only for Miscellaneous Special Industry Machinery. Taking place in OH. Signed on 2002-01-28. Completion date: 2002-03-15.
Top industries in this zip code by the number of employees in 2005:
Health Care and Social Assistance: Home Health Care Services (100-249 employees: 1 establishment, 50-99 employees: 2 establishments, 20-49 employees: 1 establishment, 10-19 employees: 3 establishments, 5-9 employees: 1 establishment, 1-4 employees: 1 establishment)
Administrative and Support and Waste Management and Remediation Services: Security Guards and Patrol Services (250-499: 1)
Administrative and Support and Waste Management and Remediation Services: Professional Employer Organizations (250-499: 1)
Health Care and Social Assistance: Services for the Elderly and Persons with Disabilities (100-249: 1, 50-99: 1)
Health Care and Social Assistance: Nursing Care Facilities (100-249: 1)
Administrative and Support and Waste Management and Remediation Services: Janitorial Services (100-249: 1)
2003 - 2018 National Fire Incident Reporting System (NFIRS) incidents
According to the data from the years 2003 - 2018 the average number of fires per year is 33. The highest number of fire incidents - 56 took place in 2008, and the least - 16 in 2013. The data has a decreasing trend.
When looking into fire subcategories, the most incidents belonged to: Structure Fires (50.1%), and Outside Fires (23.4%).
Fire incident types reported to NFIRS in Zip Code 25064


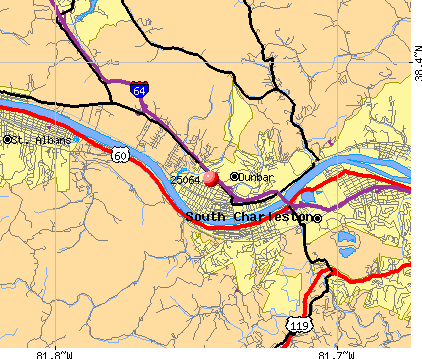 Nearest zip codes: 25112, 25313, 25303, 25309, 25143, 25177.


 According to the data from the years 2003 - 2018 the average number of fires per year is 33. The highest number of fire incidents - 56 took place in 2008, and the least - 16 in 2013. The data has a decreasing trend.
 When looking into fire subcategories, the most incidents belonged to: Structure Fires (50.1%), and Outside Fires (23.4%).