Estimated zip code population in 2022: 2,898 Zip code population in 2010: 3,120 Zip code population in 2000: 2,777
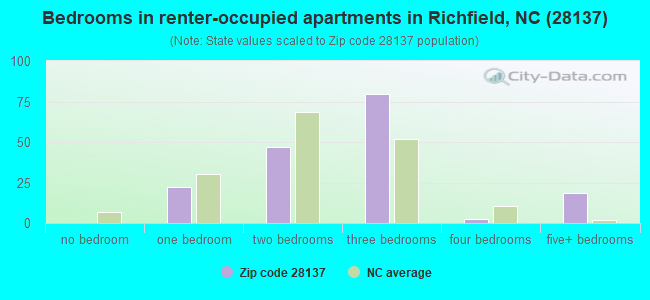
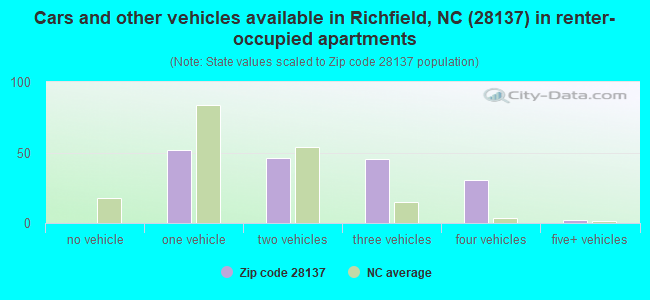
Houses and condos: 1,392 Renter-occupied apartments: 171
% of renters here:
15%
State:
33%
March 2022 cost of living index in zip code 28137: 80.1 (low, U.S. average is 100)
Land area: 44.2 sq. mi. Water area: 2.0 sq. mi.
Population density: 66 people per square mile
(very low).
OSM Map
General Map
Google Map
MSN Map
OSM Map
General Map
Google Map
MSN Map
OSM Map
General Map
Google Map
MSN Map
OSM Map
General Map
Google Map
MSN Map
Please wait while loading the map...
Real estate property taxes paid for housing units in 2022:
This zip code:
0.5% ($1,221)
North Carolina:
0.6% ($1,769)
Median real estate property taxes paid for housing units with mortgages in 2022: $1,380 (0.5%) Median real estate property taxes paid for housing units with no mortgage in 2022: $951 (0.4%)
Business Search- 14 Million verified businesses
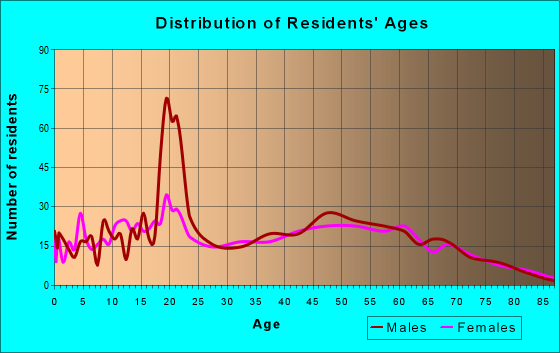
Males: 1,404
(48.4%)
Females: 1,494
(51.6%)
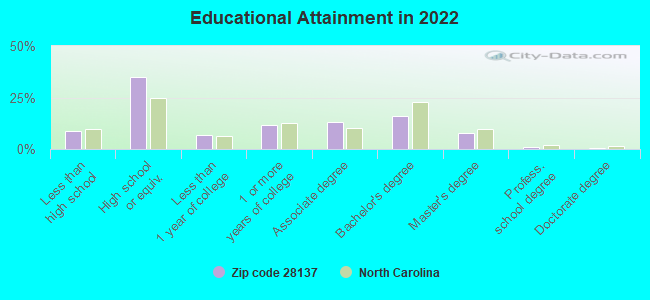
For population 25 years and over in 28137:
High school or higher: 90.9%
Bachelor's degree or higher: 25.0%
Graduate or professional degree: 9.1%
Unemployed: 2.6%
Mean travel time to work (commute): 25.1 minutes
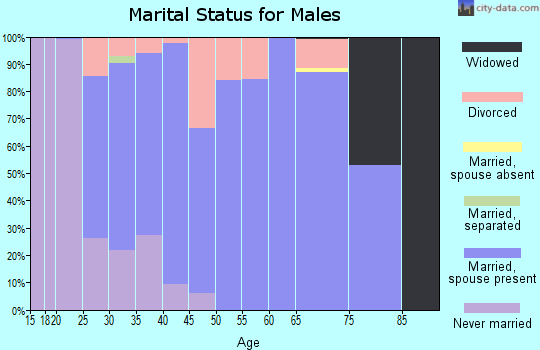
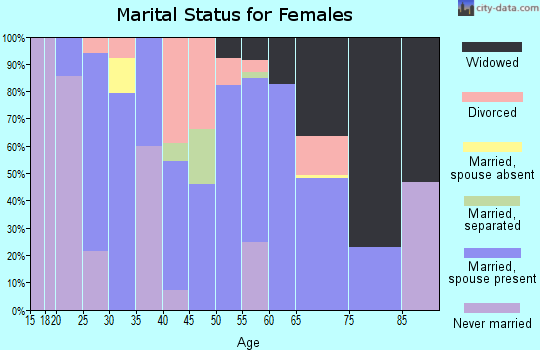
For population 15 years and over in 28137:
Never married: 24.8%
Now married: 61.2%
Separated: 0.2%
Widowed: 8.5%
Divorced: 5.2%
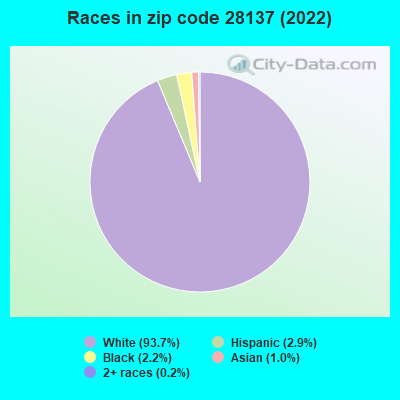
Zip code 28137 compared to state average:
Black race population percentage significantly below state average.
Hispanic race population percentage significantly below state average.
Foreign-born population percentage significantly below state average.
Renting percentage below state average.
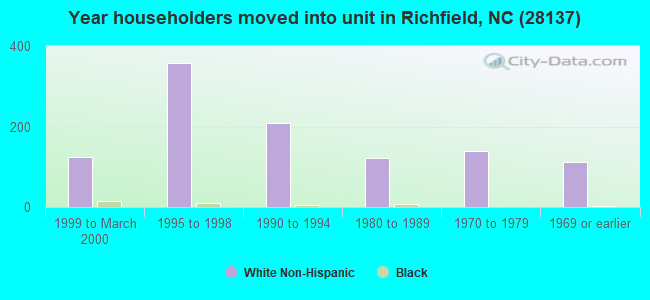
Length of stay since moving in significantly above state average.
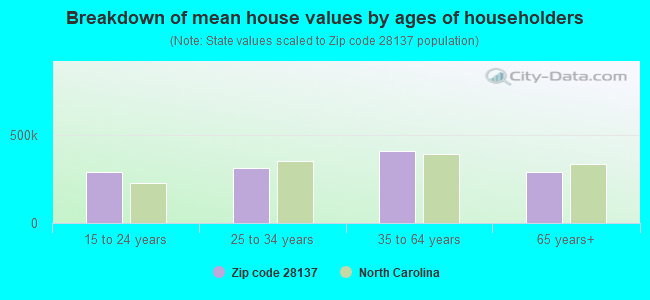
Estimated median house/condo value in 2022: $253,962
28137:
$253,962
North Carolina:
$280,600
According to our research of North Carolina and other state lists, there were 6 registered sex offenders living in 28137 zip code as of April 27, 2024. The ratio of all residents to sex offenders in zip code 28137 is 540 to 1. The ratio of registered sex offenders to all residents in this zip code is near the state average.
Median resident age:
This zip code:
40.4 years
North Carolina median age:
39.2 years
Average household size:
This zip code:
2.6 people
North Carolina:
2.4 people
Averages for the 2020 tax year for zip code 28137, filed in 2021:
Average Adjusted Gross Income (AGI) in 2020: $59,186 (Individual Income Tax Returns)
Here:
$59,186
State:
$70,020
Salary/wage: $50,067 (reported on 79.9% of returns)
Here:
$50,067
State:
$58,387
(% of AGI for various income ranges: 1135.3% for AGIs below $25k, 3720.4% for AGIs $25k-50k, 6705.3% for AGIs $50k-75k, 10561.1% for AGIs $75k-100k, 16837.3% for AGIs $100k-200k)
Taxable interest for individuals: $884 (reported on 32.4% of returns)
This zip code:
$884
North Carolina:
$1,479
(% of AGI for various income ranges: 11.7% for AGIs below $25k, 13.5% for AGIs $25k-50k, 60.7% for AGIs $50k-75k, 67.8% for AGIs $75k-100k, 108.2% for AGIs $100k-200k)
Ordinary dividends: $2,617 (reported on 17.3% of returns)
Here:
$2,617
State:
$7,888
(% of AGI for various income ranges: 16.7% for AGIs below $25k, 41.2% for AGIs $25k-50k, 124.0% for AGIs $50k-75k, 58.9% for AGIs $75k-100k, 210.9% for AGIs $100k-200k)
Net capital gain/loss in AGI: +$10,355 (reported on 15.8% of returns)
Here:
+$10,355
State:
+$23,652
(% of AGI for various income ranges: 0.3% for AGIs below $25k, 18.8% for AGIs $25k-50k, 68.0% for AGIs $50k-75k, 215.6% for AGIs $75k-100k, 503.6% for AGIs $100k-200k)
Profit/loss from business: +$12,827 (reported on 15.8% of returns)
Here:
+$12,827
State:
+$11,710
(% of AGI for various income ranges: 161.7% for AGIs below $25k, 206.5% for AGIs $25k-50k, 373.3% for AGIs $50k-75k, 471.1% for AGIs $75k-100k, 741.8% for AGIs $100k-200k)
Taxable individual retirement arrangement distribution: $15,156 (reported on 11.5% of returns)
28137:
$15,156
North Carolina:
$20,247
(% of AGI for various income ranges: 87.3% for AGIs below $25k, 106.9% for AGIs $25k-50k, 220.7% for AGIs $50k-75k, 685.6% for AGIs $75k-100k, 851.8% for AGIs $100k-200k)
Total itemized deductions: $29,086 (reported on 5.0% of returns)
Here:
$29,086
State:
$34,549
(% of AGI for various income ranges: 232.3% for AGIs $25k-50k, 1301.8% for AGIs $100k-200k)
Charity contributions: $9,833 (reported on 4.3% of returns)
Here:
$9,833
State:
$13,360
(% of AGI for various income ranges: 536.4% for AGIs $100k-200k)
Taxes paid: $6,500 (reported on 5.0% of returns)
28137:
$6,500
State:
$7,586
(% of AGI for various income ranges: 52.3% for AGIs $25k-50k, 290.0% for AGIs $100k-200k)
Earned income credit: $2,215 (reported on 14.4% of returns)
Here:
$2,215
State:
$2,337
(% of AGI for various income ranges: 81.3% for AGIs below $25k, 76.5% for AGIs $25k-50k)
Percentage of individuals using paid preparers for their 2020 taxes: 93.5%
Here:
94%
State:
93%
(% for various income ranges: 93.0% for AGIs below $25k, 94.3% for AGIs $25k-50k, 95.5% for AGIs $50k-75k, 87.5% for AGIs $75k-100k, 95.0% for AGIs $100k-200k, 100.0% for AGIs over 200k)
Averages for the 2012 tax year for zip code 28137, filed in 2013:
Average Adjusted Gross Income (AGI) in 2012: $46,280 (Individual Income Tax Returns)
Here:
$46,280
State:
$54,937
Salary/wage: $39,147 (reported on 82.2% of returns)
Here:
$39,147
State:
$46,336
(% of AGI for various income ranges: 71.6% for AGIs below $25k, 77.7% for AGIs $25k-50k, 74.8% for AGIs $50k-75k, 75.2% for AGIs $75k-100k, 54.7% for AGIs $100k-200k)
Taxable interest for individuals: $830 (reported on 35.7% of returns)
This zip code:
$830
North Carolina:
$1,298
(% of AGI for various income ranges: 1.4% for AGIs below $25k, 0.5% for AGIs $25k-50k, 0.9% for AGIs $50k-75k, 0.4% for AGIs $75k-100k, 0.4% for AGIs $100k-200k)
Ordinary dividends: $2,070 (reported on 17.8% of returns)
Here:
$2,070
State:
$6,213
(% of AGI for various income ranges: 1.6% for AGIs below $25k, 0.6% for AGIs $25k-50k, 0.9% for AGIs $50k-75k, 0.8% for AGIs $75k-100k, 0.6% for AGIs $100k-200k)
Net capital gain/loss in AGI: +$164 (reported on 10.9% of returns)
Here:
+$164
State:
+$12,740
(% of AGI for various income ranges: 0.3% for AGIs $50k-75k, 0.5% for AGIs $75k-100k)
Profit/loss from business: +$9,419 (reported on 16.3% of returns)
Here:
+$9,419
State:
+$10,311
(% of AGI for various income ranges: 10.1% for AGIs below $25k, 2.9% for AGIs $25k-50k, 3.3% for AGIs $50k-75k, 2.9% for AGIs $75k-100k, 1.5% for AGIs $100k-200k)
Taxable individual retirement arrangement distribution: $10,571 (reported on 10.9% of returns)
28137:
$10,571
North Carolina:
$15,575
(% of AGI for various income ranges: 4.2% for AGIs below $25k, 1.9% for AGIs $25k-50k, 1.4% for AGIs $50k-75k, 3.2% for AGIs $75k-100k, 2.7% for AGIs $100k-200k)
Total itemized deductions: $18,900 (22% of AGI, reported on 27.1% of returns)
Here:
$18,900
State:
$23,438
Here:
21.6% of AGI
State:
21.5% of AGI
(% of AGI for various income ranges: 9.7% for AGIs below $25k, 7.8% for AGIs $25k-50k, 10.3% for AGIs $50k-75k, 12.4% for AGIs $75k-100k, 13.9% for AGIs $100k-200k)
Charity contributions: $3,840 (reported on 23.3% of returns)
Here:
$3,840
State:
$4,687
(% of AGI for various income ranges: 1.5% for AGIs below $25k, 1.4% for AGIs $25k-50k, 1.7% for AGIs $50k-75k, 2.4% for AGIs $75k-100k, 2.3% for AGIs $100k-200k)
Taxes paid: $6,694 (reported on 27.1% of returns)
28137:
$6,694
State:
$8,823
(% of AGI for various income ranges: 1.7% for AGIs below $25k, 1.8% for AGIs $25k-50k, 2.8% for AGIs $50k-75k, 4.3% for AGIs $75k-100k, 7.0% for AGIs $100k-200k)
Earned income credit: $2,235 (reported on 17.8% of returns)
Here:
$2,235
State:
$2,376
(% of AGI for various income ranges: 5.7% for AGIs below $25k, 1.4% for AGIs $25k-50k)
Percentage of individuals using paid preparers for their 2012 taxes: 64.3%
Here:
64%
State:
53%
(% for various income ranges: 59.2% for AGIs below $25k, 61.1% for AGIs $25k-50k, 72.7% for AGIs $50k-75k, 75.0% for AGIs $75k-100k, 70.0% for AGIs $100k-200k)
Averages for the 2004 tax year for zip code 28137, filed in 2005:
Average Adjusted Gross Income (AGI) in 2004: $38,679 (Individual Income Tax Returns)
Here:
$38,679
State:
$45,376
Salary/wage: $35,199 (reported on 84.5% of returns)
Here:
$35,199
State:
$39,442
(% of AGI for various income ranges: 89.2% for AGIs below $10k, 76.3% for AGIs $10k-25k, 83.1% for AGIs $25k-50k, 82.5% for AGIs $50k-75k, 83.9% for AGIs $75k-100k, 53.1% for AGIs over 100k)
Taxable interest for individuals: $897 (reported on 41.8% of returns)
This zip code:
$897
North Carolina:
$1,515
(% of AGI for various income ranges: 4.3% for AGIs below $10k, 1.7% for AGIs $10k-25k, 0.7% for AGIs $25k-50k, 1.0% for AGIs $50k-75k, 0.3% for AGIs $75k-100k, 1.1% for AGIs over 100k)
Taxable dividends: $1,578 (reported on 20.5% of returns)
Here:
$1,578
State:
$4,016
(% of AGI for various income ranges: 2.9% for AGIs below $10k, 1.0% for AGIs $10k-25k, 0.4% for AGIs $25k-50k, 1.1% for AGIs $50k-75k, 0.5% for AGIs $75k-100k, 1.0% for AGIs over 100k)
Net capital gain/loss: +$6,301 (reported on 14.0% of returns)
Here:
+$6,301
State:
+$11,152
(% of AGI for various income ranges: -3.0% for AGIs below $10k, 0.2% for AGIs $10k-25k, 0.8% for AGIs $25k-50k, 0.7% for AGIs $50k-75k, 1.9% for AGIs $75k-100k, 8.7% for AGIs over 100k)
Profit/loss from business: +$7,759 (reported on 17.8% of returns)
Here:
+$7,759
State:
+$9,490
(% of AGI for various income ranges: 17.2% for AGIs below $10k, 6.1% for AGIs $10k-25k, 3.6% for AGIs $25k-50k, 1.8% for AGIs $50k-75k, 3.1% for AGIs $75k-100k, 3.1% for AGIs over 100k)
IRA payment deduction: $2,409 (reported on 1.8% of returns)
28137:
$2,409
North Carolina:
$2,967
Total itemized deductions: $16,204 (24% of AGI, reported on 33.2% of returns)
Here:
$16,204
State:
$19,464
Here:
24.3% of AGI
State:
22.7% of AGI
(% of AGI for various income ranges: 12.8% for AGIs below $10k, 10.2% for AGIs $10k-25k, 13.2% for AGIs $25k-50k, 14.4% for AGIs $50k-75k, 15.7% for AGIs $75k-100k, 14.7% for AGIs over 100k)
Charity contributions deductions: $2,980 (4% of AGI, reported on 27.8% of returns)
Here:
$2,980
State:
$4,035
Here:
4.2% of AGI
State:
4.5% of AGI
(% of AGI for various income ranges: 1.6% for AGIs $10k-25k, 1.6% for AGIs $25k-50k, 2.3% for AGIs $50k-75k, 2.6% for AGIs $75k-100k, 2.7% for AGIs over 100k)
Total tax: $4,776 (reported on 72.7% of returns)
28137:
$4,776
State:
$7,257
(% of AGI for various income ranges: 3.4% for AGIs below $10k, 4.1% for AGIs $10k-25k, 6.0% for AGIs $25k-50k, 7.6% for AGIs $50k-75k, 10.4% for AGIs $75k-100k, 16.8% for AGIs over 100k)
Earned income credit: $1,743 (reported on 18.0% of returns)
Here:
$1,743
State:
$1,851
Percentage of individuals using paid preparers for their 2004 taxes: 71.7%
Here:
72%
State:
62%
(% for various income ranges: 60.6% for AGIs below $10k, 72.6% for AGIs $10k-25k, 75.7% for AGIs $25k-50k, 76.0% for AGIs $50k-75k, 64.4% for AGIs $75k-100k, 94.4% for AGIs over 100k)
Household received Food Stamps/SNAP in the past 12 months: 114 Household did not receive Food Stamps/SNAP in the past 12 months: 993
Women who had a birth in the past 12 months: 98 (92 now married, 7 unmarried) Women who did not have a birth in the past 12 months: 617 (312 now married, 306 unmarried)
Housing units in zip code 28137 with a mortgage: 486 (57 second mortgage, 60 both second mortgage and home equity loan) Houses without a mortgage: 67
Median monthly owner costs for units with a mortgage: $1,428 Median monthly owner costs for units without a mortgage: $391
Residents with income below the poverty level in 2022:
This zip code:
5.1%
Whole state:
12.8%
Residents with income below 50% of the poverty level in 2022:
This zip code:
3.6%
Whole state:
6.8%
Median number of rooms in houses and condos:
Here:
6.1
State:
6.4
Median number of rooms in apartments:
Here:
5.1
State:
4.4
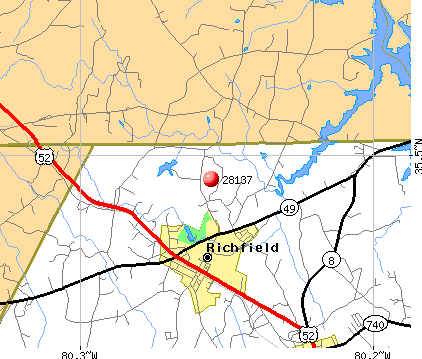
Notable locations in this zip code not listed on our city pages
Churches in zip code 28137 include: Luthers Church (A), Flat Creek Church (B), Mount Tabor Church (C), New Bethel Church (D), Wyatts Grove Church (E), Wesley Chapel (F), Opendoor Church (G), Antioch Church (H), Parkers Memorial Church (I). Display/hide their locations on the map
Size of family households: 225 2-persons, 328 3-persons, 114 4-persons, 18 5-persons, 75 6-persons, 12 7-or-more-persons
Size of nonfamily households: 301 1-person, 28 2-persons, 6 3-persons
540 married couples with children.
14 single-parent households (14 men).
96.1% of residents of 28137 zip code speak English at home.
2.2% of residents speak Spanish at home (100% very well).
0.2% of residents speak other Indo-European language at home (40% very well, 60% not well).
1.1% of residents speak Asian or Pacific Island language at home (66% very well, 34% not well).
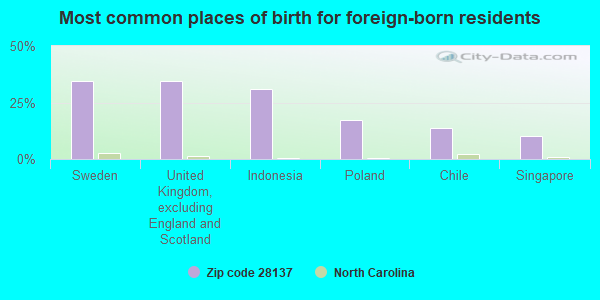
Foreign born population: 30 (1.1%) (83.2% of them are naturalized citizens)
This zip code:
1.1%
Whole state:
8.6%
34%Sweden
34%United Kingdom, excluding England and Scotland
31%Indonesia
17%Poland
14%Chile
10%Singapore
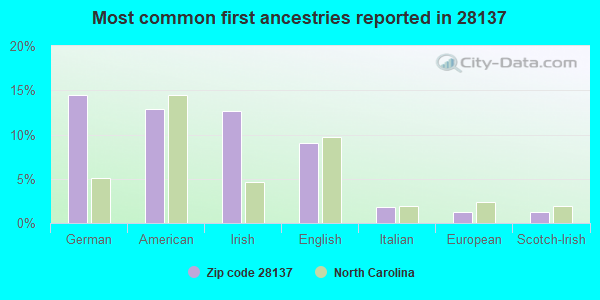
14%German
13%American
13%Irish
9%English
2%Italian
1%European
1%Scotch-Irish
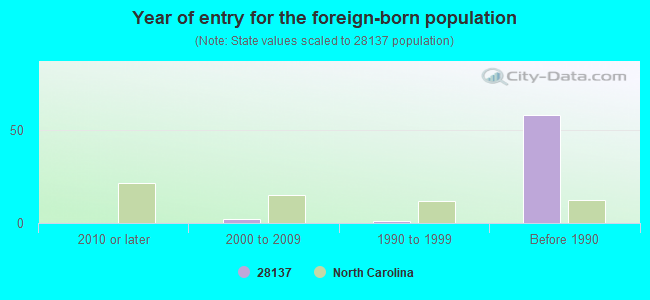
Year of entry for the foreign-born population
02010 or later
22000 to 2009
11990 to 1999
58Before 1990
Facilities with environmental interests located in this zip code:
CMH MANUFACTURING INCORPORATED (44073 US HIGHWAY 52 NORTH in RICHFIELD, NC)
AIR MINOR (AIRS/AFS) STATE MASTER (North Carolina facility info) - AIR PROGRAM COMPLIANCE ACTIVITY (Tracking inspections of insecticide, fungicide, and rodenticide, and toxic substances) CRITERIA AND HAZARDOUS AIR POLLUTANT INVENTORY (Inventory of air pollution sources) National Pollutant Discharge Elimination System NON-MAJOR (Tracking pollutant discharge elimination systems) - permit TRI REPORTER (Tracking of toxic chemicals releasing facilities) Business SIC classification: MOBILE HOMES Business NAICS classification: MANUFACTURED HOME (MOBILE HOME) MANUFACTURING. Alternative names: CLAYTON HOMES, CLAYTON HOMES - RICHFIELD, CMH MFG INC DBA CLAYTON HOME C
ADORN, LLC (44060 US HWY 52 S in RICHFIELD, NC)
National Pollutant Discharge Elimination System NON-MAJOR (Tracking pollutant discharge elimination systems) - permit Business SIC classification: MANUFACTURING INDUSTRIES Alternative names: ADORN LLL, DESIGN COMPONENTS
Housing units lacking complete plumbing facilities: 2.8% Housing units lacking complete kitchen facilities: 0.3%
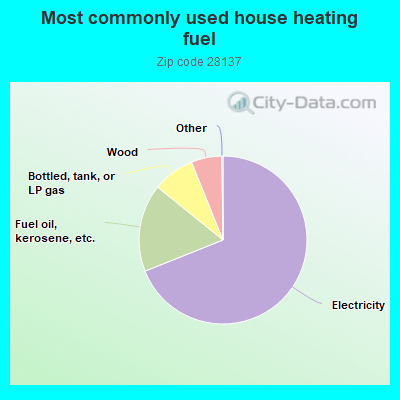
69.1%Electricity
16.9%Fuel oil, kerosene, etc.
8.1%Bottled, tank, or LP gas
5.9%Wood
Population in 1990: 2,307. Population change in the 1990s: +470 (+20.4%).
Place of birth for U.S.-born residents:
This state: 2,153
Northeast: 215
Midwest: 133
South: 255
West: 43
59% of the 28137 zip code residents lived in the same house 5 years ago. Out of people who lived in different houses, 50% lived in this county. Out of people who lived in different counties, 50% lived in North Carolina.
98% of the 28137 zip code residents lived in the same house 1 year ago. Out of people who lived in different houses, 50% moved from this county. Out of people who lived in different houses, 41% moved from different county within same state. Out of people who lived in different houses, 41% moved from different state.
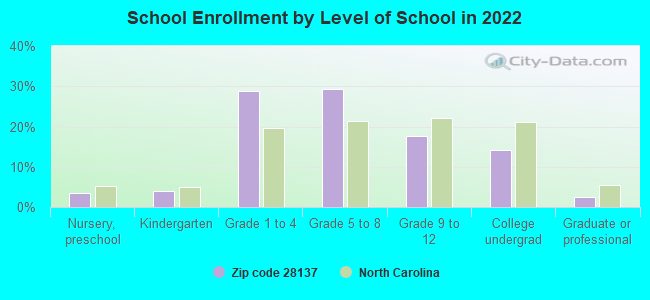
Private vs. public school enrollment:
Students in private schools in grades 1 to 8 (elementary and middle school): 58
Here:
18.7%
North Carolina:
13.8%
Students in private schools in grades 9 to 12 (high school):
Here:
0.0%
North Carolina:
11.9%
Students in private undergraduate colleges: 7
Here:
10.2%
North Carolina:
19.3%
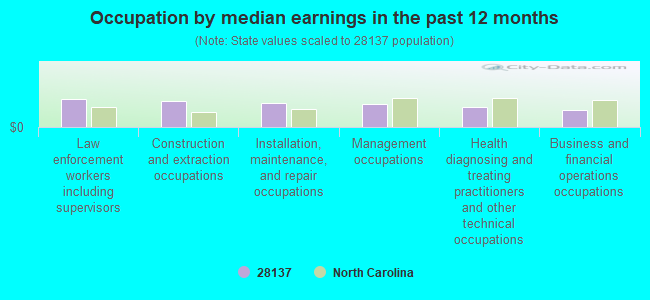
Occupation by median earnings in the past 12 months ($)
80,573Law enforcement workers including supervisors
76,326Construction and extraction occupations
69,761Installation, maintenance, and repair occupations
66,895Management occupations
59,387Health diagnosing and treating practitioners and other technical occupations
50,848Business and financial operations occupations
Top industries in this zip code by the number of employees in 2005:
Construction: Water and Sewer Line and Related Structures Construction (50-99 employees: 1 establishment)
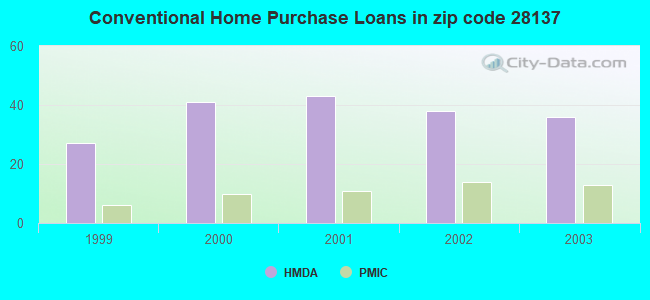
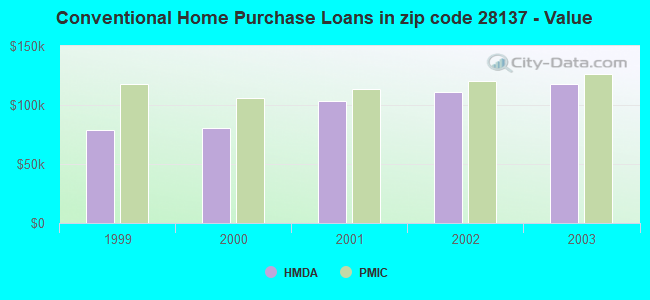
Detailed PMIC statistics for the following Tracts:0509.02
2003 - 2018 National Fire Incident Reporting System (NFIRS) incidents
According to the data from the years 2003 - 2018 the average number of fire incidents per year is 17. The highest number of fire incidents - 34 took place in 2007, and the least - 2 in 2003. The data has a rising trend.
When looking into fire subcategories, the most incidents belonged to: Structure Fires (44.4%), and Outside Fires (40.2%).
Fire incident types reported to NFIRS in Zip Code 28137
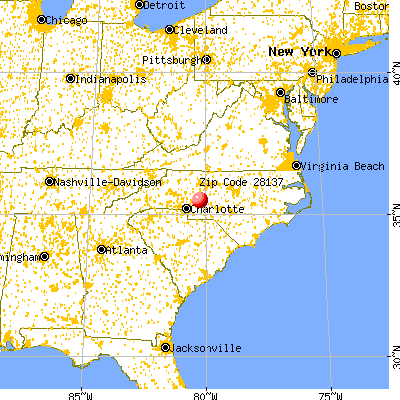


 Nearest zip codes: 28109, 28071, 28127, 27239, 28146, 27292.
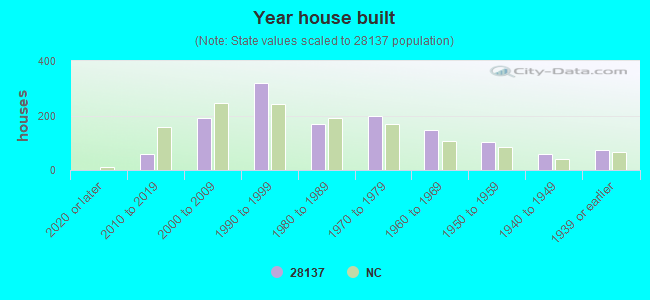


 According to the data from the years 2003 - 2018 the average number of fire incidents per year is 17. The highest number of fire incidents - 34 took place in 2007, and the least - 2 in 2003. The data has a rising trend.
 When looking into fire subcategories, the most incidents belonged to: Structure Fires (44.4%), and Outside Fires (40.2%).