Estimated zip code population in 2022: 3,725 Zip code population in 2010: 4,712 Zip code population in 2000: 4,739
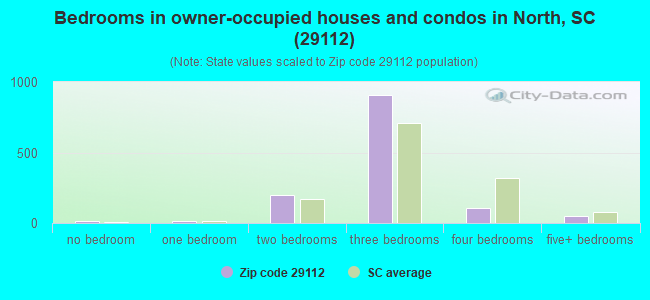
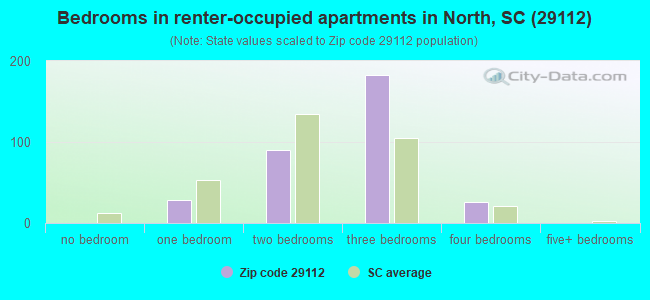
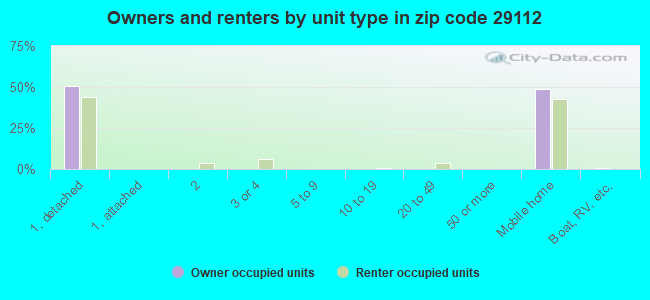
Houses and condos: 2,020 Renter-occupied apartments: 331
% of renters here:
20%
State:
28%
March 2022 cost of living index in zip code 29112: 79.4 (low, U.S. average is 100)
Land area: 115.8 sq. mi. Water area: 0.7 sq. mi.
Population density: 32 people per square mile
(very low).
OSM Map
General Map
Google Map
MSN Map
OSM Map
General Map
Google Map
MSN Map
OSM Map
General Map
Google Map
MSN Map
OSM Map
General Map
Google Map
MSN Map
Please wait while loading the map...
Real estate property taxes paid for housing units in 2022:
This zip code:
0.5% ($455)
South Carolina:
0.5% ($1,185)
Median real estate property taxes paid for housing units with mortgages in 2022: $796 (0.8%) Median real estate property taxes paid for housing units with no mortgage in 2022: $355 (0.5%)
Estimated median house/condo value in 2022: $95,504
29112:
$95,504
South Carolina:
$254,600
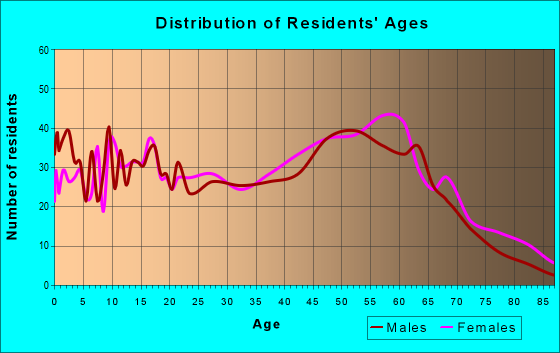
Median resident age:
This zip code:
49.3 years
South Carolina median age:
40.5 years
Average household size:
This zip code:
2.3 people
South Carolina:
2.4 people
Averages for the 2020 tax year for zip code 29112, filed in 2021:
Average Adjusted Gross Income (AGI) in 2020: $40,948 (Individual Income Tax Returns)
Here:
$40,948
State:
$65,754
Salary/wage: $37,746 (reported on 83.9% of returns)
Here:
$37,746
State:
$52,566
(% of AGI for various income ranges: 1170.3% for AGIs below $25k, 4004.0% for AGIs $25k-50k, 7148.3% for AGIs $50k-75k, 11311.4% for AGIs $75k-100k, 23751.4% for AGIs $100k-200k)
Taxable interest for individuals: $912 (reported on 13.1% of returns)
This zip code:
$912
South Carolina:
$1,749
(% of AGI for various income ranges: 8.6% for AGIs below $25k, 6.2% for AGIs $25k-50k, 30.0% for AGIs $50k-75k, 24.3% for AGIs $75k-100k, 117.1% for AGIs $100k-200k)
Ordinary dividends: $2,353 (reported on 7.5% of returns)
Here:
$2,353
State:
$8,783
(% of AGI for various income ranges: 7.5% for AGIs below $25k, 7.6% for AGIs $25k-50k, 17.8% for AGIs $50k-75k, 70.0% for AGIs $75k-100k, 270.0% for AGIs $100k-200k)
Net capital gain/loss in AGI: +$7,857 (reported on 7.0% of returns)
Here:
+$7,857
State:
+$24,194
(% of AGI for various income ranges: 20.0% for AGIs below $25k, 95.6% for AGIs $50k-75k, 1140.0% for AGIs $100k-200k)
Profit/loss from business: +$6,167 (reported on 13.6% of returns)
Here:
+$6,167
State:
+$11,253
(% of AGI for various income ranges: 109.4% for AGIs below $25k, 71.8% for AGIs $25k-50k, 33.3% for AGIs $50k-75k, 815.7% for AGIs $75k-100k)
Taxable individual retirement arrangement distribution: $13,045 (reported on 5.5% of returns)
29112:
$13,045
South Carolina:
$21,604
(% of AGI for various income ranges: 31.4% for AGIs below $25k, 79.8% for AGIs $25k-50k, 180.6% for AGIs $50k-75k, 781.4% for AGIs $75k-100k)
Total itemized deductions: $27,267 (reported on 3.0% of returns)
Here:
$27,267
State:
$35,199
(% of AGI for various income ranges: 150.9% for AGIs $25k-50k, 1367.1% for AGIs $75k-100k)
Charity contributions: $10,340 (reported on 2.5% of returns)
Here:
$10,340
State:
$14,319
(% of AGI for various income ranges: 38.0% for AGIs $25k-50k, 494.3% for AGIs $75k-100k)
Taxes paid: $5,800 (reported on 3.0% of returns)
29112:
$5,800
State:
$7,486
(% of AGI for various income ranges: 93.3% for AGIs $50k-75k, 257.1% for AGIs $100k-200k)
Earned income credit: $2,414 (reported on 28.1% of returns)
Here:
$2,414
State:
$2,397
(% of AGI for various income ranges: 140.3% for AGIs below $25k, 97.8% for AGIs $25k-50k)
Percentage of individuals using paid preparers for their 2020 taxes: 93.0%
Here:
93%
State:
93%
(% for various income ranges: 94.0% for AGIs below $25k, 93.3% for AGIs $25k-50k, 88.9% for AGIs $50k-75k, 92.3% for AGIs $75k-100k, 93.3% for AGIs $100k-200k)
Averages for the 2012 tax year for zip code 29112, filed in 2013:
Average Adjusted Gross Income (AGI) in 2012: $34,987 (Individual Income Tax Returns)
Here:
$34,987
State:
$51,133
Salary/wage: $30,992 (reported on 85.5% of returns)
Here:
$30,992
State:
$42,173
(% of AGI for various income ranges: 76.5% for AGIs below $25k, 80.4% for AGIs $25k-50k, 79.7% for AGIs $50k-75k, 78.5% for AGIs $75k-100k, 60.4% for AGIs $100k-200k)
Taxable interest for individuals: $584 (reported on 17.2% of returns)
This zip code:
$584
South Carolina:
$1,468
(% of AGI for various income ranges: 0.4% for AGIs below $25k, 0.4% for AGIs $25k-50k, 0.2% for AGIs $50k-75k, 0.2% for AGIs $75k-100k, 0.1% for AGIs $100k-200k)
Ordinary dividends: $1,429 (reported on 9.1% of returns)
Here:
$1,429
State:
$6,511
(% of AGI for various income ranges: 0.2% for AGIs below $25k, 0.5% for AGIs $25k-50k, 0.5% for AGIs $50k-75k, 0.3% for AGIs $75k-100k, 0.3% for AGIs $100k-200k)
Net capital gain/loss in AGI: +$2,882 (reported on 5.9% of returns)
Here:
+$2,882
State:
+$13,061
(% of AGI for various income ranges: 0.3% for AGIs below $25k, 0.7% for AGIs $25k-50k, 1.7% for AGIs $75k-100k)
Profit/loss from business: +$8,081 (reported on 14.0% of returns)
Here:
+$8,081
State:
+$10,167
(% of AGI for various income ranges: 7.7% for AGIs below $25k, 1.7% for AGIs $25k-50k, 0.9% for AGIs $50k-75k, 7.6% for AGIs $75k-100k)
Taxable individual retirement arrangement distribution: $14,620 (reported on 5.4% of returns)
29112:
$14,620
South Carolina:
$17,019
(% of AGI for various income ranges: 1.1% for AGIs below $25k, 3.9% for AGIs $25k-50k, 6.2% for AGIs $75k-100k)
Total itemized deductions: $17,494 (26% of AGI, reported on 18.8% of returns)
Here:
$17,494
State:
$22,890
Here:
26.4% of AGI
State:
21.4% of AGI
(% of AGI for various income ranges: 4.7% for AGIs below $25k, 8.4% for AGIs $25k-50k, 10.2% for AGIs $50k-75k, 10.5% for AGIs $75k-100k, 14.1% for AGIs $100k-200k)
Charity contributions: $4,886 (reported on 15.6% of returns)
Here:
$4,886
State:
$5,169
(% of AGI for various income ranges: 0.7% for AGIs below $25k, 1.8% for AGIs $25k-50k, 2.4% for AGIs $50k-75k, 2.4% for AGIs $75k-100k, 3.9% for AGIs $100k-200k)
Taxes paid: $4,977 (reported on 18.8% of returns)
29112:
$4,977
State:
$7,644
(% of AGI for various income ranges: 0.8% for AGIs below $25k, 1.6% for AGIs $25k-50k, 2.9% for AGIs $50k-75k, 3.2% for AGIs $75k-100k, 5.7% for AGIs $100k-200k)
Earned income credit: $2,405 (reported on 33.9% of returns)
Here:
$2,405
State:
$2,418
(% of AGI for various income ranges: 10.1% for AGIs below $25k, 1.6% for AGIs $25k-50k)
Percentage of individuals using paid preparers for their 2012 taxes: 66.7%
Here:
67%
State:
57%
(% for various income ranges: 64.5% for AGIs below $25k, 65.4% for AGIs $25k-50k, 71.4% for AGIs $50k-75k, 81.8% for AGIs $75k-100k, 66.7% for AGIs $100k-200k)
Averages for the 2004 tax year for zip code 29112, filed in 2005:
Average Adjusted Gross Income (AGI) in 2004: $30,281 (Individual Income Tax Returns)
Here:
$30,281
State:
$41,965
Salary/wage: $28,121 (reported on 88.5% of returns)
Here:
$28,121
State:
$35,695
(% of AGI for various income ranges: 96.4% for AGIs below $10k, 81.4% for AGIs $10k-25k, 89.2% for AGIs $25k-50k, 86.1% for AGIs $50k-75k, 87.3% for AGIs $75k-100k, 48.7% for AGIs over 100k)
Taxable interest for individuals: $1,467 (reported on 22.4% of returns)
This zip code:
$1,467
South Carolina:
$1,623
(% of AGI for various income ranges: 1.7% for AGIs below $10k, 1.3% for AGIs $10k-25k, 0.6% for AGIs $25k-50k, 0.3% for AGIs $50k-75k, 1.0% for AGIs $75k-100k, 3.2% for AGIs over 100k)
Taxable dividends: $1,772 (reported on 9.8% of returns)
Here:
$1,772
State:
$3,999
(% of AGI for various income ranges: 0.3% for AGIs below $10k, 0.3% for AGIs $10k-25k, 0.4% for AGIs $25k-50k, 0.4% for AGIs $50k-75k, 0.4% for AGIs $75k-100k, 2.1% for AGIs over 100k)
Net capital gain/loss: +$8,631 (reported on 7.3% of returns)
Here:
+$8,631
State:
+$13,100
(% of AGI for various income ranges: 0.3% for AGIs below $10k, 1.0% for AGIs $10k-25k, 0.7% for AGIs $25k-50k, 1.9% for AGIs $50k-75k, 1.6% for AGIs $75k-100k, 8.9% for AGIs over 100k)
Profit/loss from business: +$4,038 (reported on 13.7% of returns)
Here:
+$4,038
State:
+$9,144
(% of AGI for various income ranges: 2.9% for AGIs below $10k, 5.8% for AGIs $10k-25k, 1.6% for AGIs $25k-50k, -0.3% for AGIs $50k-75k, 1.2% for AGIs $75k-100k)
IRA payment deduction: $2,677 (reported on 1.6% of returns)
29112:
$2,677
South Carolina:
$2,972
Total itemized deductions: $15,155 (25% of AGI, reported on 21.0% of returns)
Here:
$15,155
State:
$19,039
Here:
24.7% of AGI
State:
22.8% of AGI
(% of AGI for various income ranges: 5.9% for AGIs $10k-25k, 9.8% for AGIs $25k-50k, 14.0% for AGIs $50k-75k, 15.3% for AGIs $75k-100k, 12.1% for AGIs over 100k)
Charity contributions deductions: $4,020 (6% of AGI, reported on 18.4% of returns)
Here:
$4,020
State:
$4,305
Here:
6.5% of AGI
State:
5.0% of AGI
(% of AGI for various income ranges: 1.0% for AGIs $10k-25k, 2.0% for AGIs $25k-50k, 3.3% for AGIs $50k-75k, 3.0% for AGIs $75k-100k, 4.5% for AGIs over 100k)
Total tax: $3,481 (reported on 64.0% of returns)
29112:
$3,481
State:
$6,497
(% of AGI for various income ranges: 2.5% for AGIs below $10k, 3.0% for AGIs $10k-25k, 6.0% for AGIs $25k-50k, 8.7% for AGIs $50k-75k, 10.0% for AGIs $75k-100k, 14.4% for AGIs over 100k)
Earned income credit: $1,866 (reported on 33.5% of returns)
Here:
$1,866
State:
$1,882
Percentage of individuals using paid preparers for their 2004 taxes: 72.5%
Here:
73%
State:
66%
(% for various income ranges: 70.9% for AGIs below $10k, 75.4% for AGIs $10k-25k, 68.6% for AGIs $25k-50k, 72.6% for AGIs $50k-75k, 80.5% for AGIs $75k-100k, 83.3% for AGIs over 100k)
Household received Food Stamps/SNAP in the past 12 months: 351 Household did not receive Food Stamps/SNAP in the past 12 months: 1,283
Women who had a birth in the past 12 months: 46 (16 now married, 28 unmarried) Women who did not have a birth in the past 12 months: 592 (252 now married, 340 unmarried)
Housing units in zip code 29112 with a mortgage: 399 (32 second mortgage, 33 both second mortgage and home equity loan) Houses without a mortgage: 5
Median monthly owner costs for units with a mortgage: $980 Median monthly owner costs for units without a mortgage: $334
Residents with income below the poverty level in 2022:
This zip code:
24.6%
Whole state:
14.0%
Residents with income below 50% of the poverty level in 2022:
This zip code:
11.4%
Whole state:
7.3%
Median number of rooms in houses and condos:
Here:
5.8
State:
6.4
Median number of rooms in apartments:
Here:
4.6
State:
4.5
Notable locations in this zip code not listed on our city pages
Notable locations in zip code 29112: Seven Oaks Poultry Farm (A), Orangeburg County Fire Department Wolfton (B), Orangeburg County Fire Department North Auxiliary Air Field (C), Orangeburg County Fire Department Wolfton Station 2 (D), Orangeburg County Fire Department North Station 2 (E), Orangeburg County Fire Department North (F). Display/hide their locations on the map
Churches in zip code 29112 include: Saint James Church (A), Salem Church (B), Norman Church (C), Flora Branch Church (D), Chapel Hill Church (E), Antioch Church (F), Trinity Church (G), Saint Peters Church (H), North United Methodist Church (I). Display/hide their locations on the map
Cemeteries: Saint James Cemetery (1), Shady Grove Cemetery (2), Trinity United Methodist Church Cemetery (3), Sunny Vista Church of God Cemetery (4), Salem Baptist Church Cemetery (5), Penn Branch Baptist Church Cemetery (6), North Pentecostal Holiness Church Cemetery (7). Display/hide their locations on the map
Reservoirs: Harleys Millpond (A), Amaker Pond (B), Etheredge Millpond (C), Culler Millpond (D), Culler Ponds (E), Gardner Pond (F), Midway Millpond (G), Jones Pond (H). Display/hide their locations on the map
Streams, rivers, and creeks: Persimmon Branch (A), Penn Branch (B), Pond Branch (C), Salem Creek (D), Little Beaver Creek (E), Bull Swamp Creek (F), Cowpen Swamp (G), Cow Branch (H), Gardner Branch (I). Display/hide their locations on the map
Size of family households: 698 2-persons, 134 3-persons, 152 4-persons, 49 5-persons, 3 6-persons, 20 7-or-more-persons
Size of nonfamily households: 520 1-person, 58 2-persons
415 married couples with children.
144 single-parent households (101 men, 43 women).
98.8% of residents of 29112 zip code speak English at home.
1.1% of residents speak Spanish at home (95% very well, 5% not well).
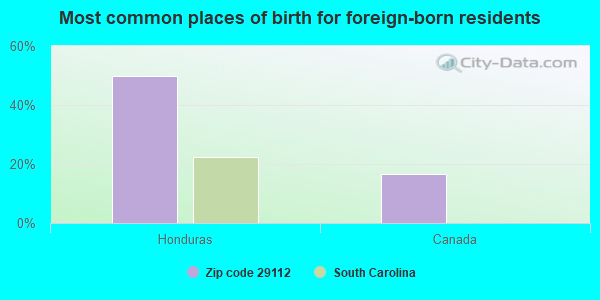
Foreign born population: 5 (0.2%) (36.7% of them are naturalized citizens)
This zip code:
0.2%
Whole state:
5.2%
50%Honduras
17%Canada
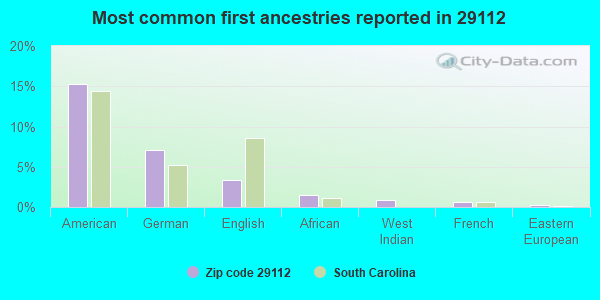
15%American
7%German
3%English
2%African
1%West Indian
1%French
0%Eastern European
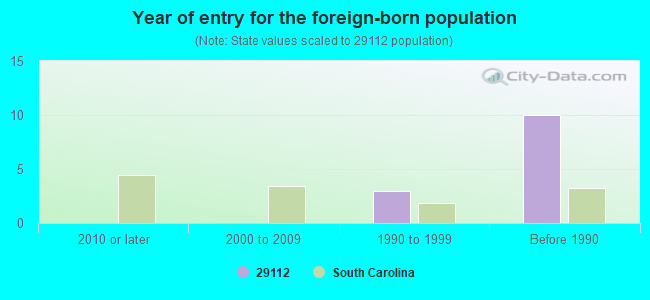
Year of entry for the foreign-born population
02010 or later
02000 to 2009
31990 to 1999
10Before 1990
Facilities with environmental interests located in this zip code:
FAST FARE SC-625 (700 MAIN STREET in NORTH, SC)
(Resource Conservation and Recovery Act (tracking hazardous waste)) STATE MASTER (South Carolina database) - HAZARDOUS WASTE PROGRAM STATE MASTER (South Carolina database) - UNDERGROUND STORAGE TANK PROGRAM Organizations: CROWN CENTRAL PETROLEUM CORP (CONTACT/OWNER)
Alternative names: SC625
DOUG FURTICK CHEVROLET (4427 SAVANNAH HWY in NORTH, SC)
Conditionally Exempt Small Quantity Generators, less than 100 kg/month of hazardous waste (Resource Conservation and Recovery Act (tracking hazardous waste)) - notification STATE MASTER (South Carolina database) - UNDERGROUND STORAGE TANK PROGRAM, HAZARDOUS WASTE PROGRAM Organizations: OPERNAME (CONTACT/OPERATOR)
, DOUGLAS FURTICK (CONTACT/OWNER)
CHARLESTON AFB:NORTH FIELD-EXEMPT (NA in NORTH, SC)
AIR MINOR (AIRS/AFS) Business SIC classification: SERVICES
Housing units lacking complete plumbing facilities: 11.0% Housing units lacking complete kitchen facilities: 12.3%
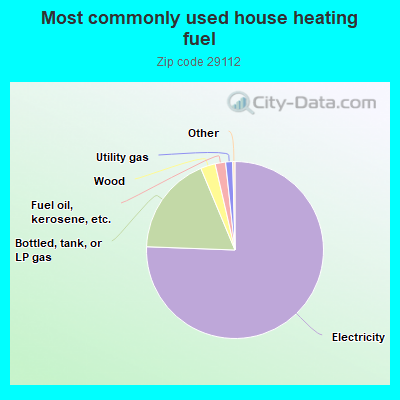
75.6%Electricity
18.1%Bottled, tank, or LP gas
2.7%Wood
1.9%Fuel oil, kerosene, etc.
1.3%Utility gas
Population in 1990: 3,410. Population change in the 1990s: +1,329 (+39.0%).
Place of birth for U.S.-born residents:
This state: 3,104
Northeast: 115
Midwest: 102
South: 281
West: 39
71% of the 29112 zip code residents lived in the same house 5 years ago. Out of people who lived in different houses, 62% lived in this county. Out of people who lived in different counties, 50% lived in South Carolina.
97% of the 29112 zip code residents lived in the same house 1 year ago. Out of people who lived in different houses, 54% moved from this county. Out of people who lived in different houses, 28% moved from different county within same state. Out of people who lived in different houses, 7% moved from abroad.
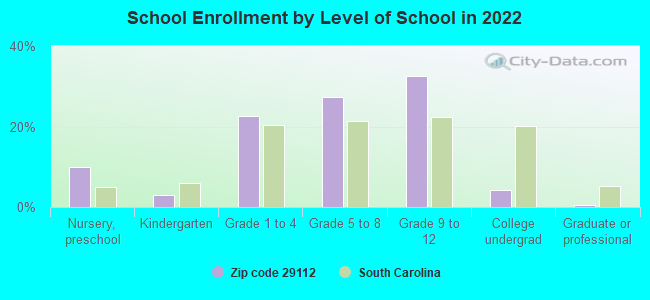
Private vs. public school enrollment:
Students in private schools in grades 1 to 8 (elementary and middle school): 18
Here:
5.8%
South Carolina:
14.4%
Students in private schools in grades 9 to 12 (high school): 34
Here:
16.1%
South Carolina:
11.1%
Students in private undergraduate colleges: 14
Here:
50.9%
South Carolina:
21.9%
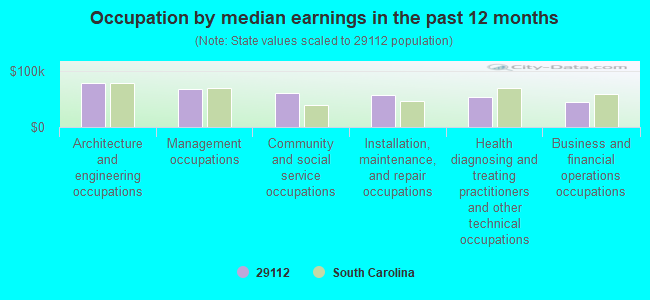
Occupation by median earnings in the past 12 months ($)
77,818Architecture and engineering occupations
67,310Management occupations
60,110Community and social service occupations
56,502Installation, maintenance, and repair occupations
53,975Health diagnosing and treating practitioners and other technical occupations
45,404Business and financial operations occupations
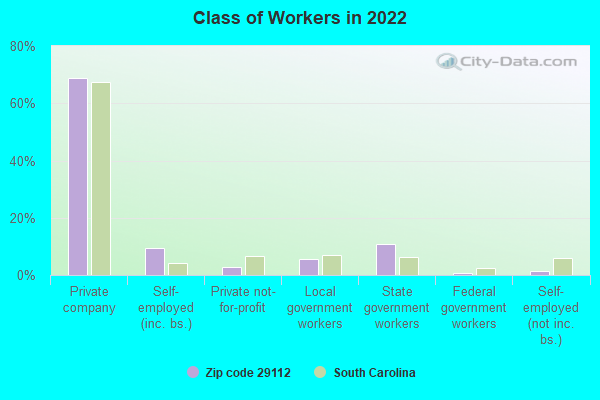
Top industries in this zip code by the number of employees in 2005:
2002 - 2018 National Fire Incident Reporting System (NFIRS) incidents
According to the data from the years 2002 - 2018 the average number of fire incidents per year is 70. The highest number of reported fires - 100 took place in 2014, and the least - 5 in 2002. The data has an increasing trend.
When looking into fire subcategories, the most incidents belonged to: Structure Fires (49.4%), and Outside Fires (33.6%).
Fire incident types reported to NFIRS in Zip Code 29112
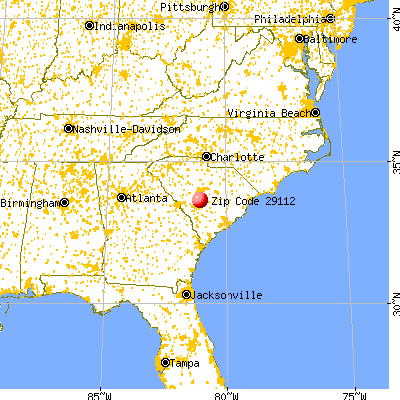


 Nearest zip codes: 29107, 29160, 29113, 29118, 29053, 29123.


 According to the data from the years 2002 - 2018 the average number of fire incidents per year is 70. The highest number of reported fires - 100 took place in 2014, and the least - 5 in 2002. The data has an increasing trend.
 When looking into fire subcategories, the most incidents belonged to: Structure Fires (49.4%), and Outside Fires (33.6%).