Estimated zip code population in 2022: 2,275 Zip code population in 2010: 1,618 Zip code population in 2000: 1,598
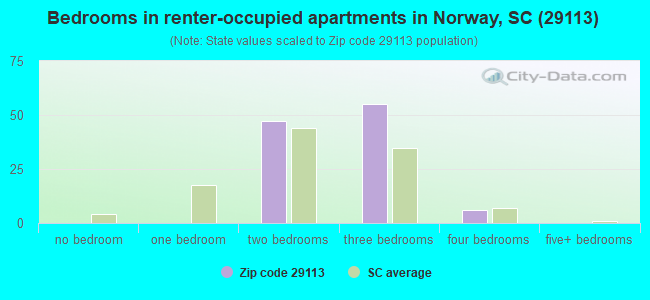
Houses and condos: 886 Renter-occupied apartments: 109
% of renters here:
16%
State:
28%
March 2022 cost of living index in zip code 29113: 79.3 (low, U.S. average is 100)
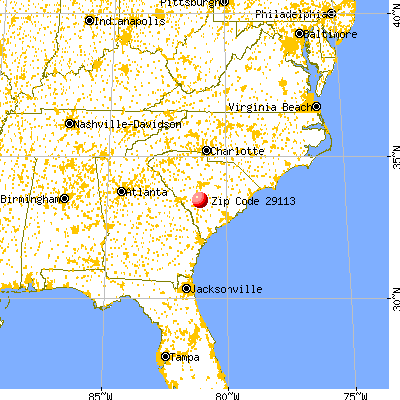
Land area: 43.1 sq. mi. Water area: 0.2 sq. mi.
Population density: 53 people per square mile
(very low).
OSM Map
General Map
Google Map
MSN Map
OSM Map
General Map
Google Map
MSN Map
OSM Map
General Map
Google Map
MSN Map
OSM Map
General Map
Google Map
MSN Map
Please wait while loading the map...
Real estate property taxes paid for housing units in 2022:
This zip code:
0.6% ($619)
South Carolina:
0.5% ($1,185)
Median real estate property taxes paid for housing units with mortgages in 2022: $837 (0.5%) Median real estate property taxes paid for housing units with no mortgage in 2022: $415 (0.5%)
Business Search- 14 Million verified businesses
Males: 1,125
(49.5%)
Females: 1,149
(50.5%)
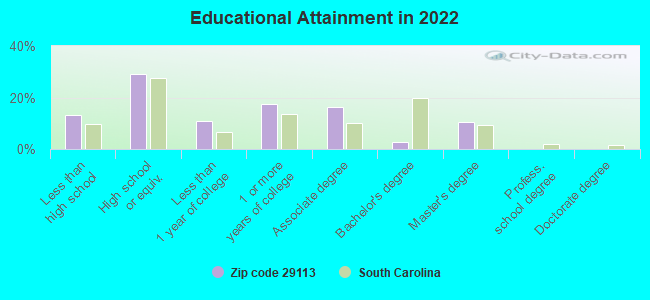
For population 25 years and over in 29113:
High school or higher: 84.6%
Bachelor's degree or higher: 13.1%
Graduate or professional degree: 10.4%
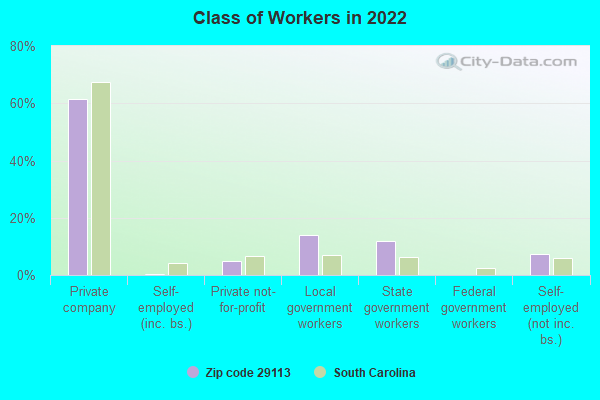
Unemployed: 24.7%
Mean travel time to work (commute): 30.3 minutes
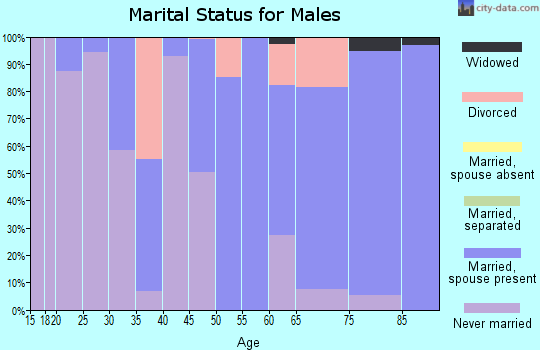
For population 15 years and over in 29113:
Never married: 41.4%
Now married: 42.8%
Separated: 1.7%
Widowed: 6.0%
Divorced: 8.1%
Zip code 29113 compared to state average:
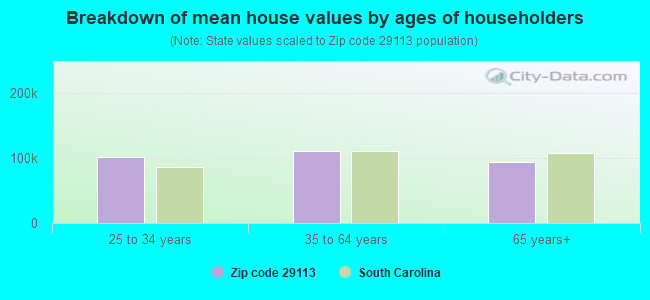
Median house value significantly below state average.
Unemployed percentage significantly above state average.
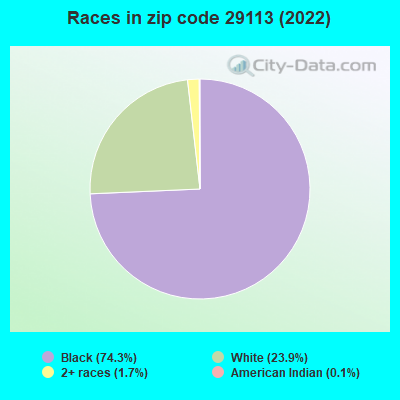
Black race population percentage significantly above state average.
Hispanic race population percentage significantly below state average.
Median age significantly below state average.
Foreign-born population percentage significantly below state average.
Renting percentage below state average.
Length of stay since moving in significantly above state average.
Number of college students below state average.
Percentage of population with a bachelor's degree or higher significantly below state average.
Estimated median house/condo value in 2022: $103,394
29113:
$103,394
South Carolina:
$254,600
Median resident age:
This zip code:
31.5 years
South Carolina median age:
40.5 years
Average household size:
This zip code:
3.4 people
South Carolina:
2.4 people
Averages for the 2020 tax year for zip code 29113, filed in 2021:
Average Adjusted Gross Income (AGI) in 2020: $44,654 (Individual Income Tax Returns)
Here:
$44,654
State:
$65,754
Salary/wage: $37,378 (reported on 84.6% of returns)
Here:
$37,378
State:
$52,566
(% of AGI for various income ranges: 1337.5% for AGIs below $25k, 3891.3% for AGIs $25k-50k, 9197.5% for AGIs $50k-75k, 9386.7% for AGIs $75k-100k, 27755.0% for AGIs $100k-200k)
Taxable interest for individuals: $690 (reported on 15.4% of returns)
This zip code:
$690
South Carolina:
$1,749
(% of AGI for various income ranges: 10.7% for AGIs $25k-50k, 25.0% for AGIs $50k-75k, 215.0% for AGIs $100k-200k)
Ordinary dividends: $1,017 (reported on 9.2% of returns)
Here:
$1,017
State:
$8,783
(% of AGI for various income ranges: 22.7% for AGIs $25k-50k, 90.0% for AGIs $75k-100k)
Net capital gain/loss in AGI: +$4,820 (reported on 7.7% of returns)
Here:
+$4,820
State:
+$24,194
(% of AGI for various income ranges: 89.0% for AGIs below $25k, 210.0% for AGIs $75k-100k)
Profit/loss from business: +$1,730 (reported on 15.4% of returns)
Here:
+$1,730
State:
+$11,253
(% of AGI for various income ranges: 144.0% for AGIs below $25k, 105.0% for AGIs $50k-75k)
Taxable individual retirement arrangement distribution: $8,167 (reported on 4.6% of returns)
29113:
$8,167
South Carolina:
$21,604
(% of AGI for various income ranges: 163.3% for AGIs $25k-50k)
Total itemized deductions: $21,633 (reported on 4.6% of returns)
Here:
$21,633
State:
$35,199
(% of AGI for various income ranges: 1622.5% for AGIs $50k-75k)
Charity contributions: $11,850 (reported on 3.1% of returns)
Here:
$11,850
State:
$14,319
(% of AGI for various income ranges: 158.0% for AGIs $25k-50k)
Taxes paid: $5,233 (reported on 4.6% of returns)
29113:
$5,233
State:
$7,486
(% of AGI for various income ranges: 392.5% for AGIs $50k-75k)
Earned income credit: $2,325 (reported on 30.8% of returns)
Here:
$2,325
State:
$2,397
(% of AGI for various income ranges: 154.5% for AGIs below $25k, 104.0% for AGIs $25k-50k)
Percentage of individuals using paid preparers for their 2020 taxes: 90.8%
Here:
91%
State:
93%
(% for various income ranges: 88.9% for AGIs below $25k, 94.7% for AGIs $25k-50k, 87.5% for AGIs $50k-75k, 100.0% for AGIs $75k-100k, 83.3% for AGIs $100k-200k)
Averages for the 2012 tax year for zip code 29113, filed in 2013:
Average Adjusted Gross Income (AGI) in 2012: $37,336 (Individual Income Tax Returns)
Here:
$37,336
State:
$51,133
Salary/wage: $30,144 (reported on 85.2% of returns)
Here:
$30,144
State:
$42,173
(% of AGI for various income ranges: 74.7% for AGIs below $25k, 86.5% for AGIs $25k-50k, 73.3% for AGIs $50k-75k, 46.4% for AGIs $100k-200k)
Taxable interest for individuals: $410 (reported on 16.4% of returns)
This zip code:
$410
South Carolina:
$1,468
(% of AGI for various income ranges: 0.3% for AGIs below $25k, 0.2% for AGIs $50k-75k, 0.2% for AGIs $100k-200k)
Ordinary dividends: $783 (reported on 9.8% of returns)
Here:
$783
State:
$6,511
Net capital gain/loss in AGI: +$10,833 (reported on 4.9% of returns)
Here:
+$10,833
State:
+$13,061
Profit/loss from business: +$7,088 (reported on 13.1% of returns)
Here:
+$7,088
State:
+$10,167
Taxable individual retirement arrangement distribution: $8,800 (reported on 4.9% of returns)
29113:
$8,800
South Carolina:
$17,019
Total itemized deductions: $20,617 (24% of AGI, reported on 19.7% of returns)
Here:
$20,617
State:
$22,890
Here:
24.4% of AGI
State:
21.4% of AGI
(% of AGI for various income ranges: 10.0% for AGIs $25k-50k, 16.0% for AGIs $50k-75k, 13.9% for AGIs $100k-200k)
Charity contributions: $5,780 (reported on 16.4% of returns)
Here:
$5,780
State:
$5,169
(% of AGI for various income ranges: 2.0% for AGIs $25k-50k, 3.5% for AGIs $50k-75k, 3.7% for AGIs $100k-200k)
Taxes paid: $7,055 (reported on 18.0% of returns)
29113:
$7,055
State:
$7,644
(% of AGI for various income ranges: 1.6% for AGIs $25k-50k, 4.1% for AGIs $50k-75k, 6.5% for AGIs $100k-200k)
Earned income credit: $2,650 (reported on 42.6% of returns)
Here:
$2,650
State:
$2,418
(% of AGI for various income ranges: 13.7% for AGIs below $25k, 1.8% for AGIs $25k-50k)
Percentage of individuals using paid preparers for their 2012 taxes: 59.0%
Here:
59%
State:
57%
(% for various income ranges: 58.1% for AGIs below $25k, 52.9% for AGIs $25k-50k, 55.6% for AGIs $50k-75k, 100.0% for AGIs $100k-200k)
Averages for the 2004 tax year for zip code 29113, filed in 2005:
Average Adjusted Gross Income (AGI) in 2004: $28,705 (Individual Income Tax Returns)
Here:
$28,705
State:
$41,965
Salary/wage: $26,756 (reported on 89.5% of returns)
Here:
$26,756
State:
$35,695
(% of AGI for various income ranges: 187.0% for AGIs below $10k, 89.2% for AGIs $10k-25k, 85.0% for AGIs $25k-50k, 86.2% for AGIs $50k-75k, 74.9% for AGIs $75k-100k, 62.2% for AGIs over 100k)
Taxable interest for individuals: $916 (reported on 20.4% of returns)
This zip code:
$916
South Carolina:
$1,623
(% of AGI for various income ranges: 1.1% for AGIs below $10k, 0.7% for AGIs $10k-25k, 1.0% for AGIs $25k-50k, 0.2% for AGIs $50k-75k, 0.9% for AGIs $75k-100k, 0.4% for AGIs over 100k)
Taxable dividends: $928 (reported on 9.8% of returns)
Here:
$928
State:
$3,999
(% of AGI for various income ranges: 0.4% for AGIs $10k-25k, 0.3% for AGIs $25k-50k, 0.6% for AGIs $50k-75k, 0.2% for AGIs over 100k)
Net capital gain/loss: +$229 (reported on 6.8% of returns)
Here:
+$229
State:
+$13,100
Profit/loss from business: +$161 (reported on 8.8% of returns)
Here:
+$161
State:
+$9,144
(% of AGI for various income ranges: -10.7% for AGIs below $10k, 2.7% for AGIs $10k-25k, -1.0% for AGIs $25k-50k, -0.1% for AGIs $50k-75k)
Total itemized deductions: $16,524 (24% of AGI, reported on 17.9% of returns)
Here:
$16,524
State:
$19,039
Here:
24.4% of AGI
State:
22.8% of AGI
(% of AGI for various income ranges: 6.1% for AGIs $10k-25k, 8.0% for AGIs $25k-50k, 12.3% for AGIs $50k-75k, 13.8% for AGIs $75k-100k, 16.8% for AGIs over 100k)
Charity contributions deductions: $4,355 (6% of AGI, reported on 15.2% of returns)
Here:
$4,355
State:
$4,305
Here:
6.3% of AGI
State:
5.0% of AGI
(% of AGI for various income ranges: 1.4% for AGIs $10k-25k, 1.5% for AGIs $25k-50k, 2.5% for AGIs $50k-75k, 4.5% for AGIs $75k-100k, 3.7% for AGIs over 100k)
Total tax: $4,066 (reported on 54.3% of returns)
29113:
$4,066
State:
$6,497
(% of AGI for various income ranges: 2.3% for AGIs below $10k, 2.3% for AGIs $10k-25k, 5.2% for AGIs $25k-50k, 7.7% for AGIs $50k-75k, 10.6% for AGIs $75k-100k, 17.5% for AGIs over 100k)
Earned income credit: $1,928 (reported on 41.6% of returns)
Here:
$1,928
State:
$1,882
Percentage of individuals using paid preparers for their 2004 taxes: 67.8%
Here:
68%
State:
66%
(% for various income ranges: 66.0% for AGIs below $10k, 66.3% for AGIs $10k-25k, 67.6% for AGIs $25k-50k, 66.1% for AGIs $50k-75k, 83.3% for AGIs $75k-100k, 87.0% for AGIs over 100k)
Household received Food Stamps/SNAP in the past 12 months: 150 Household did not receive Food Stamps/SNAP in the past 12 months: 532
Women who had a birth in the past 12 months: 58 (0 now married, 53 unmarried) Women who did not have a birth in the past 12 months: 439 (188 now married, 251 unmarried)
Housing units in zip code 29113 with a mortgage: 128 Houses without a mortgage: 1
Median monthly owner costs for units with a mortgage: $1,264 Median monthly owner costs for units without a mortgage: $371
Residents with income below the poverty level in 2022:
This zip code:
23.6%
Whole state:
14.0%
Residents with income below 50% of the poverty level in 2022:
This zip code:
23.1%
Whole state:
7.3%
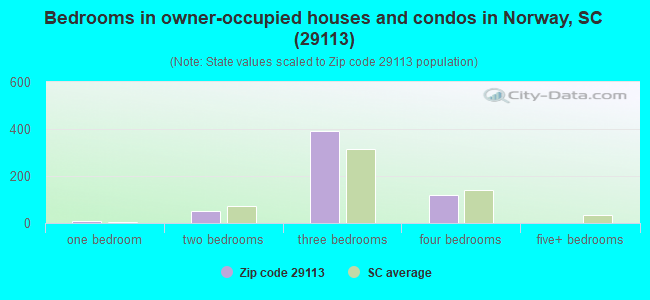
Median number of rooms in houses and condos:
Here:
5.5
State:
6.4
Median number of rooms in apartments:
Here:
5.0
State:
4.5
Notable locations in this zip code not listed on our city pages
Churches in zip code 29113 include: Pleasant Branch Church (A), Cedar Grove Church (B), Norway Baptist Church (C), Saint Johns United Methodist Church (D), Bushy Pond Church (E), Willow Swamp Baptist Church (F). Display/hide their locations on the map
Streams, rivers, and creeks: Deadfall Swamp (A), Bull Branch (B), Red Branch (C), Pleasant Branch (D), Scratchnose Swamp (E), Little River (F), Hayes Mill Creek (G). Display/hide their locations on the map
Size of family households: 289 2-persons, 86 3-persons, 133 4-persons, 6 5-persons, 13 6-persons, 48 7-or-more-persons
Size of nonfamily households: 91 1-person, 17 2-persons
97 married couples with children.
348 single-parent households (348 women).
85.3% of residents of 29113 zip code speak English at home.
8.0% of residents speak other language at home (100% very well).
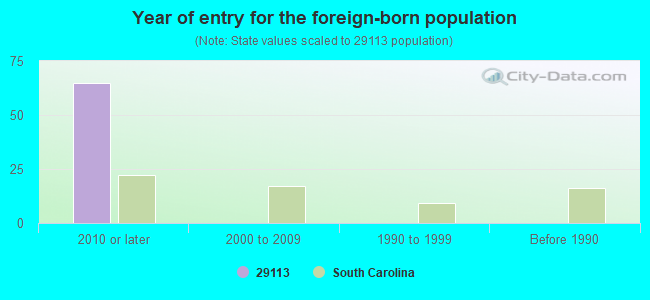
Foreign born population: 0 (0.0%)
:
0.0%
Whole state:
5.2%
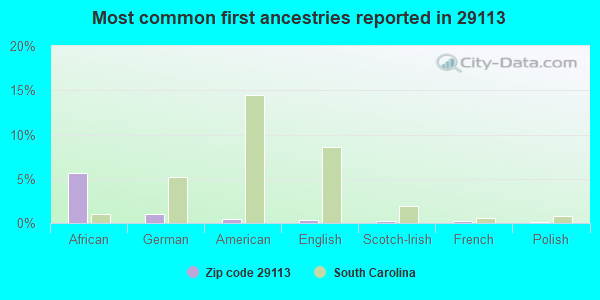
6%African
1%German
0%American
0%English
0%Scotch-Irish
0%French
0%Polish
Year of entry for the foreign-born population
652010 or later
02000 to 2009
01990 to 1999
0Before 1990
Facilities with environmental interests located in this zip code:
HARRELLS INC (509 3RD STREET in NORWAY, SC)
AIR MINOR (AIRS/AFS) STATE MASTER (South Carolina database) - AIR PROGRAM Business SIC classification: FERTILIZERS, MIXING ONLY; SERVICES Business NAICS classification: FERTILIZER (MIXING ONLY) MANUFACTURING.
Housing units lacking complete plumbing facilities: 14.9% Housing units lacking complete kitchen facilities: 13.1%
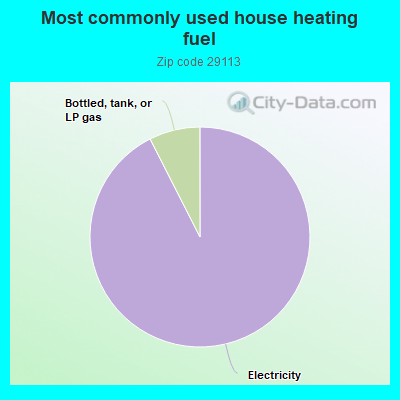
92.7%Electricity
7.5%Bottled, tank, or LP gas
Population in 1990: 2,487.
Place of birth for U.S.-born residents:
This state: 1,861
Northeast: 74
Midwest: 10
South: 222
West: 3
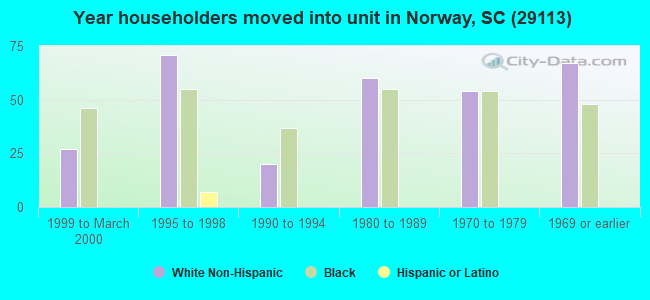
77% of the 29113 zip code residents lived in the same house 5 years ago. Out of people who lived in different houses, 65% lived in this county. Out of people who lived in different counties, 50% lived in South Carolina.
98% of the 29113 zip code residents lived in the same house 1 year ago. Out of people who lived in different houses, 18% moved from this county. Out of people who lived in different houses, 61% moved from different county within same state. Out of people who lived in different houses, 21% moved from different state.
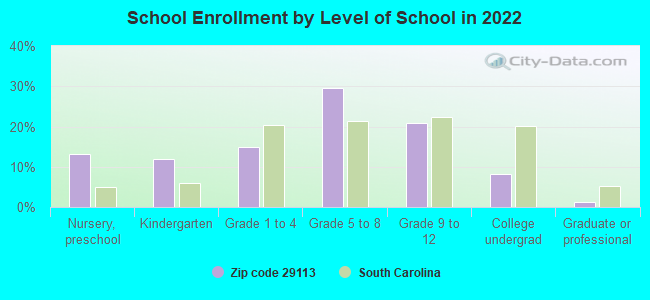
Private vs. public school enrollment:
Students in private schools in grades 1 to 8 (elementary and middle school): 24
Here:
9.1%
South Carolina:
14.4%
Students in private schools in grades 9 to 12 (high school): 60
Here:
47.4%
South Carolina:
11.1%
Students in private undergraduate colleges: 10
Here:
22.2%
South Carolina:
21.9%
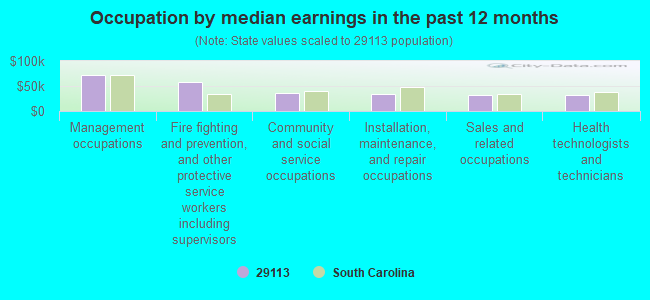
Occupation by median earnings in the past 12 months ($)
72,055Management occupations
57,768Fire fighting and prevention, and other protective service workers including supervisors
36,847Community and social service occupations
34,597Installation, maintenance, and repair occupations
32,994Sales and related occupations
32,459Health technologists and technicians
Top industries in this zip code by the number of employees in 2005:
Construction: Poured Concrete Foundation and Structure Contractors (10-19 employees: 1 establishment)
Other Services (except Public Administration): Religious Organizations (1-4: 4)
Accommodation and Food Services: Limited-Service Restaurants (5-9: 1)
Fatal accident statistics in 2013:
Fatal accident count: 1
Vehicles involved in fatal accidents: 1
Fatal accidents caused by drunken drivers: 1
Fatalities: 1
Persons involved in fatal accidents: 1
Pedestrians involved in fatal accidents: 0
2002 - 2018 National Fire Incident Reporting System (NFIRS) incidents
Based on the data from the years 2002 - 2018 the average number of fire incidents per year is 29. The highest number of fire incidents - 64 took place in 2010, and the least - 0 in 2003. The data has a rising trend.
When looking into fire subcategories, the most reports belonged to: Outside Fires (51.4%), and Structure Fires (31.7%).
Fire incident types reported to NFIRS in Zip Code 29113


 Nearest zip codes: 29107, 29042, 29817, 29038, 29146, 29112.


 Based on the data from the years 2002 - 2018 the average number of fire incidents per year is 29. The highest number of fire incidents - 64 took place in 2010, and the least - 0 in 2003. The data has a rising trend.
 When looking into fire subcategories, the most reports belonged to: Outside Fires (51.4%), and Structure Fires (31.7%).