Estimated zip code population in 2022: 9,287 Zip code population in 2010: 8,333 Zip code population in 2000: 7,485
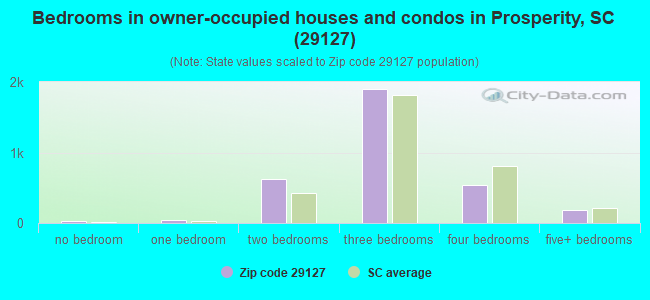
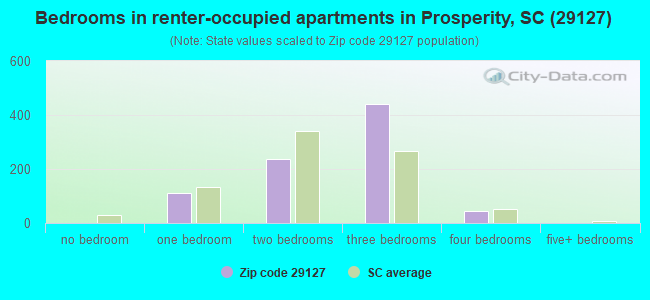
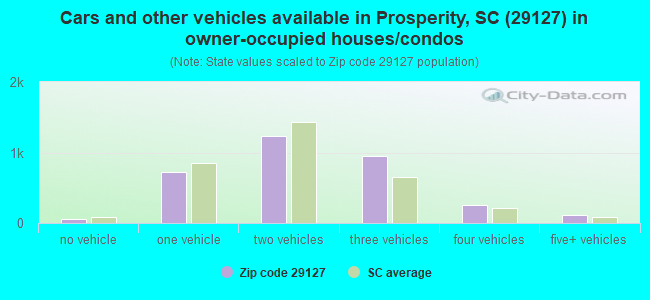
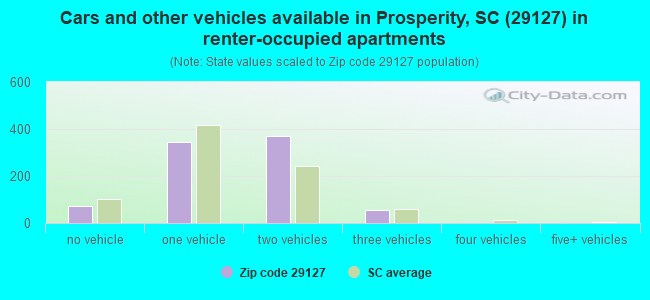
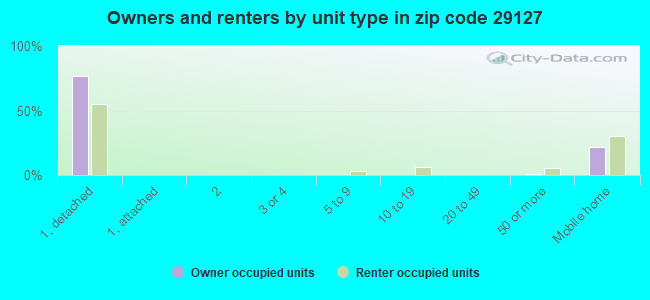
Houses and condos: 4,954 Renter-occupied apartments: 838
% of renters here:
20%
State:
28%
March 2022 cost of living index in zip code 29127: 82.1 (low, U.S. average is 100)
Land area: 102.5 sq. mi. Water area: 12.2 sq. mi.
Population density: 91 people per square mile
(very low).
OSM Map
General Map
Google Map
MSN Map
OSM Map
General Map
Google Map
MSN Map
OSM Map
General Map
Google Map
MSN Map
OSM Map
General Map
Google Map
MSN Map
Please wait while loading the map...
Real estate property taxes paid for housing units in 2022:
This zip code:
0.6% ($1,650)
South Carolina:
0.5% ($1,185)
Median real estate property taxes paid for housing units with mortgages in 2022: $1,677 (0.5%) Median real estate property taxes paid for housing units with no mortgage in 2022: $1,630 (0.7%)
Business Search- 14 Million verified businesses
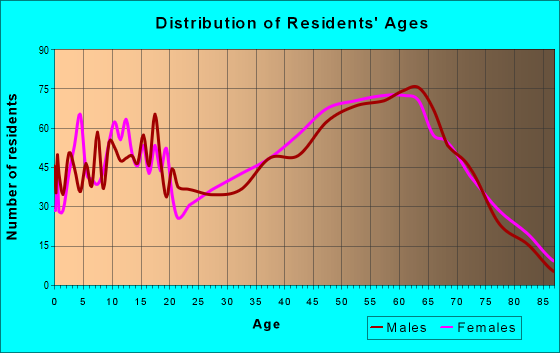
Males: 4,547
(49.0%)
Females: 4,739
(51.0%)
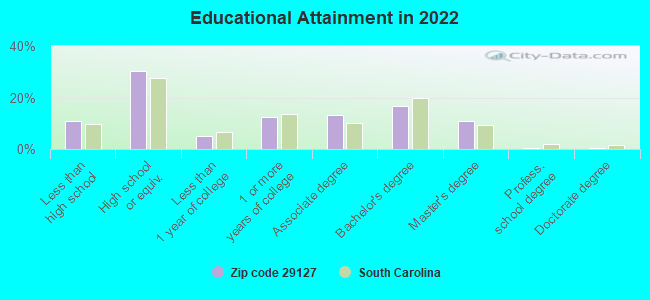
For population 25 years and over in 29127:
High school or higher: 88.5%
Bachelor's degree or higher: 27.8%
Graduate or professional degree: 11.4%
Unemployed: 1.2%
Mean travel time to work (commute): 26.9 minutes
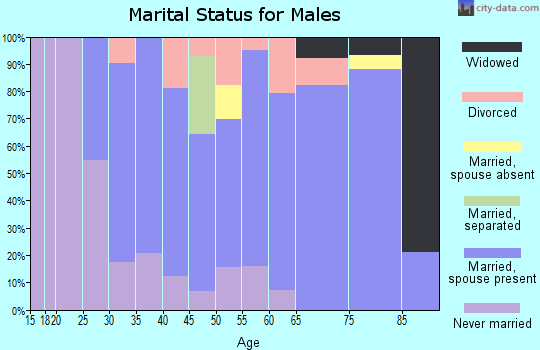
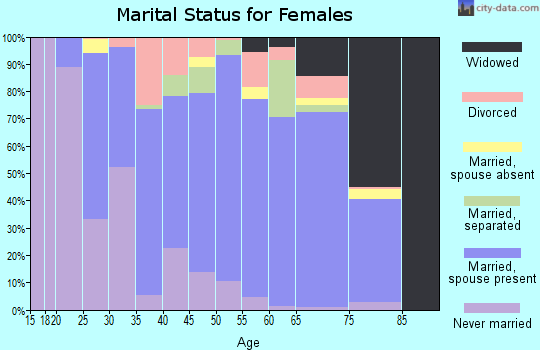
For population 15 years and over in 29127:
Never married: 21.7%
Now married: 59.7%
Separated: 1.7%
Widowed: 5.9%
Divorced: 11.0%
Zip code 29127 compared to state average:
Unemployed percentage significantly below state average.
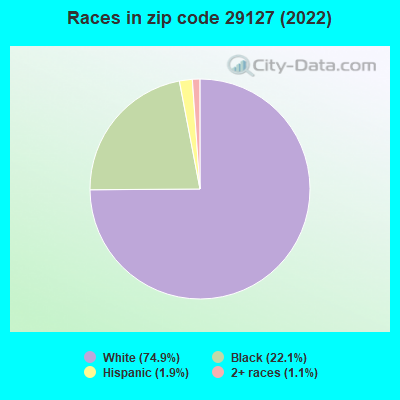
Hispanic race population percentage significantly below state average.
Median age significantly above state average.
Foreign-born population percentage significantly below state average.
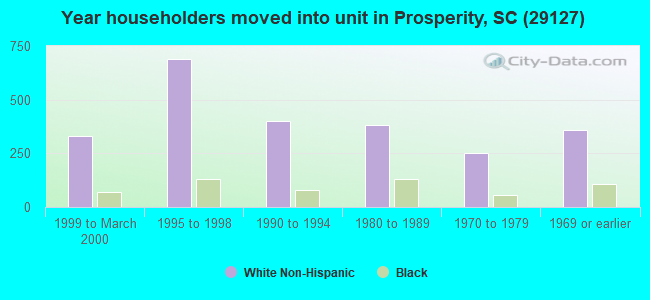
Length of stay since moving in significantly above state average.
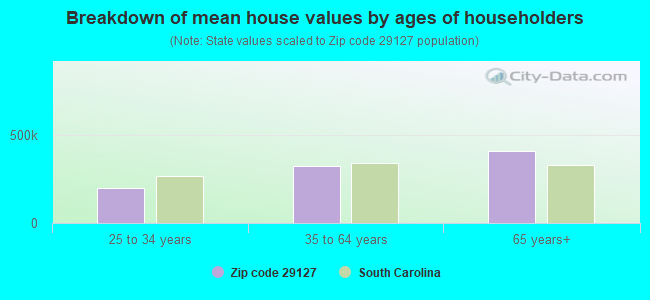
Estimated median house/condo value in 2022: $271,322
29127:
$271,322
South Carolina:
$254,600
According to our research of South Carolina and other state lists, there were 2 registered sex offenders living in 29127 zip code as of April 26, 2024. The ratio of all residents to sex offenders in zip code 29127 is 4,487 to 1. The ratio of registered sex offenders to all residents in this zip code is much lower than the state average.
Median resident age:
This zip code:
50.4 years
South Carolina median age:
40.5 years
Average household size:
This zip code:
2.2 people
South Carolina:
2.4 people
Averages for the 2020 tax year for zip code 29127, filed in 2021:
Average Adjusted Gross Income (AGI) in 2020: $73,310 (Individual Income Tax Returns)
Here:
$73,310
State:
$65,754
Salary/wage: $56,264 (reported on 78.4% of returns)
Here:
$56,264
State:
$52,566
(% of AGI for various income ranges: 1283.0% for AGIs below $25k, 3678.5% for AGIs $25k-50k, 6744.0% for AGIs $50k-75k, 9565.2% for AGIs $75k-100k, 18223.3% for AGIs $100k-200k, 81856.0% for AGIs over 200k)
Taxable interest for individuals: $1,489 (reported on 30.7% of returns)
This zip code:
$1,489
South Carolina:
$1,749
(% of AGI for various income ranges: 17.2% for AGIs below $25k, 34.9% for AGIs $25k-50k, 68.2% for AGIs $50k-75k, 83.7% for AGIs $75k-100k, 151.1% for AGIs $100k-200k, 1198.0% for AGIs over 200k)
Ordinary dividends: $5,152 (reported on 21.4% of returns)
Here:
$5,152
State:
$8,783
(% of AGI for various income ranges: 32.2% for AGIs below $25k, 46.1% for AGIs $25k-50k, 137.5% for AGIs $50k-75k, 165.9% for AGIs $75k-100k, 420.6% for AGIs $100k-200k, 3682.0% for AGIs over 200k)
Net capital gain/loss in AGI: +$24,500 (reported on 19.2% of returns)
Here:
+$24,500
State:
+$24,194
(% of AGI for various income ranges: 10.0% for AGIs below $25k, 32.3% for AGIs $25k-50k, 106.0% for AGIs $50k-75k, 213.7% for AGIs $75k-100k, 955.3% for AGIs $100k-200k, 33506.0% for AGIs over 200k)
Profit/loss from business: +$9,162 (reported on 14.8% of returns)
Here:
+$9,162
State:
+$11,253
(% of AGI for various income ranges: 39.8% for AGIs below $25k, 55.5% for AGIs $25k-50k, 101.5% for AGIs $50k-75k, 424.1% for AGIs $75k-100k, 355.6% for AGIs $100k-200k, 5102.0% for AGIs over 200k)
Taxable individual retirement arrangement distribution: $21,784 (reported on 13.5% of returns)
29127:
$21,784
South Carolina:
$21,604
(% of AGI for various income ranges: 84.0% for AGIs below $25k, 152.9% for AGIs $25k-50k, 462.0% for AGIs $50k-75k, 688.5% for AGIs $75k-100k, 1291.4% for AGIs $100k-200k, 6120.0% for AGIs over 200k)
Total itemized deductions: $32,497 (reported on 8.3% of returns)
Here:
$32,497
State:
$35,199
(% of AGI for various income ranges: 75.3% for AGIs below $25k, 202.5% for AGIs $25k-50k, 388.2% for AGIs $50k-75k, 482.2% for AGIs $75k-100k, 1021.1% for AGIs $100k-200k, 6788.0% for AGIs over 200k)
Charity contributions: $10,145 (reported on 6.3% of returns)
Here:
$10,145
State:
$14,319
(% of AGI for various income ranges: 17.0% for AGIs $25k-50k, 52.2% for AGIs $50k-75k, 107.8% for AGIs $75k-100k, 251.7% for AGIs $100k-200k, 2786.0% for AGIs over 200k)
Taxes paid: $7,076 (reported on 8.3% of returns)
29127:
$7,076
State:
$7,486
(% of AGI for various income ranges: 5.6% for AGIs below $25k, 19.6% for AGIs $25k-50k, 64.0% for AGIs $50k-75k, 117.4% for AGIs $75k-100k, 305.8% for AGIs $100k-200k, 1592.0% for AGIs over 200k)
Earned income credit: $2,388 (reported on 13.9% of returns)
Here:
$2,388
State:
$2,397
(% of AGI for various income ranges: 97.3% for AGIs below $25k, 70.7% for AGIs $25k-50k)
Percentage of individuals using paid preparers for their 2020 taxes: 92.4%
Here:
92%
State:
93%
(% for various income ranges: 92.8% for AGIs below $25k, 93.0% for AGIs $25k-50k, 90.6% for AGIs $50k-75k, 91.3% for AGIs $75k-100k, 92.0% for AGIs $100k-200k, 95.2% for AGIs over 200k)
Averages for the 2012 tax year for zip code 29127, filed in 2013:
Average Adjusted Gross Income (AGI) in 2012: $51,535 (Individual Income Tax Returns)
Here:
$51,535
State:
$51,133
Salary/wage: $43,428 (reported on 82.4% of returns)
Here:
$43,428
State:
$42,173
(% of AGI for various income ranges: 75.7% for AGIs below $25k, 77.6% for AGIs $25k-50k, 69.0% for AGIs $50k-75k, 68.5% for AGIs $75k-100k, 69.4% for AGIs $100k-200k, 55.0% for AGIs over 200k)
Taxable interest for individuals: $1,471 (reported on 32.4% of returns)
This zip code:
$1,471
South Carolina:
$1,468
(% of AGI for various income ranges: 0.9% for AGIs below $25k, 0.7% for AGIs $25k-50k, 1.1% for AGIs $50k-75k, 0.7% for AGIs $75k-100k, 1.2% for AGIs $100k-200k, 0.9% for AGIs over 200k)
Ordinary dividends: $3,225 (reported on 19.3% of returns)
Here:
$3,225
State:
$6,511
(% of AGI for various income ranges: 1.5% for AGIs below $25k, 0.8% for AGIs $25k-50k, 1.0% for AGIs $50k-75k, 1.1% for AGIs $75k-100k, 1.5% for AGIs $100k-200k, 1.6% for AGIs over 200k)
Net capital gain/loss in AGI: +$4,474 (reported on 16.3% of returns)
Here:
+$4,474
State:
+$13,061
(% of AGI for various income ranges: 0.3% for AGIs $25k-50k, 0.6% for AGIs $50k-75k, 0.6% for AGIs $75k-100k, 1.3% for AGIs $100k-200k, 6.4% for AGIs over 200k)
Profit/loss from business: +$10,800 (reported on 12.8% of returns)
Here:
+$10,800
State:
+$10,167
(% of AGI for various income ranges: 3.7% for AGIs below $25k, 2.4% for AGIs $25k-50k, 2.7% for AGIs $50k-75k, 0.9% for AGIs $75k-100k, 1.1% for AGIs $100k-200k, 7.9% for AGIs over 200k)
Taxable individual retirement arrangement distribution: $15,996 (reported on 12.6% of returns)
29127:
$15,996
South Carolina:
$17,019
(% of AGI for various income ranges: 4.3% for AGIs below $25k, 2.6% for AGIs $25k-50k, 3.4% for AGIs $50k-75k, 4.7% for AGIs $75k-100k, 4.2% for AGIs $100k-200k, 4.4% for AGIs over 200k)
Total itemized deductions: $21,569 (23% of AGI, reported on 31.9% of returns)
Here:
$21,569
State:
$22,890
Here:
22.9% of AGI
State:
21.4% of AGI
(% of AGI for various income ranges: 8.8% for AGIs below $25k, 8.8% for AGIs $25k-50k, 12.7% for AGIs $50k-75k, 14.0% for AGIs $75k-100k, 17.0% for AGIs $100k-200k, 16.1% for AGIs over 200k)
Charity contributions: $4,257 (reported on 27.4% of returns)
Here:
$4,257
State:
$5,169
(% of AGI for various income ranges: 0.9% for AGIs below $25k, 1.3% for AGIs $25k-50k, 1.9% for AGIs $50k-75k, 2.0% for AGIs $75k-100k, 3.1% for AGIs $100k-200k, 4.0% for AGIs over 200k)
Taxes paid: $7,523 (reported on 31.9% of returns)
29127:
$7,523
State:
$7,644
(% of AGI for various income ranges: 1.3% for AGIs below $25k, 2.2% for AGIs $25k-50k, 3.6% for AGIs $50k-75k, 4.9% for AGIs $75k-100k, 6.9% for AGIs $100k-200k, 7.4% for AGIs over 200k)
Earned income credit: $2,314 (reported on 18.6% of returns)
Here:
$2,314
State:
$2,418
(% of AGI for various income ranges: 6.8% for AGIs below $25k, 1.1% for AGIs $25k-50k)
Percentage of individuals using paid preparers for their 2012 taxes: 61.3%
Here:
61%
State:
57%
(% for various income ranges: 55.1% for AGIs below $25k, 62.0% for AGIs $25k-50k, 68.5% for AGIs $50k-75k, 64.3% for AGIs $75k-100k, 64.1% for AGIs $100k-200k, 87.5% for AGIs over 200k)
Averages for the 2004 tax year for zip code 29127, filed in 2005:
Average Adjusted Gross Income (AGI) in 2004: $40,764 (Individual Income Tax Returns)
Here:
$40,764
State:
$41,965
Salary/wage: $36,148 (reported on 83.6% of returns)
Here:
$36,148
State:
$35,695
(% of AGI for various income ranges: 128.4% for AGIs below $10k, 76.0% for AGIs $10k-25k, 78.8% for AGIs $25k-50k, 75.2% for AGIs $50k-75k, 72.6% for AGIs $75k-100k, 65.2% for AGIs over 100k)
Taxable interest for individuals: $1,328 (reported on 41.3% of returns)
This zip code:
$1,328
South Carolina:
$1,623
(% of AGI for various income ranges: 4.6% for AGIs below $10k, 1.9% for AGIs $10k-25k, 1.1% for AGIs $25k-50k, 1.2% for AGIs $50k-75k, 1.0% for AGIs $75k-100k, 1.5% for AGIs over 100k)
Taxable dividends: $1,753 (reported on 23.1% of returns)
Here:
$1,753
State:
$3,999
(% of AGI for various income ranges: 2.8% for AGIs below $10k, 1.3% for AGIs $10k-25k, 0.6% for AGIs $25k-50k, 0.8% for AGIs $50k-75k, 1.6% for AGIs $75k-100k, 0.9% for AGIs over 100k)
Net capital gain/loss: +$6,401 (reported on 18.6% of returns)
Here:
+$6,401
State:
+$13,100
(% of AGI for various income ranges: 1.3% for AGIs below $10k, 1.3% for AGIs $10k-25k, 1.6% for AGIs $25k-50k, 1.9% for AGIs $50k-75k, 3.1% for AGIs $75k-100k, 6.0% for AGIs over 100k)
Profit/loss from business: +$9,239 (reported on 14.1% of returns)
Here:
+$9,239
State:
+$9,144
(% of AGI for various income ranges: 2.0% for AGIs below $10k, 3.6% for AGIs $10k-25k, 2.6% for AGIs $25k-50k, 2.8% for AGIs $50k-75k, 2.4% for AGIs $75k-100k, 4.7% for AGIs over 100k)
IRA payment deduction: $3,213 (reported on 3.1% of returns)
29127:
$3,213
South Carolina:
$2,972
(% of AGI for various income ranges: 0.2% for AGIs $10k-25k, 0.3% for AGIs $25k-50k, 0.3% for AGIs $50k-75k, 0.2% for AGIs $75k-100k, 0.2% for AGIs over 100k)
Self-employed pension: $10,455 (reported on 0.6% of returns)
Here:
$10,455
South Carolina:
$15,117
Total itemized deductions: $17,058 (24% of AGI, reported on 33.1% of returns)
Here:
$17,058
State:
$19,039
Here:
23.6% of AGI
State:
22.8% of AGI
(% of AGI for various income ranges: 15.1% for AGIs below $10k, 8.1% for AGIs $10k-25k, 10.4% for AGIs $25k-50k, 14.5% for AGIs $50k-75k, 18.6% for AGIs $75k-100k, 16.2% for AGIs over 100k)
Charity contributions deductions: $3,297 (4% of AGI, reported on 28.9% of returns)
Here:
$3,297
State:
$4,305
Here:
4.4% of AGI
State:
5.0% of AGI
(% of AGI for various income ranges: 0.5% for AGIs below $10k, 1.0% for AGIs $10k-25k, 1.5% for AGIs $25k-50k, 2.3% for AGIs $50k-75k, 3.0% for AGIs $75k-100k, 3.5% for AGIs over 100k)
Total tax: $5,236 (reported on 74.4% of returns)
29127:
$5,236
State:
$6,497
(% of AGI for various income ranges: 2.9% for AGIs below $10k, 3.5% for AGIs $10k-25k, 6.6% for AGIs $25k-50k, 8.6% for AGIs $50k-75k, 9.9% for AGIs $75k-100k, 16.6% for AGIs over 100k)
Earned income credit: $1,789 (reported on 18.3% of returns)
Here:
$1,789
State:
$1,882
Percentage of individuals using paid preparers for their 2004 taxes: 68.1%
Here:
68%
State:
66%
(% for various income ranges: 58.1% for AGIs below $10k, 70.4% for AGIs $10k-25k, 69.7% for AGIs $25k-50k, 70.8% for AGIs $50k-75k, 69.7% for AGIs $75k-100k, 70.5% for AGIs over 100k)
Household received Food Stamps/SNAP in the past 12 months: 432 Household did not receive Food Stamps/SNAP in the past 12 months: 3,721
Women who had a birth in the past 12 months: 145 (110 now married, 37 unmarried) Women who did not have a birth in the past 12 months: 1,617 (883 now married, 741 unmarried)
Housing units in zip code 29127 with a mortgage: 1,655 (199 second mortgage, 36 home equity loan, 136 both second mortgage and home equity loan) Houses without a mortgage: 127
Median monthly owner costs for units with a mortgage: $1,283 Median monthly owner costs for units without a mortgage: $420
Residents with income below the poverty level in 2022:
This zip code:
10.9%
Whole state:
14.0%
Residents with income below 50% of the poverty level in 2022:
This zip code:
5.2%
Whole state:
7.3%
Median number of rooms in houses and condos:
Here:
6.1
State:
6.4
Median number of rooms in apartments:
Here:
5.1
State:
4.5
Notable locations in this zip code not listed on our city pages
Notable locations in zip code 29127: Jollystreet (A), Newberry County Rural Fire Department Fairview (B), Newberry County Rural Fire Department Stoney Hill (C), Newberry County Rural Fire Department O'Neal (D), Newberry County Rural Fire Department Saint Phillips (E), Newberry County Rural Fire Department Prosperity (F). Display/hide their locations on the map
Churches in zip code 29127 include: Oak Grove Church (A), Mount Tabor Lutheran Church (B), Mount Pilgrim Lutheran Church (C), Mount Olivet Lutheran Church (D), Mount Olive Church (E), Mount Moriah Church (F), Bachman Chapel Lutheran Church (G), Boozer Chapel (H), Bethel Church (I). Display/hide their locations on the map
Cemeteries: Bachman Chapel Cemetery (1), Bethel Cemetery (2), Macedonia Cemetery (3), Mount Moriah Cemetery (4), Mount Olivet Cemetery (5), Mount Pilgrim Cemetery (6), O'Neal Cemetery (7). Display/hide their locations on the map
Streams, rivers, and creeks: Susannah Branch (A), Snap Branch (B), Little Creek (C), Hawleek Creek (D), Kerr Creek (E), Bush River (F), Buffalo Creek (G), Big Creek (H). Display/hide their locations on the map
1,065 married couples with children.
634 single-parent households (132 men, 502 women).
98.2% of residents of 29127 zip code speak English at home.
1.6% of residents speak Spanish at home (97% very well, 3% well).
0.3% of residents speak other Indo-European language at home (40% very well, 60% well).
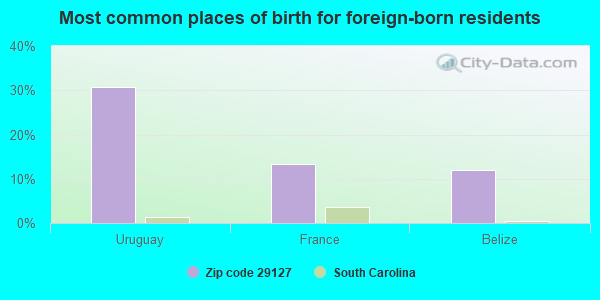
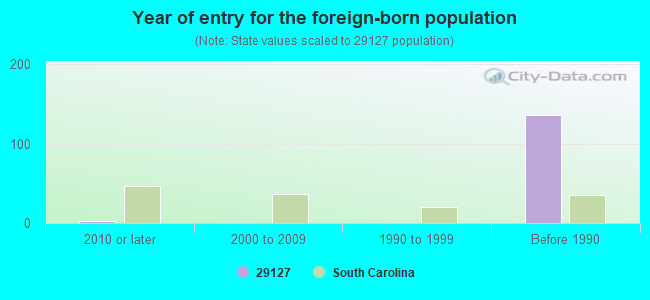
Foreign born population: 148 (1.6%) (72.1% of them are naturalized citizens)
This zip code:
1.6%
Whole state:
5.2%
31%Uruguay
13%France
12%Belize
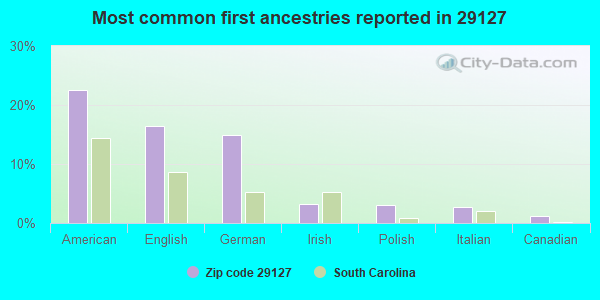
23%American
16%English
15%German
3%Irish
3%Polish
3%Italian
1%Canadian
Year of entry for the foreign-born population
22010 or later
02000 to 2009
01990 to 1999
136Before 1990
Facilities with environmental interests located in this zip code:
FOREST HILLS SD/ELBO INC (HWY 76 BEFORE PROSPERITY in PROSPERITY, SC)
National Pollutant Discharge Elimination System NON-MAJOR (Tracking pollutant discharge elimination systems) - permit STATE MASTER (South Carolina database) - National Pollutant Discharge Elimination System Permit Business SIC classification: OPERATORS OF DWELLINGS OTHER THAN APARTMENT BUILDINGS
CHAPARRAL STEEL (SEE NOTE in PROSPERITY, SC)
AIR MINOR (AIRS/AFS) Business SIC classification: STEEL WORKS, BLAST FURNACES (INCLUDING COKE OVENS), AND ROLLING MILLS
Housing units lacking complete plumbing facilities: 2.3% Housing units lacking complete kitchen facilities: 1.4%
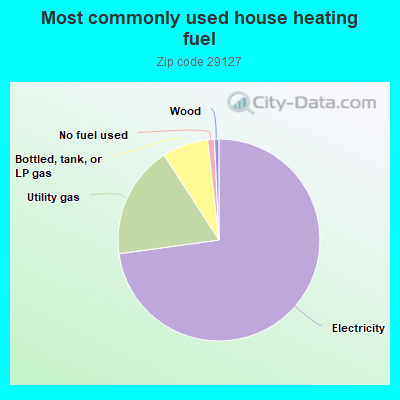
72.6%Electricity
18.0%Utility gas
7.3%Bottled, tank, or LP gas
1.1%No fuel used
0.7%Wood
Population in 1990: 4,782. Population change in the 1990s: +2,703 (+56.5%).
Place of birth for U.S.-born residents:
This state: 6,640
Northeast: 624
Midwest: 498
South: 1,091
West: 189
63% of the 29127 zip code residents lived in the same house 5 years ago. Out of people who lived in different houses, 48% lived in this county. Out of people who lived in different counties, 50% lived in South Carolina.
93% of the 29127 zip code residents lived in the same house 1 year ago. Out of people who lived in different houses, 35% moved from this county. Out of people who lived in different houses, 29% moved from different county within same state. Out of people who lived in different houses, 32% moved from different state. Out of people who lived in different houses, 5% moved from abroad.
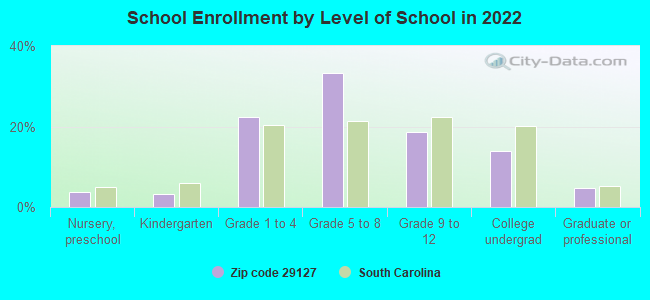
Private vs. public school enrollment:
Students in private schools in grades 1 to 8 (elementary and middle school): 80
Here:
8.4%
South Carolina:
14.4%
Students in private schools in grades 9 to 12 (high school): 51
Here:
15.8%
South Carolina:
11.1%
Students in private undergraduate colleges: 26
Here:
11.0%
South Carolina:
21.9%
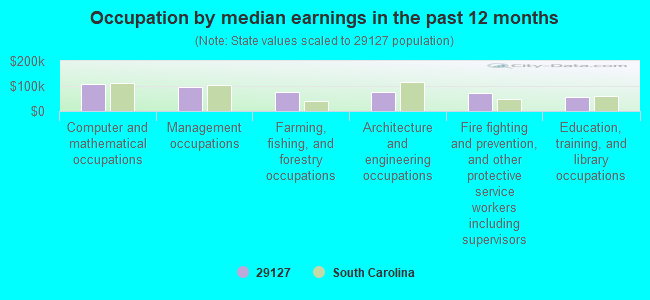
Occupation by median earnings in the past 12 months ($)
107,462Computer and mathematical occupations
94,266Management occupations
76,758Farming, fishing, and forestry occupations
74,466Architecture and engineering occupations
70,519Fire fighting and prevention, and other protective service workers including supervisors
56,856Education, training, and library occupations
Companies with federal contracts located in this zip code:
PETE DUTY AND ASSOCIATES (86 MELROSE PLACE in PROSPERITY, SC; small business)
$11,075 with Bureau of Prisoners/Federal Prison System for Compressors and Vacuum Pumps. Signed on 2005-02-16. Completion date: 2005-04-16.
HYDRAULIC SPECIALISTS (2865 WHEELAND SCHOOL RD in PROSPERITY, SC; small business) : $5,372 in 4 contractsfrom 2004 to 2005
$1,937 with Navy for Maintenance, Repair and Rebuilding of Equipment -- Vehicular Equipment Components. Signed on 2004-12-14. Completion date: 2004-12-23.
$1,650, same as above.Signed on 2005-01-03. Completion date: 2004-12-23.
$1,235, same as above.Signed on 2005-03-03. Completion date: 2004-12-23.
$550, same as above.Signed on 2004-12-16. Completion date: 2004-12-23.
Top industries in this zip code by the number of employees in 2005:
Wholesale Trade: Industrial and Personal Service Paper Merchant Wholesalers (50-99 employees: 1 establishment)
Health Care and Social Assistance: Child Day Care Services (20-49: 1, 10-19: 1)
Professional, Scientific, and Technical Services: Offices of Certified Public Accountants (20-49: 1)
Real Estate and Rental and Leasing: Truck, Utility Trailer, and RV (Recreational Vehicle) Rental and Leasing (20-49: 1)
People in group quarters in 2010:
34 people in group homes intended for adults
People in group quarters in 2000:
22 people in homes for the mentally retarded
11 people in homes for the mentally ill
Fatal accident statistics in 2013:
Fatal accident count: 2
Vehicles involved in fatal accidents: 3
Fatal accidents caused by drunken drivers: 1
Fatalities: 2
Persons involved in fatal accidents: 3
Pedestrians involved in fatal accidents: 0
2002 - 2018 National Fire Incident Reporting System (NFIRS) incidents
According to the data from the years 2002 - 2018 the average number of fire incidents per year is 12. The highest number of reported fires - 62 took place in 2018, and the least - 0 in 2003. The data has an increasing trend.
When looking into fire subcategories, the most incidents belonged to: Structure Fires (40.0%), and Outside Fires (39.5%).
Fire incident types reported to NFIRS in Zip Code 29127
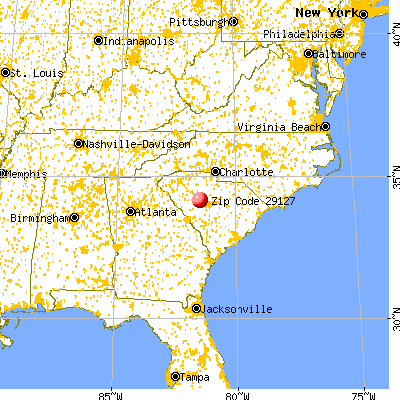


 Nearest zip codes: 29036, 29108, 29126, 29122, 29075, 29070.


 According to the data from the years 2002 - 2018 the average number of fire incidents per year is 12. The highest number of reported fires - 62 took place in 2018, and the least - 0 in 2003. The data has an increasing trend.
 When looking into fire subcategories, the most incidents belonged to: Structure Fires (40.0%), and Outside Fires (39.5%).