Estimated zip code population in 2022: 56,593 Zip code population in 2010: 48,642 Zip code population in 2000: 35,993
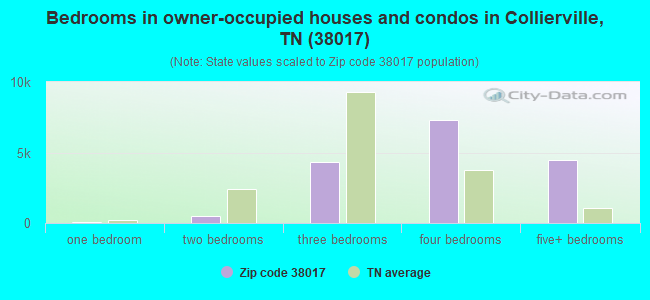
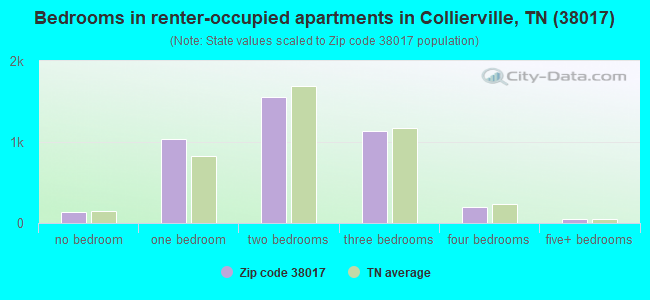
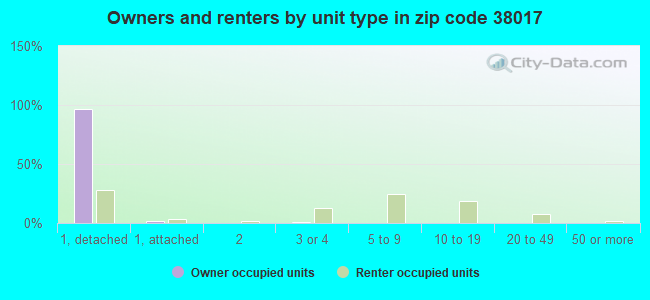
Houses and condos: 21,128 Renter-occupied apartments: 4,115
% of renters here:
20%
State:
33%
March 2022 cost of living index in zip code 38017: 87.6 (less than average, U.S. average is 100)
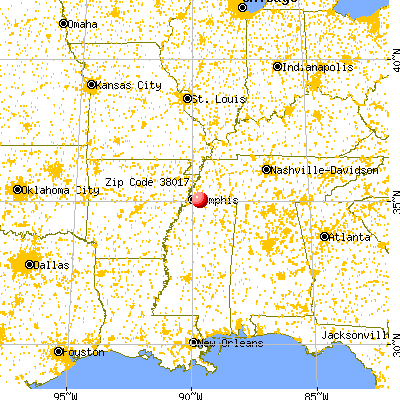
Land area: 84.8 sq. mi. Water area: 0.6 sq. mi.
Population density: 668 people per square mile
(low).
OSM Map
General Map
Google Map
MSN Map
OSM Map
General Map
Google Map
MSN Map
OSM Map
General Map
Google Map
MSN Map
OSM Map
General Map
Google Map
MSN Map
Please wait while loading the map...
Real estate property taxes paid for housing units in 2022:
This zip code:
0.9% ($4,401)
Tennessee:
0.5% ($1,376)
Median real estate property taxes paid for housing units with mortgages in 2022: $4,502 (0.8%) Median real estate property taxes paid for housing units with no mortgage in 2022: $4,190 (0.9%)
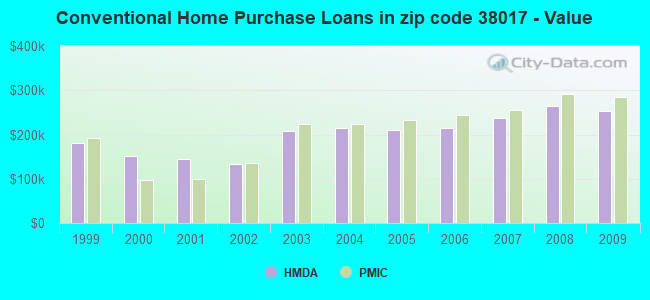
Estimated median house/condo value in 2022: $511,315
38017:
$511,315
Tennessee:
$284,800
According to our research of Tennessee and other state lists, there were 23 registered sex offenders living in 38017 zip code as of April 27, 2024. The ratio of all residents to sex offenders in zip code 38017 is 2,306 to 1. The ratio of registered sex offenders to all residents in this zip code is much lower than the state average.
Median resident age:
This zip code:
41.3 years
Tennessee median age:
39.2 years
Average household size:
This zip code:
2.8 people
Tennessee:
2.4 people
Averages for the 2020 tax year for zip code 38017, filed in 2021:
Average Adjusted Gross Income (AGI) in 2020: $133,839 (Individual Income Tax Returns)
Here:
$133,839
State:
$69,014
Salary/wage: $110,757 (reported on 82.2% of returns)
Here:
$110,757
State:
$55,872
(% of AGI for various income ranges: 1163.8% for AGIs below $25k, 3609.3% for AGIs $25k-50k, 6448.8% for AGIs $50k-75k, 9279.8% for AGIs $75k-100k, 18896.8% for AGIs $100k-200k, 75604.5% for AGIs over 200k)
Taxable interest for individuals: $2,504 (reported on 40.9% of returns)
This zip code:
$2,504
Tennessee:
$1,945
(% of AGI for various income ranges: 18.2% for AGIs below $25k, 38.0% for AGIs $25k-50k, 56.0% for AGIs $50k-75k, 86.0% for AGIs $75k-100k, 139.8% for AGIs $100k-200k, 1051.4% for AGIs over 200k)
Ordinary dividends: $6,706 (reported on 32.4% of returns)
Here:
$6,706
State:
$8,105
(% of AGI for various income ranges: 38.7% for AGIs below $25k, 68.9% for AGIs $25k-50k, 134.8% for AGIs $50k-75k, 171.5% for AGIs $75k-100k, 329.4% for AGIs $100k-200k, 2159.9% for AGIs over 200k)
Net capital gain/loss in AGI: +$19,493 (reported on 30.2% of returns)
Here:
+$19,493
State:
+$33,664
(% of AGI for various income ranges: 25.8% for AGIs below $25k, 86.4% for AGIs $25k-50k, 123.7% for AGIs $50k-75k, 198.3% for AGIs $75k-100k, 548.1% for AGIs $100k-200k, 7644.4% for AGIs over 200k)
Profit/loss from business: +$32,493 (reported on 19.4% of returns)
Here:
+$32,493
State:
+$18,991
(% of AGI for various income ranges: 91.5% for AGIs below $25k, 172.3% for AGIs $25k-50k, 259.0% for AGIs $50k-75k, 421.2% for AGIs $75k-100k, 850.8% for AGIs $100k-200k, 6892.9% for AGIs over 200k)
Taxable individual retirement arrangement distribution: $25,224 (reported on 11.1% of returns)
38017:
$25,224
Tennessee:
$20,036
(% of AGI for various income ranges: 66.5% for AGIs below $25k, 148.7% for AGIs $25k-50k, 260.8% for AGIs $50k-75k, 428.8% for AGIs $75k-100k, 725.5% for AGIs $100k-200k, 1613.4% for AGIs over 200k)
Self-employed (Keogh) retirement plans: $26,663 (reported on 1.5% of returns)
38017:
$26,663
Tennessee:
$28,955
(% of AGI for various income ranges: 19.6% for AGIs $50k-75k, 47.6% for AGIs $100k-200k, 493.4% for AGIs over 200k)
Total itemized deductions: $41,452 (reported on 16.8% of returns)
Here:
$41,452
State:
$40,136
(% of AGI for various income ranges: 91.8% for AGIs below $25k, 241.4% for AGIs $25k-50k, 461.2% for AGIs $50k-75k, 607.6% for AGIs $75k-100k, 1191.2% for AGIs $100k-200k, 6569.9% for AGIs over 200k)
Charity contributions: $19,136 (reported on 15.3% of returns)
Here:
$19,136
State:
$19,852
(% of AGI for various income ranges: 7.8% for AGIs below $25k, 49.1% for AGIs $25k-50k, 113.3% for AGIs $50k-75k, 166.7% for AGIs $75k-100k, 410.0% for AGIs $100k-200k, 3332.6% for AGIs over 200k)
Taxes paid: $7,678 (reported on 16.6% of returns)
38017:
$7,678
State:
$6,038
(% of AGI for various income ranges: 14.4% for AGIs below $25k, 40.9% for AGIs $25k-50k, 93.3% for AGIs $50k-75k, 130.2% for AGIs $75k-100k, 266.3% for AGIs $100k-200k, 1077.3% for AGIs over 200k)
Earned income credit: $2,151 (reported on 7.5% of returns)
Here:
$2,151
State:
$2,391
(% of AGI for various income ranges: 64.8% for AGIs below $25k, 54.3% for AGIs $25k-50k, 0.5% for AGIs $50k-75k)
Percentage of individuals using paid preparers for their 2020 taxes: 92.8%
Here:
93%
State:
93%
(% for various income ranges: 91.5% for AGIs below $25k, 92.2% for AGIs $25k-50k, 91.9% for AGIs $50k-75k, 93.2% for AGIs $75k-100k, 93.2% for AGIs $100k-200k, 94.8% for AGIs over 200k)
Averages for the 2012 tax year for zip code 38017, filed in 2013:
Average Adjusted Gross Income (AGI) in 2012: $104,722 (Individual Income Tax Returns)
Here:
$104,722
State:
$53,767
Salary/wage: $94,323 (reported on 86.6% of returns)
Here:
$94,323
State:
$45,421
(% of AGI for various income ranges: 78.1% for AGIs below $25k, 77.2% for AGIs $25k-50k, 76.1% for AGIs $50k-75k, 77.6% for AGIs $75k-100k, 82.3% for AGIs $100k-200k, 75.3% for AGIs over 200k)
Taxable interest for individuals: $1,503 (reported on 41.8% of returns)
This zip code:
$1,503
Tennessee:
$1,732
(% of AGI for various income ranges: 1.4% for AGIs below $25k, 0.8% for AGIs $25k-50k, 0.7% for AGIs $50k-75k, 0.7% for AGIs $75k-100k, 0.4% for AGIs $100k-200k, 0.6% for AGIs over 200k)
Ordinary dividends: $4,930 (reported on 29.8% of returns)
Here:
$4,930
State:
$6,739
(% of AGI for various income ranges: 2.0% for AGIs below $25k, 1.2% for AGIs $25k-50k, 1.2% for AGIs $50k-75k, 1.1% for AGIs $75k-100k, 1.0% for AGIs $100k-200k, 1.8% for AGIs over 200k)
Net capital gain/loss in AGI: +$10,868 (reported on 24.8% of returns)
Here:
+$10,868
State:
+$19,082
(% of AGI for various income ranges: 0.1% for AGIs $25k-50k, 0.2% for AGIs $50k-75k, 0.5% for AGIs $75k-100k, 0.6% for AGIs $100k-200k, 5.2% for AGIs over 200k)
Profit/loss from business: +$26,724 (reported on 17.9% of returns)
Here:
+$26,724
State:
+$15,240
(% of AGI for various income ranges: 6.7% for AGIs below $25k, 4.0% for AGIs $25k-50k, 3.6% for AGIs $50k-75k, 4.3% for AGIs $75k-100k, 3.9% for AGIs $100k-200k, 5.2% for AGIs over 200k)
Taxable individual retirement arrangement distribution: $19,148 (reported on 10.8% of returns)
38017:
$19,148
Tennessee:
$15,505
(% of AGI for various income ranges: 3.1% for AGIs below $25k, 2.8% for AGIs $25k-50k, 3.0% for AGIs $50k-75k, 3.0% for AGIs $75k-100k, 2.3% for AGIs $100k-200k, 1.2% for AGIs over 200k)
Self-employment retirement plans: $20,430 (reported on 1.3% of returns)
38017:
$20,430
Tennessee:
$22,567
(% of AGI for various income ranges: 0.2% for AGIs $50k-75k, 0.2% for AGIs $100k-200k, 0.4% for AGIs over 200k)
Total itemized deductions: $27,533 (16% of AGI, reported on 49.8% of returns)
Here:
$27,533
State:
$21,976
Here:
16.2% of AGI
State:
17.8% of AGI
(% of AGI for various income ranges: 12.3% for AGIs below $25k, 14.4% for AGIs $25k-50k, 15.6% for AGIs $50k-75k, 16.2% for AGIs $75k-100k, 14.8% for AGIs $100k-200k, 10.8% for AGIs over 200k)
Charity contributions: $8,057 (reported on 45.8% of returns)
Here:
$8,057
State:
$6,709
(% of AGI for various income ranges: 1.3% for AGIs below $25k, 2.3% for AGIs $25k-50k, 2.9% for AGIs $50k-75k, 3.1% for AGIs $75k-100k, 3.3% for AGIs $100k-200k, 4.1% for AGIs over 200k)
Taxes paid: $7,385 (reported on 49.5% of returns)
38017:
$7,385
State:
$4,829
(% of AGI for various income ranges: 2.4% for AGIs below $25k, 3.8% for AGIs $25k-50k, 3.9% for AGIs $50k-75k, 4.4% for AGIs $75k-100k, 4.3% for AGIs $100k-200k, 2.8% for AGIs over 200k)
Earned income credit: $2,226 (reported on 8.7% of returns)
Here:
$2,226
State:
$2,404
(% of AGI for various income ranges: 5.0% for AGIs below $25k, 0.8% for AGIs $25k-50k)
Percentage of individuals using paid preparers for their 2012 taxes: 50.1%
Here:
50%
State:
52%
(% for various income ranges: 44.9% for AGIs below $25k, 50.3% for AGIs $25k-50k, 51.9% for AGIs $50k-75k, 50.7% for AGIs $75k-100k, 48.6% for AGIs $100k-200k, 63.6% for AGIs over 200k)
Averages for the 2004 tax year for zip code 38017, filed in 2005:
Average Adjusted Gross Income (AGI) in 2004: $82,013 (Individual Income Tax Returns)
Here:
$82,013
State:
$44,088
Salary/wage: $74,848 (reported on 87.9% of returns)
Here:
$74,848
State:
$38,825
(% of AGI for various income ranges: 155.7% for AGIs below $10k, 77.9% for AGIs $10k-25k, 79.5% for AGIs $25k-50k, 81.2% for AGIs $50k-75k, 86.4% for AGIs $75k-100k, 78.4% for AGIs over 100k)
Taxable interest for individuals: $1,642 (reported on 51.4% of returns)
This zip code:
$1,642
Tennessee:
$1,802
(% of AGI for various income ranges: 7.7% for AGIs below $10k, 2.4% for AGIs $10k-25k, 1.6% for AGIs $25k-50k, 1.2% for AGIs $50k-75k, 0.6% for AGIs $75k-100k, 0.9% for AGIs over 100k)
Taxable dividends: $2,765 (reported on 33.0% of returns)
Here:
$2,765
State:
$3,727
(% of AGI for various income ranges: 5.9% for AGIs below $10k, 1.5% for AGIs $10k-25k, 1.2% for AGIs $25k-50k, 0.8% for AGIs $50k-75k, 0.8% for AGIs $75k-100k, 1.1% for AGIs over 100k)
Net capital gain/loss: +$10,581 (reported on 28.4% of returns)
Here:
+$10,581
State:
+$15,776
(% of AGI for various income ranges: 4.5% for AGIs below $10k, 0.3% for AGIs $10k-25k, 0.5% for AGIs $25k-50k, 0.5% for AGIs $50k-75k, 0.9% for AGIs $75k-100k, 5.1% for AGIs over 100k)
Profit/loss from business: +$23,678 (reported on 17.3% of returns)
Here:
+$23,678
State:
+$12,882
(% of AGI for various income ranges: -2.1% for AGIs below $10k, 5.2% for AGIs $10k-25k, 3.9% for AGIs $25k-50k, 5.0% for AGIs $50k-75k, 3.6% for AGIs $75k-100k, 5.4% for AGIs over 100k)
IRA payment deduction: $3,382 (reported on 3.0% of returns)
38017:
$3,382
Tennessee:
$2,934
(% of AGI for various income ranges: 0.2% for AGIs $10k-25k, 0.3% for AGIs $25k-50k, 0.2% for AGIs $50k-75k, 0.2% for AGIs $75k-100k, 0.1% for AGIs over 100k)
Self-employed pension: $16,519 (reported on 1.5% of returns)
Here:
$16,519
Tennessee:
$16,857
(% of AGI for various income ranges: 0.1% for AGIs $25k-50k, 0.1% for AGIs $50k-75k, 0.1% for AGIs $75k-100k, 0.4% for AGIs over 100k)
Total itemized deductions: $23,759 (19% of AGI, reported on 54.1% of returns)
Here:
$23,759
State:
$18,035
Here:
19.1% of AGI
State:
19.9% of AGI
(% of AGI for various income ranges: 17.4% for AGIs below $10k, 12.5% for AGIs $10k-25k, 17.4% for AGIs $25k-50k, 20.0% for AGIs $50k-75k, 19.2% for AGIs $75k-100k, 14.3% for AGIs over 100k)
Charity contributions deductions: $5,609 (4% of AGI, reported on 50.4% of returns)
Here:
$5,609
State:
$5,167
Here:
4.4% of AGI
State:
5.3% of AGI
(% of AGI for various income ranges: 0.8% for AGIs below $10k, 1.9% for AGIs $10k-25k, 3.0% for AGIs $25k-50k, 3.6% for AGIs $50k-75k, 3.5% for AGIs $75k-100k, 3.5% for AGIs over 100k)
Total tax: $15,306 (reported on 81.8% of returns)
38017:
$15,306
State:
$7,482
(% of AGI for various income ranges: 5.1% for AGIs below $10k, 4.5% for AGIs $10k-25k, 6.9% for AGIs $25k-50k, 8.7% for AGIs $50k-75k, 9.8% for AGIs $75k-100k, 18.7% for AGIs over 100k)
Earned income credit: $1,683 (reported on 7.7% of returns)
Here:
$1,683
State:
$1,826
Percentage of individuals using paid preparers for their 2004 taxes: 51.1%
Here:
51%
State:
60%
(% for various income ranges: 41.7% for AGIs below $10k, 54.2% for AGIs $10k-25k, 57.7% for AGIs $25k-50k, 52.4% for AGIs $50k-75k, 48.0% for AGIs $75k-100k, 52.6% for AGIs over 100k)
Likely homosexual households (counted as self-reported same-sex unmarried-partner households)
Lesbian couples: 0.0% of all households
Gay men: 0.2% of all households
Household received Food Stamps/SNAP in the past 12 months: 488 Household did not receive Food Stamps/SNAP in the past 12 months: 20,184
Women who had a birth in the past 12 months: 384 (372 now married, 18 unmarried) Women who did not have a birth in the past 12 months: 13,006 (7,228 now married, 5,781 unmarried)
Housing units in zip code 38017 with a mortgage: 11,378 (1,554 second mortgage, 10 home equity loan, 1,514 both second mortgage and home equity loan) Houses without a mortgage: 97
Median monthly owner costs for units with a mortgage: $2,498 Median monthly owner costs for units without a mortgage: $834
Residents with income below the poverty level in 2022:
This zip code:
2.5%
Whole state:
13.3%
Residents with income below 50% of the poverty level in 2022:
This zip code:
1.3%
Whole state:
7.1%
Median number of rooms in houses and condos:
Here:
8.4
State:
6.5
Median number of rooms in apartments:
Here:
4.1
State:
4.4
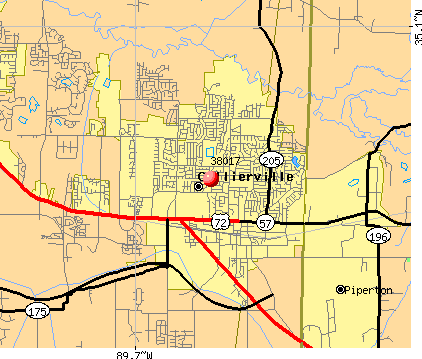
Notable locations in this zip code not listed on our city pages
Notable locations in zip code 38017: Highgrove Farms (A), Frank Road Landfill (B), Collierville Northwest Sewage Treatment Plant (C), Collierville Sewage Treatment Plant (D), Collierville Fire and Rescue Station 2 (E), Collierville Fire and Rescue Station 1 (F), Collierville Fire and Rescue Station 5 (G), Piperton Fire Department (H), West Fayette Volunteer Fire (I), Piperton City Hall (J), Collierville Fire and Rescue Station 3 (K), Rural / Metro Ambulance Memphis (L). Display/hide their locations on the map
Shopping Centers: Collierville Shopping Center (1), City Shopping Center (2), Great Oaks Shopping Center (3), Roseview Shopping Center (4). Display/hide their locations on the map
Churches in zip code 38017 include: Mount Olive Missionary Baptist Church Number Two (A), Collierville Church of God in Christ (B), Saint James Church (C), Mount Olive Church (D), Collierville Baptist Church (E), Collierville Christian Church (F), Collierville Church of Christ (G), Collierville Church of God (H), Collierville Presbyterian Church (I). Display/hide their locations on the map
Cemeteries: Jenkins Cemetery (1), Walker Cemetery (2), Yancy Cemetery (3), Abington Cemetery (4), Anthony Cemetery (5), Magnolia Cemetery (6), Tabernacle Cemetery (7). Display/hide their locations on the map
Lakes and reservoirs: Pine Lake (A), Scenic Lake (B), Log Cabin Lake (C), Herb Parsons Lake (D), Catfish Lake (E), Cow Lake (F), Stotts Lake (G), Marys Creek Lake Number Nine (H). Display/hide their locations on the map
In group quarters: 123 (-1 institutionalized population)
Size of family households: 6,912 2-persons, 3,272 3-persons, 4,098 4-persons, 1,337 5-persons, 322 6-persons, 359 7-or-more-persons
Size of nonfamily households: 3,779 1-person, 435 2-persons, 30 3-persons
11,757 married couples with children.
1,515 single-parent households (616 men, 899 women).
85.2% of residents of 38017 zip code speak English at home.
1.9% of residents speak Spanish at home (75% very well, 10% well, 14% not well, 2% not at all).
5.1% of residents speak other Indo-European language at home (86% very well, 9% well, 6% not well).
6.8% of residents speak Asian or Pacific Island language at home (77% very well, 14% well, 7% not well, 2% not at all).
1.3% of residents speak other language at home (94% very well, 6% well).
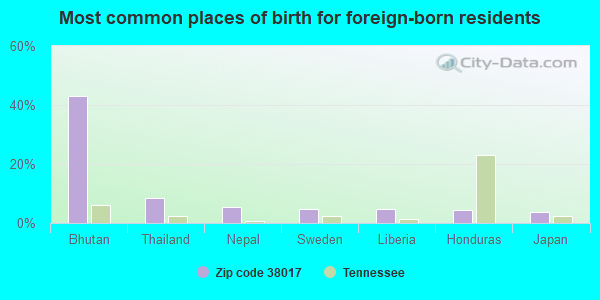
Foreign born population: 7,221 (12.8%) (39.5% of them are naturalized citizens)
This zip code:
12.8%
Whole state:
5.6%
43%Bhutan
8%Thailand
5%Nepal
5%Sweden
5%Liberia
4%Honduras
4%Japan
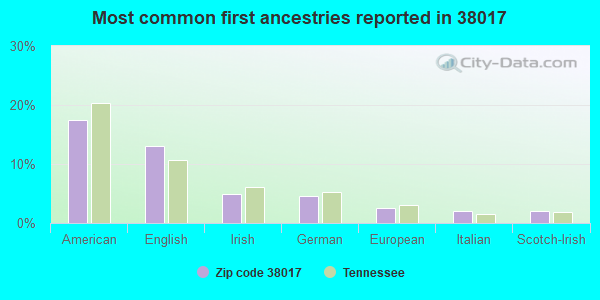
17%American
13%English
5%Irish
5%German
2%European
2%Italian
2%Scotch-Irish
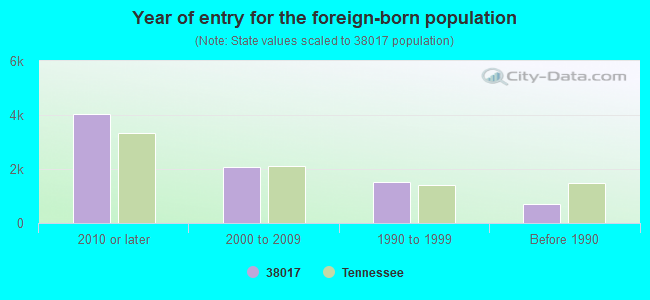
Year of entry for the foreign-born population
4,0432010 or later
2,0712000 to 2009
1,5131990 to 1999
687Before 1990
Major facilities with environmental interests located in this zip code:
ALPHA OWENS CORNING L L C TENNESSEE PLANT (860 HIGHWAY 57 EAST in COLLIERVILLE, TN)
AIR SYNTHETIC MINOR (AIRS/AFS) COMPLIANCE ACTIVITY (Tracking inspections of insecticide, fungicide, and rodenticide, and toxic substances) CRITERIA AND HAZARDOUS AIR POLLUTANT INVENTORY (Inventory of air pollution sources) National Pollutant Discharge Elimination System NON-MAJOR (Tracking pollutant discharge elimination systems) - permit HAZARDOUS WASTE BIENNIAL REPORTER (Resource Conservation and Recovery Act (tracking hazardous waste)) - ICIS-, ENFORCEMENT/COMPLIANCE ACTIVITY Large Quantity Generators, more that 1000 kg of hazardous waste/month (Resource Conservation and Recovery Act (tracking hazardous waste)) - notification - ICIS-, ENFORCEMENT/COMPLIANCE ACTIVITY TSD (Resource Conservation and Recovery Act (tracking hazardous waste)) - ICIS-, ENFORCEMENT/COMPLIANCE ACTIVITY TRI REPORTER (Tracking of toxic chemicals releasing facilities) Business SIC classification: PLASTICS MATERIALS, SYNTHETIC RESINS, AND NONVULCANIZABLE ELASTOMERS Business NAICS classification: PLASTICS MATERIAL AND RESIN MANUFACTURING.; PLASTICS MATERIAL AND RESIN MANUFACTURING. Organizations: NICHOLAS PRATO, PLANT MANAGER (CONTACT/OPERATOR)
, LISA HODGE (CONTACT/OWNER)
, ALPHA CORPORATION (CONTACT/OWNER)
Alternative names: ALPHA CORPORATION OF TENNESSEE, ALPHA/OWENS-CORNING, ALPHA RESINS, AOC L.L.C., TENNESSEE PLANT, AOC, LLC, AOC-TENNESSEE PLANT
COLLIERVILLE ELEMENTARY SCHOOL (590 PETERSON LAKE RD in COLLIERVILLE, TN)
(Geographic Names Information System) (National Center for Education Statistics) - STATE ID-0055 Organizations: SHELBY COUNTY SCHOOL DISTRICT (SCHOOL DISTRICT)
COLLIERVILLE HIGH SCHOOL (1101 N BYHALIA RD in COLLIERVILLE, TN)
(Geographic Names Information System) (National Center for Education Statistics) - STATE ID-0060 Organizations: SHELBY COUNTY SCHOOL DISTRICT (SCHOOL DISTRICT)
COLLIERVILLE MIDDLE SCHOOL (146 COLLEGE ST in COLLIERVILLE, TN)
(Geographic Names Information System) (National Center for Education Statistics) - STATE ID-0063 Organizations: SHELBY COUNTY SCHOOL DISTRICT (SCHOOL DISTRICT)
CROSSWIND ELEMENTARY (831 WEST SHELTON RD in COLLIERVILLE, TN)
(National Center for Education Statistics) - STATE ID-0065 Organizations: SHELBY COUNTY SCHOOL DISTRICT (SCHOOL DISTRICT)
COLLERVILLE STATION (858 WINGO ROAD in CAYCE, MS)
HAZARDOUS WASTE BIENNIAL REPORTER (Resource Conservation and Recovery Act (tracking hazardous waste)) (Resource Conservation and Recovery Act (tracking hazardous waste)) Organizations: SHELL PIPELINE COMPANY (CONTACT/OPERATOR)
, MOTIVA ENTERPRISES LLC (CONTACT/OWNER)
Alternative names: SHELL OIL COMPANY
CITY CONCRETE COMPANY (80 COMMERCE DRIVE in PIPERTON, TN)
National Pollutant Discharge Elimination System NON-MAJOR (Tracking pollutant discharge elimination systems) - permit Business SIC classification: READY-MIXED CONCRETE
DONALD R & LOLA STACKS (HIGHWAY 54 NEXT TO MEADOW'S CO in COLLIERVILLE, TN)
(Resource Conservation and Recovery Act (tracking hazardous waste)) Organizations: DONALD R STACKS (CONTACT/OPERATOR)
, STACKS SOLID SURFACE (CONTACT/OWNER)
A M I INC (490 HWY #57 W in COLLIERVILLE, TN)
(Resource Conservation and Recovery Act (tracking hazardous waste))
AMOCO OIL SS# 4389 (679 W POPLAR in COLLIERVILLE, TN)
(Resource Conservation and Recovery Act (tracking hazardous waste)) Business NAICS classification: OTHER FUEL DEALERS.; ALL OTHER AUTOMOTIVE REPAIR AND MAINTENANCE.
AOC TN PLANT (920 HWY 57 EAST in COLLIERVILLE, TN)
Conditionally Exempt Small Quantity Generators, less than 100 kg/month of hazardous waste (Resource Conservation and Recovery Act (tracking hazardous waste)) - notification Business NAICS classification: INORGANIC DYE AND PIGMENT MANUFACTURING. Organizations: ALPHA CORP (CONTACT/OWNER)
, CHROMA TEK (CONTACT/OWNER)
BANNER CHEVROLET, INC (615 W POPLAR in COLLIERVILLE, TN)
(Resource Conservation and Recovery Act (tracking hazardous waste)) Business NAICS classification: ALL OTHER AUTOMOTIVE REPAIR AND MAINTENANCE.
CLEAN 'N' PRESS (826 W POPLAR in COLLIERVILLE, TN)
(Resource Conservation and Recovery Act (tracking hazardous waste))
Housing units lacking complete plumbing facilities: 0.1% Housing units lacking complete kitchen facilities: 0.6%
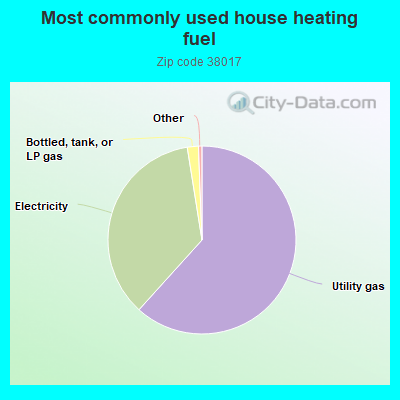
61.7%Utility gas
35.8%Electricity
1.9%Bottled, tank, or LP gas
Population in 1990: 16,164. Population change in the 1990s: +19,829 (+122.7%).
Place of birth for U.S.-born residents:
This state: 25,425
Northeast: 3,280
Midwest: 5,566
South: 12,380
West: 2,191
46% of the 38017 zip code residents lived in the same house 5 years ago. Out of people who lived in different houses, 56% lived in this county. Out of people who lived in different counties, 50% lived in Tennessee.
88% of the 38017 zip code residents lived in the same house 1 year ago. Out of people who lived in different houses, 53% moved from this county. Out of people who lived in different houses, 6% moved from different county within same state. Out of people who lived in different houses, 38% moved from different state. Out of people who lived in different houses, 3% moved from abroad.
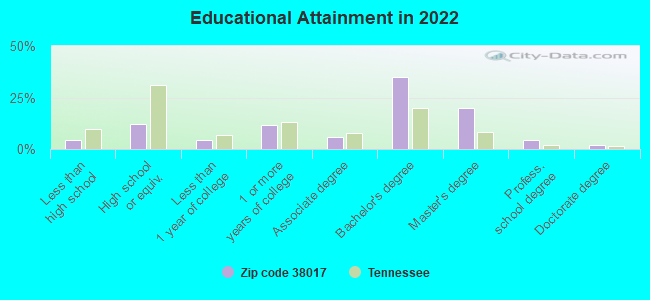
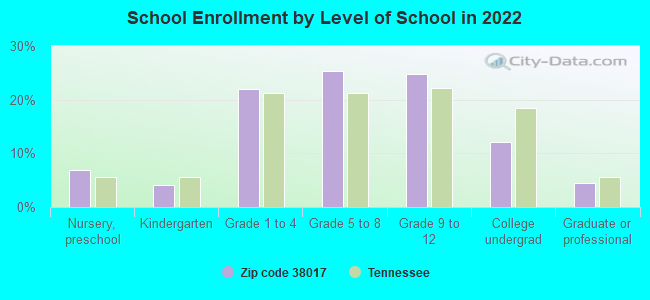
Private vs. public school enrollment:
Students in private schools in grades 1 to 8 (elementary and middle school): 1,600
Here:
21.8%
Tennessee:
15.0%
Students in private schools in grades 9 to 12 (high school): 875
Here:
22.8%
Tennessee:
16.2%
Students in private undergraduate colleges: 426
Here:
22.8%
Tennessee:
23.5%
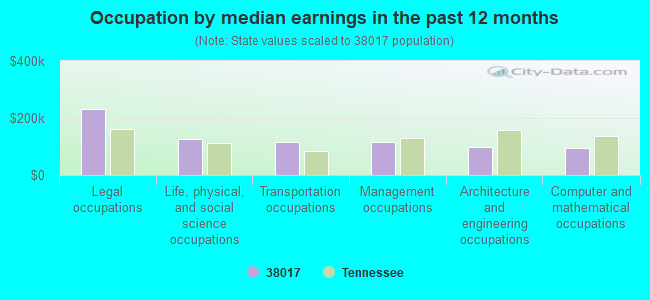
Occupation by median earnings in the past 12 months ($)
232,675Legal occupations
125,459Life, physical, and social science occupations
116,759Transportation occupations
114,171Management occupations
98,321Architecture and engineering occupations
95,048Computer and mathematical occupations
Companies with federal contracts located in this zip code (COLLIERVILLE, TN):
J-LINE PUMP CO (185 PROGRESS RD; small business) : $3,049,384 in 31 contractsfrom 2003 to 2006
Contracts for Power and Hand Pumps by Army Signed by year:2000: $0; 2001: $0; 2002: $0; 2003: $1,420,268; 2004: $651,667; 2005: $938,039; 2006: $39,410.
Biggest contracts:
$408,595 with Army for Power and Hand Pumps. Signed on 2005-04-27. Completion date: 2010-12-30.
$406,668, same as above.Signed on 2003-04-21. Completion date: 2010-12-30.
$400,944, same as above.Signed on 2005-06-30. Completion date: 2010-12-30.
$362,968, same as above.Signed on 2003-10-07. Completion date: 2004-06-30.
PYRAMEX SAFETY PRODUCTS LLC (281-A MOORE LN; small business) : $1,054,128 in 24 contractsfrom 2004 to 2006
Contracts for Safety and Rescue Equipment, Individual Equipment, Glass Fabricated Materials by Defense Logistics Agency, Army Signed by year:2000: $0; 2001: $0; 2002: $0; 2003: $0; 2004: $325,638; 2005: $605,826; 2006: $122,664.
Biggest contracts:
$97,325 with Defense Logistics Agency for Safety and Rescue Equipment. Signed on 2004-10-31. Completion date: 2004-11-05.
$96,195, same as above.Signed on 2005-05-04. Completion date: 2005-06-04.
$91,200, same as above.Signed on 2005-04-08. Completion date: 2005-05-30.
$88,729, same as above.Signed on 2005-02-28. Completion date: 2005-03-07.
FEDERAL PROTECTION & INTELLIGE (984 SUMMER SPRINGS ROAD; small business)
$209,088 with Navy for Lease or Rental of Facilities -- Troop Housing Facilities. Taking place in CA. Signed on 2003-07-30. Completion date: 2003-08-31.
CHAMPION ELECTRICAL CONTRACTOR (485 EAST SOUTH STREET SUIT; small business) : $15,555 in 3 contractsfrom 2000 to 2003
$8,527 with Navy for Maintenance, Repair or Alteration of Real Property -- Family Housing Facilities. Signed on 2003-09-10. Completion date: 2003-10-24.
$4,268 with Navy for Maintenance, Repair or Alteration of Real Property -- Other Administrative Facilities and Service Buildings. Signed on 2000-09-11. Completion date: 2000-12-11.
$2,760, same as above.Signed on 2000-09-26. Completion date: 2000-12-11.
FORENSIC TESTING INC (1100 RAVENNA COVE; small business)
$6,935 with Army for Laboratory Equipment and Supplies. Signed on 2005-04-06. Completion date: 2005-05-06.
Top industries in this zip code by the number of employees in 2005:
2002 - 2018 National Fire Incident Reporting System (NFIRS) incidents
According to the data from the years 2002 - 2018 the average number of fires per year is 155. The highest number of fire incidents - 222 took place in 2006, and the least - 112 in 2017. The data has a declining trend.
When looking into fire subcategories, the most incidents belonged to: Outside Fires (44.8%), and Structure Fires (37.5%).
Fire incident types reported to NFIRS in Zip Code 38017


 Nearest zip codes: 38139, 38028, 38018, 38066, 38125, 38138.


 According to the data from the years 2002 - 2018 the average number of fires per year is 155. The highest number of fire incidents - 222 took place in 2006, and the least - 112 in 2017. The data has a declining trend.
 When looking into fire subcategories, the most incidents belonged to: Outside Fires (44.8%), and Structure Fires (37.5%).