Estimated zip code population in 2022: 3,908 Zip code population in 2010: 3,907 Zip code population in 2000: 3,628
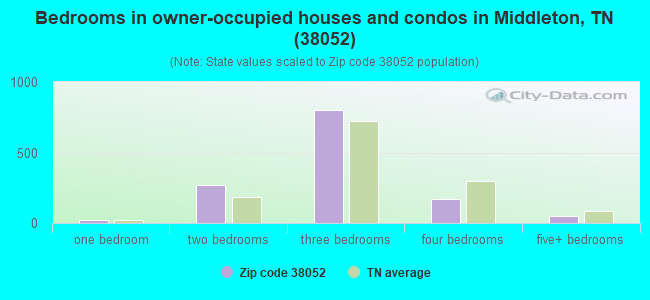
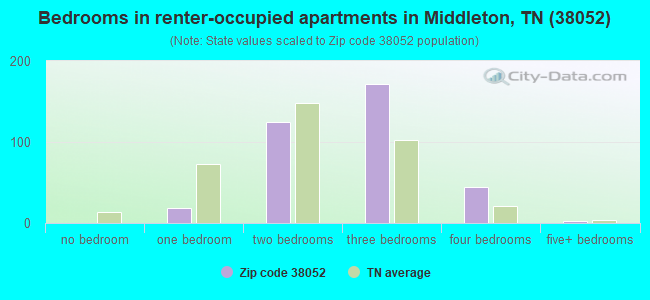
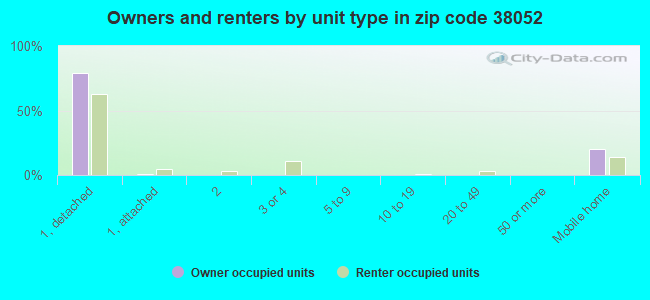
Houses and condos: 1,915 Renter-occupied apartments: 365
% of renters here:
22%
State:
33%
March 2022 cost of living index in zip code 38052: 78.5 (low, U.S. average is 100)
Land area: 125.6 sq. mi. Water area: 1.0 sq. mi.
Population density: 31 people per square mile
(very low).
OSM Map
General Map
Google Map
MSN Map
OSM Map
General Map
Google Map
MSN Map
OSM Map
General Map
Google Map
MSN Map
OSM Map
General Map
Google Map
MSN Map
Please wait while loading the map...
Real estate property taxes paid for housing units in 2022:
This zip code:
0.5% ($781)
Tennessee:
0.5% ($1,376)
Median real estate property taxes paid for housing units with mortgages in 2022: $954 (0.6%) Median real estate property taxes paid for housing units with no mortgage in 2022: $620 (0.4%)
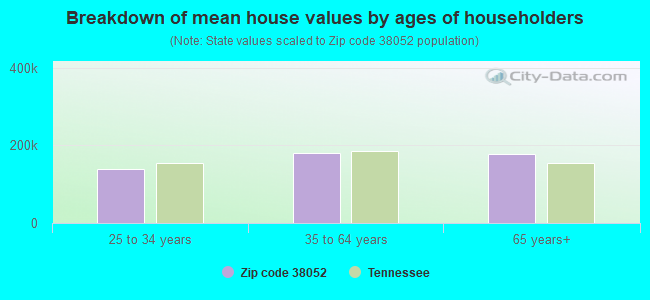
Estimated median house/condo value in 2022: $147,124
38052:
$147,124
Tennessee:
$284,800
According to our research of Tennessee and other state lists, there were 13 registered sex offenders living in 38052 zip code as of April 27, 2024. The ratio of all residents to sex offenders in zip code 38052 is 302 to 1. The ratio of registered sex offenders to all residents in this zip code is near the state average.
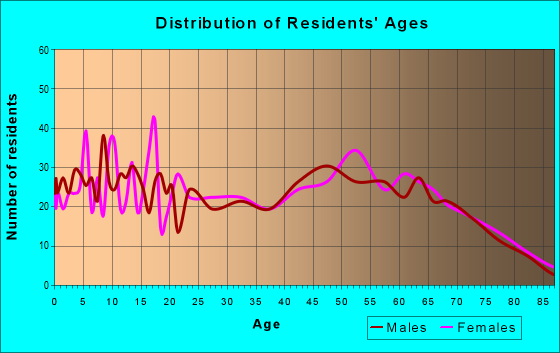
Median resident age:
This zip code:
40.8 years
Tennessee median age:
39.2 years
Average household size:
This zip code:
2.3 people
Tennessee:
2.4 people
Averages for the 2020 tax year for zip code 38052, filed in 2021:
Average Adjusted Gross Income (AGI) in 2020: $46,985 (Individual Income Tax Returns)
Here:
$46,985
State:
$69,014
Salary/wage: $43,964 (reported on 79.1% of returns)
Here:
$43,964
State:
$55,872
(% of AGI for various income ranges: 1073.8% for AGIs below $25k, 3494.9% for AGIs $25k-50k, 6221.5% for AGIs $50k-75k, 8922.7% for AGIs $75k-100k, 16477.0% for AGIs $100k-200k)
Taxable interest for individuals: $946 (reported on 25.2% of returns)
This zip code:
$946
Tennessee:
$1,945
(% of AGI for various income ranges: 17.0% for AGIs below $25k, 18.9% for AGIs $25k-50k, 60.5% for AGIs $50k-75k, 33.6% for AGIs $75k-100k, 80.0% for AGIs $100k-200k)
Ordinary dividends: $2,246 (reported on 8.0% of returns)
Here:
$2,246
State:
$8,105
(% of AGI for various income ranges: 7.4% for AGIs below $25k, 13.2% for AGIs $25k-50k, 59.5% for AGIs $50k-75k, 89.0% for AGIs $100k-200k)
Net capital gain/loss in AGI: +$5,067 (reported on 7.4% of returns)
Here:
+$5,067
State:
+$33,664
(% of AGI for various income ranges: 15.9% for AGIs $25k-50k, 15.0% for AGIs $50k-75k, 526.0% for AGIs $100k-200k)
Profit/loss from business: +$13,461 (reported on 19.0% of returns)
Here:
+$13,461
State:
+$18,991
(% of AGI for various income ranges: 143.2% for AGIs below $25k, 231.9% for AGIs $25k-50k, 170.0% for AGIs $50k-75k, 273.6% for AGIs $75k-100k, 2001.0% for AGIs $100k-200k)
Taxable individual retirement arrangement distribution: $12,829 (reported on 8.6% of returns)
38052:
$12,829
Tennessee:
$20,036
(% of AGI for various income ranges: 68.7% for AGIs below $25k, 128.1% for AGIs $25k-50k, 252.0% for AGIs $50k-75k, 495.0% for AGIs $100k-200k)
Earned income credit: $2,508 (reported on 23.9% of returns)
Here:
$2,508
State:
$2,391
(% of AGI for various income ranges: 135.1% for AGIs below $25k, 92.7% for AGIs $25k-50k)
Percentage of individuals using paid preparers for their 2020 taxes: 93.3%
Here:
93%
State:
93%
(% for various income ranges: 93.5% for AGIs below $25k, 93.3% for AGIs $25k-50k, 92.3% for AGIs $50k-75k, 92.9% for AGIs $75k-100k, 92.9% for AGIs $100k-200k, 100.0% for AGIs over 200k)
Averages for the 2012 tax year for zip code 38052, filed in 2013:
Average Adjusted Gross Income (AGI) in 2012: $37,973 (Individual Income Tax Returns)
Here:
$37,973
State:
$53,767
Salary/wage: $34,842 (reported on 82.2% of returns)
Here:
$34,842
State:
$45,421
(% of AGI for various income ranges: 70.5% for AGIs below $25k, 81.0% for AGIs $25k-50k, 81.2% for AGIs $50k-75k, 81.4% for AGIs $75k-100k, 56.5% for AGIs $100k-200k)
Taxable interest for individuals: $955 (reported on 26.3% of returns)
This zip code:
$955
Tennessee:
$1,732
(% of AGI for various income ranges: 0.8% for AGIs below $25k, 0.3% for AGIs $25k-50k, 0.5% for AGIs $50k-75k, 0.4% for AGIs $75k-100k, 1.5% for AGIs $100k-200k)
Ordinary dividends: $1,517 (reported on 7.9% of returns)
Here:
$1,517
State:
$6,739
(% of AGI for various income ranges: 0.4% for AGIs below $25k, 0.2% for AGIs $25k-50k, 0.1% for AGIs $50k-75k, 0.4% for AGIs $75k-100k, 0.7% for AGIs $100k-200k)
Net capital gain/loss in AGI: +$1,727 (reported on 7.2% of returns)
Here:
+$1,727
State:
+$19,082
(% of AGI for various income ranges: 2.3% for AGIs $100k-200k)
Profit/loss from business: +$10,686 (reported on 18.4% of returns)
Here:
+$10,686
State:
+$15,240
(% of AGI for various income ranges: 14.3% for AGIs below $25k, 2.8% for AGIs $25k-50k, 3.6% for AGIs $50k-75k, 8.5% for AGIs $100k-200k)
Taxable individual retirement arrangement distribution: $13,950 (reported on 9.2% of returns)
38052:
$13,950
Tennessee:
$15,505
(% of AGI for various income ranges: 3.1% for AGIs below $25k, 3.7% for AGIs $25k-50k, 2.9% for AGIs $50k-75k, 7.5% for AGIs $75k-100k)
Total itemized deductions: $17,165 (27% of AGI, reported on 13.2% of returns)
Here:
$17,165
State:
$21,976
Here:
26.6% of AGI
State:
17.8% of AGI
(% of AGI for various income ranges: 4.3% for AGIs below $25k, 5.3% for AGIs $25k-50k, 4.8% for AGIs $50k-75k, 8.2% for AGIs $75k-100k, 8.1% for AGIs $100k-200k)
Charity contributions: $5,638 (reported on 10.5% of returns)
Here:
$5,638
State:
$6,709
(% of AGI for various income ranges: 0.4% for AGIs below $25k, 0.8% for AGIs $25k-50k, 1.2% for AGIs $50k-75k, 2.9% for AGIs $75k-100k, 3.1% for AGIs $100k-200k)
Taxes paid: $2,585 (reported on 13.2% of returns)
38052:
$2,585
State:
$4,829
(% of AGI for various income ranges: 0.5% for AGIs below $25k, 0.7% for AGIs $25k-50k, 0.6% for AGIs $50k-75k, 1.4% for AGIs $75k-100k, 1.5% for AGIs $100k-200k)
Earned income credit: $2,540 (reported on 27.6% of returns)
Here:
$2,540
State:
$2,404
(% of AGI for various income ranges: 8.9% for AGIs below $25k, 2.0% for AGIs $25k-50k)
Percentage of individuals using paid preparers for their 2012 taxes: 56.6%
Here:
57%
State:
52%
(% for various income ranges: 55.4% for AGIs below $25k, 55.3% for AGIs $25k-50k, 60.9% for AGIs $50k-75k, 50.0% for AGIs $75k-100k, 71.4% for AGIs $100k-200k)
Averages for the 2004 tax year for zip code 38052, filed in 2005:
Average Adjusted Gross Income (AGI) in 2004: $32,083 (Individual Income Tax Returns)
Here:
$32,083
State:
$44,088
Salary/wage: $30,253 (reported on 83.0% of returns)
Here:
$30,253
State:
$38,825
(% of AGI for various income ranges: 100.2% for AGIs below $10k, 73.2% for AGIs $10k-25k, 85.4% for AGIs $25k-50k, 83.5% for AGIs $50k-75k, 73.2% for AGIs $75k-100k, 54.1% for AGIs over 100k)
Taxable interest for individuals: $1,639 (reported on 30.8% of returns)
This zip code:
$1,639
Tennessee:
$1,802
(% of AGI for various income ranges: 6.6% for AGIs below $10k, 1.4% for AGIs $10k-25k, 0.8% for AGIs $25k-50k, 0.9% for AGIs $50k-75k, 0.8% for AGIs $75k-100k, 4.9% for AGIs over 100k)
Taxable dividends: $1,280 (reported on 10.5% of returns)
Here:
$1,280
State:
$3,727
(% of AGI for various income ranges: 1.0% for AGIs below $10k, 0.6% for AGIs $10k-25k, 0.3% for AGIs $25k-50k, 0.4% for AGIs $50k-75k, 0.3% for AGIs $75k-100k, 0.6% for AGIs over 100k)
Net capital gain/loss: +$4,481 (reported on 8.4% of returns)
Here:
+$4,481
State:
+$15,776
(% of AGI for various income ranges: 0.3% for AGIs $10k-25k, 0.4% for AGIs $25k-50k, 0.5% for AGIs $50k-75k, 5.0% for AGIs $75k-100k, 2.8% for AGIs over 100k)
Profit/loss from business: +$8,409 (reported on 18.1% of returns)
Here:
+$8,409
State:
+$12,882
(% of AGI for various income ranges: 9.2% for AGIs below $10k, 9.4% for AGIs $10k-25k, 2.6% for AGIs $25k-50k, 3.4% for AGIs $50k-75k, 10.9% for AGIs over 100k)
IRA payment deduction: $2,345 (reported on 1.9% of returns)
38052:
$2,345
Tennessee:
$2,934
Total itemized deductions: $15,116 (26% of AGI, reported on 14.1% of returns)
Here:
$15,116
State:
$18,035
Here:
25.5% of AGI
State:
19.9% of AGI
(% of AGI for various income ranges: 4.7% for AGIs $10k-25k, 6.4% for AGIs $25k-50k, 6.2% for AGIs $50k-75k, 8.1% for AGIs $75k-100k, 10.8% for AGIs over 100k)
Charity contributions deductions: $4,484 (7% of AGI, reported on 11.9% of returns)
Here:
$4,484
State:
$5,167
Here:
7.2% of AGI
State:
5.3% of AGI
(% of AGI for various income ranges: 0.8% for AGIs $10k-25k, 1.2% for AGIs $25k-50k, 1.7% for AGIs $50k-75k, 2.5% for AGIs $75k-100k, 3.5% for AGIs over 100k)
Total tax: $3,664 (reported on 69.6% of returns)
38052:
$3,664
State:
$7,482
(% of AGI for various income ranges: 3.2% for AGIs below $10k, 3.7% for AGIs $10k-25k, 5.8% for AGIs $25k-50k, 8.6% for AGIs $50k-75k, 11.3% for AGIs $75k-100k, 16.4% for AGIs over 100k)
Earned income credit: $1,842 (reported on 25.2% of returns)
Here:
$1,842
State:
$1,826
Percentage of individuals using paid preparers for their 2004 taxes: 61.3%
Here:
61%
State:
60%
(% for various income ranges: 56.9% for AGIs below $10k, 66.1% for AGIs $10k-25k, 58.3% for AGIs $25k-50k, 61.6% for AGIs $50k-75k, 64.5% for AGIs $75k-100k, 72.1% for AGIs over 100k)
Household received Food Stamps/SNAP in the past 12 months: 249 Household did not receive Food Stamps/SNAP in the past 12 months: 1,429
Women who had a birth in the past 12 months: 111 (113 now married, 0 unmarried) Women who did not have a birth in the past 12 months: 825 (338 now married, 487 unmarried)
Housing units in zip code 38052 with a mortgage: 601 (25 second mortgage, 6 both second mortgage and home equity loan) Houses without a mortgage: 30
Median monthly owner costs for units with a mortgage: $991 Median monthly owner costs for units without a mortgage: $369
Residents with income below the poverty level in 2022:
This zip code:
15.7%
Whole state:
13.3%
Residents with income below 50% of the poverty level in 2022:
This zip code:
5.4%
Whole state:
7.1%
Median number of rooms in houses and condos:
Here:
6.6
State:
6.5
Median number of rooms in apartments:
Here:
5.6
State:
4.4
Notable locations in this zip code not listed on our city pages
Churches in zip code 38052 include: Porters Creek Church (A), Ramah Church (B), Gentrys Chapel (C), Reeves Church (D), Hebron Baptist Church (E), Liberty Baptist Church (F), Bowder Hill Church (G), Old Aenon Church (H), New Hope Church (I). Display/hide their locations on the map
Cemeteries: Sandy Springs Cemetery (1), Sasser Cemetery (2), Bailey Cemetery (3), Bass Cemetery (4), Grantham Cemetery (5), Ramah Cemetery (6), Harris Cemetery (7). Display/hide their locations on the map
Reservoirs: Lake Vonda (A), Cub Creek Lake Number One (B), Lake Hardeman (C), Cub Creek Lake Number Two A (D), Porters Creek Lake Number Seventeen (E), Cub Creek Tree Farm Lake (F), Porters Creek Lake Number Three (G), Porters Creek Lake Number Four (H). Display/hide their locations on the map
Streams, rivers, and creeks: Magbee Branch (A), Hudson Branch (B), Fortune Branch (C), Dry Branch (D), Cypress Creek (E), Crystal Spring Branch (F), Colonel Fork (G), Muddy Creek (H), Porters Creek (I). Display/hide their locations on the map
Size of family households: 547 2-persons, 236 3-persons, 159 4-persons, 84 5-persons, 4 6-persons, 15 7-or-more-persons
Size of nonfamily households: 566 1-person, 51 2-persons, 11 3-persons
514 married couples with children.
193 single-parent households (92 men, 101 women).
97.4% of residents of 38052 zip code speak English at home.
0.1% of residents speak Spanish at home (100% very well).
0.7% of residents speak other Indo-European language at home (100% very well).
1.8% of residents speak Asian or Pacific Island language at home (100% very well).
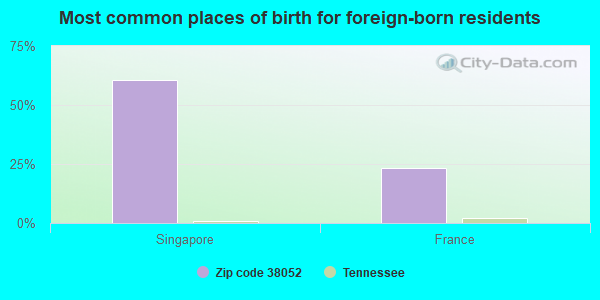
Foreign born population: 85 (2.2%) (98.8% of them are naturalized citizens)
This zip code:
2.2%
Whole state:
5.6%
60%Singapore
23%France
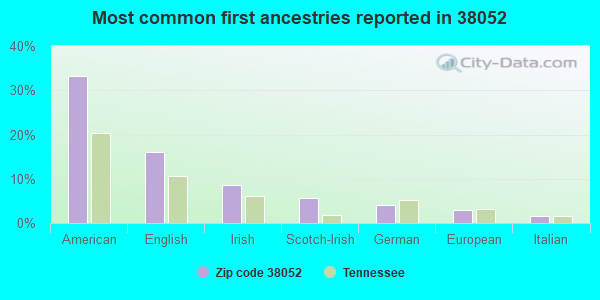
33%American
16%English
9%Irish
6%Scotch-Irish
4%German
3%European
2%Italian
Year of entry for the foreign-born population
762010 or later
22000 to 2009
201990 to 1999
0Before 1990
Facilities with environmental interests located in this zip code:
DOVER ELEVATOR SYSTEMS (100 DOVER STREET in MIDDLETON, TN)
AIR MAJOR (AIRS/AFS) CRITERIA AND HAZARDOUS AIR POLLUTANT INVENTORY (Inventory of air pollution sources) AIR MAJOR ("Best Available" air pollution technologies tracking) HAZARDOUS WASTE BIENNIAL REPORTER (Resource Conservation and Recovery Act (tracking hazardous waste)) Large Quantity Generators, more that 1000 kg of hazardous waste/month (Resource Conservation and Recovery Act (tracking hazardous waste)) - notification TRI REPORTER (Tracking of toxic chemicals releasing facilities) Business SIC classification: ELEVATORS AND MOVING STAIRWAYS Business NAICS classification: ELEVATOR AND MOVING STAIRWAY MANUFACTURING.; ELEVATOR AND MOVING STAIRWAY MANUFACTURING. Organizations: THYSSEN ELEVATOR SYS INC (CONTACT/OPERATOR)
Alternative names: DOVER CORP, THYSSEN DOVER ELEVATOR SYS., THYSSEN ELEVATOR, THYSSENKRUPP ELEVATOR MANUFACTURING
Housing units lacking complete plumbing facilities: 3.1% Housing units lacking complete kitchen facilities: 7.0%
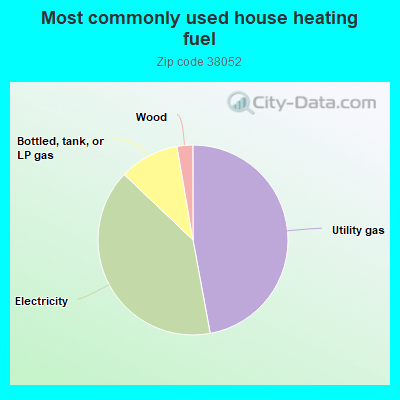
47.1%Utility gas
40.0%Electricity
10.2%Bottled, tank, or LP gas
2.7%Wood
Population in 1990: 3,147. Population change in the 1990s: +481 (+15.3%).
Place of birth for U.S.-born residents:
This state: 2,772
Northeast: 49
Midwest: 146
South: 767
West: 50
64% of the 38052 zip code residents lived in the same house 5 years ago. Out of people who lived in different houses, 60% lived in this county. Out of people who lived in different counties, 50% lived in Tennessee.
99% of the 38052 zip code residents lived in the same house 1 year ago. Out of people who lived in different houses, 66% moved from this county. Out of people who lived in different houses, 21% moved from different county within same state. Out of people who lived in different houses, 72% moved from different state.
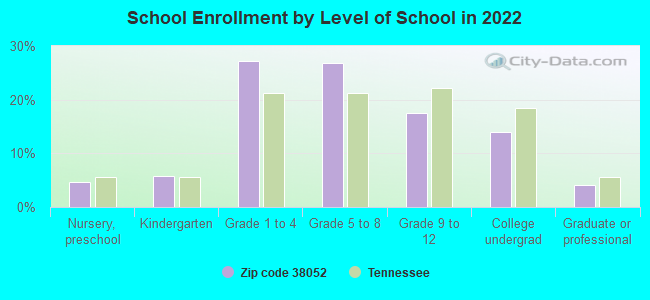
Private vs. public school enrollment:
Students in private schools in grades 1 to 8 (elementary and middle school): 101
Here:
20.7%
Tennessee:
15.0%
Students in private schools in grades 9 to 12 (high school): 16
Here:
10.5%
Tennessee:
16.2%
Students in private undergraduate colleges: 32
Here:
25.4%
Tennessee:
23.5%
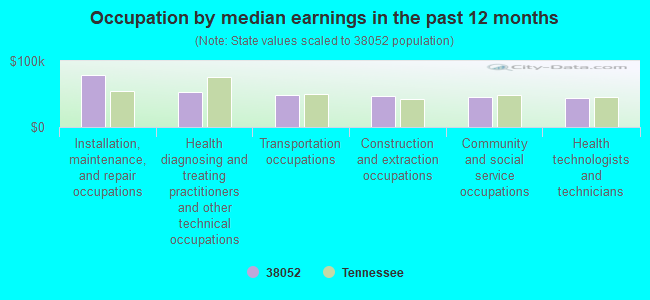
Occupation by median earnings in the past 12 months ($)
78,213Installation, maintenance, and repair occupations
52,983Health diagnosing and treating practitioners and other technical occupations
48,991Transportation occupations
47,153Construction and extraction occupations
46,135Community and social service occupations
44,595Health technologists and technicians
Top industries in this zip code by the number of employees in 2005:
Other Services (except Public Administration): Religious Organizations (5-9 employees: 1 establishment, 1-4 employees: 4 establishments)
People in group quarters in 2000:
15 people in other noninstitutional group quarters
Fatal accident statistics in 2012:
Fatal accident count: 2
Vehicles involved in fatal accidents: 2
Fatal accidents caused by drunken drivers: 0
Fatalities: 2
Persons involved in fatal accidents: 2
Pedestrians involved in fatal accidents: 0
Fatal accident statistics in 2011:
Fatal accident count: 1
Vehicles involved in fatal accidents: 1
Fatal accidents caused by drunken drivers: 0
Fatalities: 1
Persons involved in fatal accidents: 4
Pedestrians involved in fatal accidents: 0
2002 - 2018 National Fire Incident Reporting System (NFIRS) incidents
According to the data from the years 2002 - 2018 the average number of fire incidents per year is 27. The highest number of reported fires - 42 took place in 2006, and the least - 5 in 2011. The data has a declining trend.
When looking into fire subcategories, the most incidents belonged to: Outside Fires (53.6%), and Structure Fires (20.0%).
Fire incident types reported to NFIRS in Zip Code 38052


 Nearest zip codes: 38067, 38061, 38044, 38683, 38008, 38674.


 According to the data from the years 2002 - 2018 the average number of fire incidents per year is 27. The highest number of reported fires - 42 took place in 2006, and the least - 5 in 2011. The data has a declining trend.
 When looking into fire subcategories, the most incidents belonged to: Outside Fires (53.6%), and Structure Fires (20.0%).