Estimated zip code population in 2022: 24,701 Zip code population in 2010: 22,569 Zip code population in 2000: 16,064
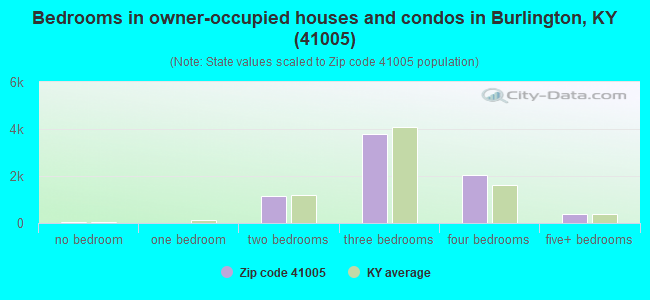
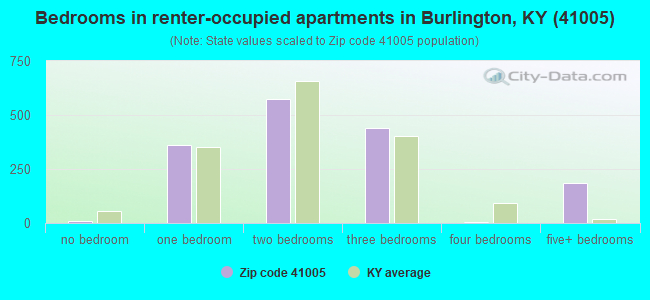
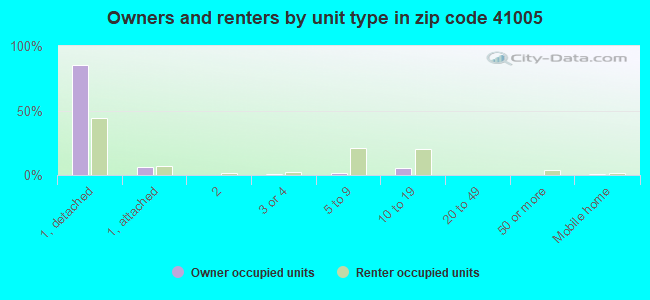
Houses and condos: 9,313 Renter-occupied apartments: 1,592
% of renters here:
18%
State:
31%
March 2022 cost of living index in zip code 41005: 88.4 (less than average, U.S. average is 100)
Land area: 58.4 sq. mi. Water area: 3.0 sq. mi.
Population density: 423 people per square mile
(low).
OSM Map
General Map
Google Map
MSN Map
OSM Map
General Map
Google Map
MSN Map
OSM Map
General Map
Google Map
MSN Map
OSM Map
General Map
Google Map
MSN Map
Please wait while loading the map...
Real estate property taxes paid for housing units in 2022:
This zip code:
0.8% ($1,963)
Kentucky:
0.7% ($1,456)
Median real estate property taxes paid for housing units with mortgages in 2022: $1,962 (0.8%) Median real estate property taxes paid for housing units with no mortgage in 2022: $1,901 (0.7%)
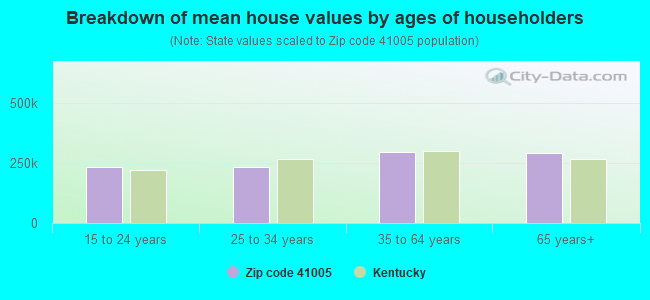
Estimated median house/condo value in 2022: $255,301
41005:
$255,301
Kentucky:
$196,300
According to our research of Kentucky and other state lists, there were 33 registered sex offenders living in 41005 zip code as of April 27, 2024. The ratio of all residents to sex offenders in zip code 41005 is 711 to 1. The ratio of registered sex offenders to all residents in this zip code is lower than the state average.
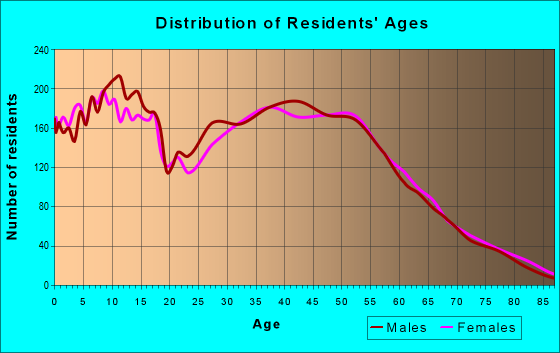
Median resident age:
This zip code:
37.9 years
Kentucky median age:
39.4 years
Average household size:
This zip code:
2.7 people
Kentucky:
2.4 people
Averages for the 2020 tax year for zip code 41005, filed in 2021:
Average Adjusted Gross Income (AGI) in 2020: $66,105 (Individual Income Tax Returns)
Here:
$66,105
State:
$61,342
Salary/wage: $57,899 (reported on 87.2% of returns)
Here:
$57,899
State:
$50,827
(% of AGI for various income ranges: 1135.4% for AGIs below $25k, 3630.4% for AGIs $25k-50k, 6302.9% for AGIs $50k-75k, 9405.2% for AGIs $75k-100k, 17460.0% for AGIs $100k-200k, 57896.9% for AGIs over 200k)
Taxable interest for individuals: $946 (reported on 23.8% of returns)
This zip code:
$946
Kentucky:
$1,441
(% of AGI for various income ranges: 10.1% for AGIs below $25k, 13.8% for AGIs $25k-50k, 23.0% for AGIs $50k-75k, 39.0% for AGIs $75k-100k, 52.3% for AGIs $100k-200k, 536.2% for AGIs over 200k)
Ordinary dividends: $3,538 (reported on 16.8% of returns)
Here:
$3,538
State:
$7,388
(% of AGI for various income ranges: 13.9% for AGIs below $25k, 32.1% for AGIs $25k-50k, 34.7% for AGIs $50k-75k, 85.8% for AGIs $75k-100k, 179.5% for AGIs $100k-200k, 1745.4% for AGIs over 200k)
Net capital gain/loss in AGI: +$12,563 (reported on 13.5% of returns)
Here:
+$12,563
State:
+$19,475
(% of AGI for various income ranges: 6.8% for AGIs below $25k, 18.0% for AGIs $25k-50k, 57.2% for AGIs $50k-75k, 99.0% for AGIs $75k-100k, 356.7% for AGIs $100k-200k, 10167.7% for AGIs over 200k)
Profit/loss from business: +$12,834 (reported on 12.0% of returns)
Here:
+$12,834
State:
+$11,386
(% of AGI for various income ranges: 85.4% for AGIs below $25k, 105.1% for AGIs $25k-50k, 130.7% for AGIs $50k-75k, 232.5% for AGIs $75k-100k, 392.0% for AGIs $100k-200k, 3413.8% for AGIs over 200k)
Taxable individual retirement arrangement distribution: $17,787 (reported on 9.1% of returns)
41005:
$17,787
Kentucky:
$18,941
(% of AGI for various income ranges: 61.2% for AGIs below $25k, 107.1% for AGIs $25k-50k, 183.4% for AGIs $50k-75k, 250.5% for AGIs $75k-100k, 559.5% for AGIs $100k-200k, 2120.8% for AGIs over 200k)
Self-employed (Keogh) retirement plans: $14,750 (reported on 0.2% of returns)
41005:
$14,750
Kentucky:
$23,933
(% of AGI for various income ranges: 28.9% for AGIs $75k-100k)
Total itemized deductions: $29,047 (reported on 6.3% of returns)
Here:
$29,047
State:
$32,473
(% of AGI for various income ranges: 15.8% for AGIs below $25k, 63.4% for AGIs $25k-50k, 187.4% for AGIs $50k-75k, 337.6% for AGIs $75k-100k, 543.9% for AGIs $100k-200k, 5061.5% for AGIs over 200k)
Charity contributions: $11,291 (reported on 4.8% of returns)
Here:
$11,291
State:
$13,472
(% of AGI for various income ranges: 12.7% for AGIs $25k-50k, 27.2% for AGIs $50k-75k, 70.4% for AGIs $75k-100k, 156.9% for AGIs $100k-200k, 2365.4% for AGIs over 200k)
Taxes paid: $7,713 (reported on 6.3% of returns)
41005:
$7,713
State:
$7,830
(% of AGI for various income ranges: 2.8% for AGIs below $25k, 13.9% for AGIs $25k-50k, 57.4% for AGIs $50k-75k, 101.7% for AGIs $75k-100k, 179.0% for AGIs $100k-200k, 893.1% for AGIs over 200k)
Earned income credit: $2,125 (reported on 11.9% of returns)
Here:
$2,125
State:
$2,336
(% of AGI for various income ranges: 66.8% for AGIs below $25k, 56.8% for AGIs $25k-50k, 1.6% for AGIs $50k-75k)
Percentage of individuals using paid preparers for their 2020 taxes: 94.0%
Here:
94%
State:
94%
(% for various income ranges: 92.9% for AGIs below $25k, 94.0% for AGIs $25k-50k, 94.7% for AGIs $50k-75k, 95.7% for AGIs $75k-100k, 94.4% for AGIs $100k-200k, 91.7% for AGIs over 200k)
Averages for the 2012 tax year for zip code 41005, filed in 2013:
Average Adjusted Gross Income (AGI) in 2012: $56,663 (Individual Income Tax Returns)
Here:
$56,663
State:
$50,814
Salary/wage: $50,780 (reported on 90.2% of returns)
Here:
$50,780
State:
$42,723
(% of AGI for various income ranges: 81.7% for AGIs below $25k, 84.0% for AGIs $25k-50k, 80.5% for AGIs $50k-75k, 83.5% for AGIs $75k-100k, 85.4% for AGIs $100k-200k, 56.4% for AGIs over 200k)
Taxable interest for individuals: $758 (reported on 28.3% of returns)
This zip code:
$758
Kentucky:
$1,381
(% of AGI for various income ranges: 0.7% for AGIs below $25k, 0.4% for AGIs $25k-50k, 0.3% for AGIs $50k-75k, 0.4% for AGIs $75k-100k, 0.3% for AGIs $100k-200k, 0.6% for AGIs over 200k)
Ordinary dividends: $2,714 (reported on 18.5% of returns)
Here:
$2,714
State:
$6,239
(% of AGI for various income ranges: 0.8% for AGIs below $25k, 0.6% for AGIs $25k-50k, 0.7% for AGIs $50k-75k, 0.5% for AGIs $75k-100k, 0.7% for AGIs $100k-200k, 2.9% for AGIs over 200k)
Net capital gain/loss in AGI: +$4,807 (reported on 12.7% of returns)
Here:
+$4,807
State:
+$11,336
(% of AGI for various income ranges: 0.2% for AGIs $25k-50k, 0.1% for AGIs $50k-75k, 0.5% for AGIs $75k-100k, 1.0% for AGIs $100k-200k, 6.5% for AGIs over 200k)
Profit/loss from business: +$8,385 (reported on 11.4% of returns)
Here:
+$8,385
State:
+$10,862
(% of AGI for various income ranges: 4.4% for AGIs below $25k, 1.9% for AGIs $25k-50k, 1.5% for AGIs $50k-75k, 1.2% for AGIs $75k-100k, 1.2% for AGIs $100k-200k, 2.3% for AGIs over 200k)
Taxable individual retirement arrangement distribution: $14,756 (reported on 9.1% of returns)
41005:
$14,756
Kentucky:
$14,296
(% of AGI for various income ranges: 2.7% for AGIs below $25k, 2.3% for AGIs $25k-50k, 2.9% for AGIs $50k-75k, 2.1% for AGIs $75k-100k, 2.1% for AGIs $100k-200k, 2.7% for AGIs over 200k)
Self-employment retirement plans: $14,167 (reported on 0.3% of returns)
41005:
$14,167
Kentucky:
$20,768
Total itemized deductions: $18,866 (20% of AGI, reported on 41.4% of returns)
Here:
$18,866
State:
$21,160
Here:
20.3% of AGI
State:
20.0% of AGI
(% of AGI for various income ranges: 8.0% for AGIs below $25k, 10.4% for AGIs $25k-50k, 14.3% for AGIs $50k-75k, 15.4% for AGIs $75k-100k, 16.0% for AGIs $100k-200k, 11.6% for AGIs over 200k)
Charity contributions: $2,884 (reported on 32.8% of returns)
Here:
$2,884
State:
$4,303
(% of AGI for various income ranges: 0.7% for AGIs below $25k, 1.0% for AGIs $25k-50k, 1.4% for AGIs $50k-75k, 1.7% for AGIs $75k-100k, 2.0% for AGIs $100k-200k, 2.6% for AGIs over 200k)
Taxes paid: $7,731 (reported on 41.4% of returns)
41005:
$7,731
State:
$8,496
(% of AGI for various income ranges: 1.3% for AGIs below $25k, 3.3% for AGIs $25k-50k, 5.0% for AGIs $50k-75k, 6.3% for AGIs $75k-100k, 7.5% for AGIs $100k-200k, 6.1% for AGIs over 200k)
Earned income credit: $2,157 (reported on 13.9% of returns)
Here:
$2,157
State:
$2,273
(% of AGI for various income ranges: 5.5% for AGIs below $25k, 1.0% for AGIs $25k-50k)
Percentage of individuals using paid preparers for their 2012 taxes: 45.3%
Here:
45%
State:
60%
(% for various income ranges: 40.5% for AGIs below $25k, 44.0% for AGIs $25k-50k, 48.8% for AGIs $50k-75k, 48.1% for AGIs $75k-100k, 50.0% for AGIs $100k-200k, 64.7% for AGIs over 200k)
Averages for the 2004 tax year for zip code 41005, filed in 2005:
Average Adjusted Gross Income (AGI) in 2004: $49,474 (Individual Income Tax Returns)
Here:
$49,474
State:
$41,540
Salary/wage: $45,627 (reported on 92.1% of returns)
Here:
$45,627
State:
$36,432
(% of AGI for various income ranges: 114.9% for AGIs below $10k, 83.1% for AGIs $10k-25k, 86.6% for AGIs $25k-50k, 87.2% for AGIs $50k-75k, 89.2% for AGIs $75k-100k, 77.7% for AGIs over 100k)
Taxable interest for individuals: $795 (reported on 41.8% of returns)
This zip code:
$795
Kentucky:
$1,571
(% of AGI for various income ranges: 2.8% for AGIs below $10k, 1.6% for AGIs $10k-25k, 0.9% for AGIs $25k-50k, 0.5% for AGIs $50k-75k, 0.4% for AGIs $75k-100k, 0.5% for AGIs over 100k)
Taxable dividends: $1,425 (reported on 22.1% of returns)
Here:
$1,425
State:
$3,453
(% of AGI for various income ranges: 1.6% for AGIs below $10k, 0.8% for AGIs $10k-25k, 0.4% for AGIs $25k-50k, 0.5% for AGIs $50k-75k, 0.6% for AGIs $75k-100k, 0.9% for AGIs over 100k)
Net capital gain/loss: +$4,173 (reported on 16.1% of returns)
Here:
+$4,173
State:
+$9,663
(% of AGI for various income ranges: -0.4% for AGIs below $10k, 0.6% for AGIs $10k-25k, 0.3% for AGIs $25k-50k, 0.5% for AGIs $50k-75k, 0.4% for AGIs $75k-100k, 3.8% for AGIs over 100k)
Profit/loss from business: +$7,899 (reported on 12.4% of returns)
Here:
+$7,899
State:
+$9,233
(% of AGI for various income ranges: 0.5% for AGIs below $10k, 4.5% for AGIs $10k-25k, 2.3% for AGIs $25k-50k, 1.4% for AGIs $50k-75k, 0.8% for AGIs $75k-100k, 2.7% for AGIs over 100k)
IRA payment deduction: $2,839 (reported on 1.9% of returns)
41005:
$2,839
Kentucky:
$2,955
(% of AGI for various income ranges: 0.1% for AGIs $10k-25k, 0.2% for AGIs $25k-50k, 0.1% for AGIs $50k-75k, 0.1% for AGIs $75k-100k, 0.0% for AGIs over 100k)
Self-employed pension: $10,514 (reported on 0.4% of returns)
Here:
$10,514
Kentucky:
$14,996
Total itemized deductions: $17,056 (22% of AGI, reported on 47.9% of returns)
Here:
$17,056
State:
$17,474
Here:
22.3% of AGI
State:
21.0% of AGI
(% of AGI for various income ranges: 8.4% for AGIs below $10k, 8.1% for AGIs $10k-25k, 14.4% for AGIs $25k-50k, 18.5% for AGIs $50k-75k, 19.0% for AGIs $75k-100k, 16.6% for AGIs over 100k)
Charity contributions deductions: $2,354 (3% of AGI, reported on 41.4% of returns)
Here:
$2,354
State:
$3,494
Here:
3.0% of AGI
State:
4.0% of AGI
(% of AGI for various income ranges: 0.9% for AGIs below $10k, 1.0% for AGIs $10k-25k, 1.4% for AGIs $25k-50k, 1.8% for AGIs $50k-75k, 2.3% for AGIs $75k-100k, 2.5% for AGIs over 100k)
Total tax: $5,982 (reported on 81.5% of returns)
41005:
$5,982
State:
$6,162
(% of AGI for various income ranges: 2.4% for AGIs below $10k, 4.6% for AGIs $10k-25k, 6.9% for AGIs $25k-50k, 8.0% for AGIs $50k-75k, 9.2% for AGIs $75k-100k, 15.4% for AGIs over 100k)
Earned income credit: $1,639 (reported on 9.9% of returns)
Here:
$1,639
State:
$1,723
Percentage of individuals using paid preparers for their 2004 taxes: 50.2%
Here:
50%
State:
66%
(% for various income ranges: 37.3% for AGIs below $10k, 50.7% for AGIs $10k-25k, 52.8% for AGIs $25k-50k, 52.2% for AGIs $50k-75k, 52.6% for AGIs $75k-100k, 56.8% for AGIs over 100k)
Likely homosexual households (counted as self-reported same-sex unmarried-partner households)
Lesbian couples: 0.0% of all households
Gay men: 0.1% of all households
Household received Food Stamps/SNAP in the past 12 months: 192 Household did not receive Food Stamps/SNAP in the past 12 months: 8,744
Women who had a birth in the past 12 months: 446 (270 now married, 176 unmarried) Women who did not have a birth in the past 12 months: 5,439 (2,393 now married, 3,044 unmarried)
Housing units in zip code 41005 with a mortgage: 5,525 (838 second mortgage, 11 home equity loan, 765 both second mortgage and home equity loan) Houses without a mortgage: 64
Median monthly owner costs for units with a mortgage: $1,486 Median monthly owner costs for units without a mortgage: $513
Residents with income below the poverty level in 2022:
This zip code:
5.9%
Whole state:
16.5%
Residents with income below 50% of the poverty level in 2022:
This zip code:
3.4%
Whole state:
9.0%
Median number of rooms in houses and condos:
Here:
6.6
State:
6.4
Median number of rooms in apartments:
Here:
4.7
State:
4.4
Notable locations in this zip code not listed on our city pages
Notable locations in zip code 41005: Camp Michael (A), Camp Ernst (B), Double Lick (C), Florence Crossroads (D), Meadowood Golf Course (E), Gateway Business Park (F), Commerce Park West (G), Boone County Fairgrounds (H), Boone County Water Rescue (I), Boone County Administration Building (J), Boone County Court House (K), Burlington Fire Protection District (L), Boone County Justice Center (M), Belleview - McVille Fire Protection District (N). Display/hide their locations on the map
Churches in zip code 41005 include: Waterloo Church (A), First Baptist Church (B), Burlington Church of Christ (C), Burlington Baptist Church (D), Bullittsville Christian Church (E), Beech Grove Church (F), East Bend Church (G). Display/hide their locations on the map
Cemeteries: Marshall Cemetery (1), Wilson Cemetery (2), Pope Cemetery (3), Old Burlington Cemetery (4), Chambers Cemetery (5), Pearson Cemetery (6), Acra Cemetery (7). Display/hide their locations on the map
Streams, rivers, and creeks: Allen Fork (A), Double Lick Creek (B), Brandywine Creek (C), Willoughby Creek (D), Middle Creek (E), DeHart Creek (F), Snyder Branch (G). Display/hide their locations on the map
3,425 married couples with children.
1,051 single-parent households (396 men, 655 women).
91.7% of residents of 41005 zip code speak English at home.
4.0% of residents speak Spanish at home (65% very well, 26% well, 4% not well, 6% not at all).
1.1% of residents speak other Indo-European language at home (69% very well, 31% well).
2.1% of residents speak Asian or Pacific Island language at home (89% very well, 11% not well).
0.8% of residents speak other language at home (46% very well, 36% well, 18% not well).
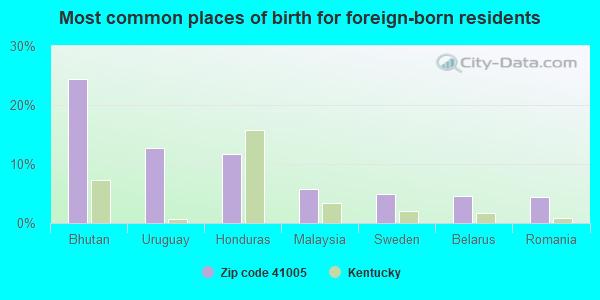
Foreign born population: 1,374 (5.6%) (39.7% of them are naturalized citizens)
This zip code:
5.6%
Whole state:
4.0%
24%Bhutan
13%Uruguay
12%Honduras
6%Malaysia
5%Sweden
5%Belarus
4%Romania
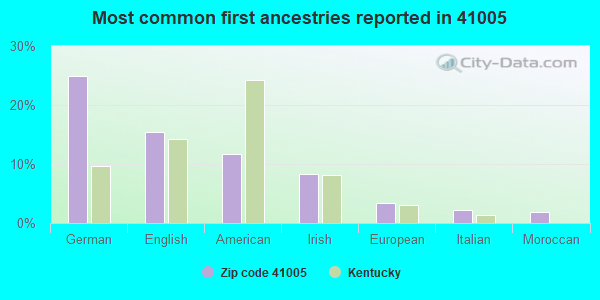
25%German
15%English
12%American
8%Irish
3%European
2%Italian
2%Moroccan
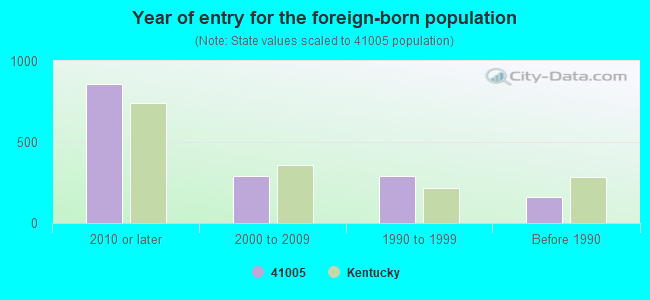
Year of entry for the foreign-born population
8612010 or later
2882000 to 2009
2921990 to 1999
160Before 1990
Major facilities with environmental interests located in this zip code:
BOONE READY MIX INC (1658 PRODUCTION DRIVE in BURLINGTON, KY)
CRITERIA AND HAZARDOUS AIR POLLUTANT INVENTORY (Inventory of air pollution sources) National Pollutant Discharge Elimination System NON-MAJOR (Tracking pollutant discharge elimination systems) - permit National Pollutant Discharge Elimination System NON-MAJOR (Tracking pollutant discharge elimination systems) - permit Business SIC classification: READY-MIXED CONCRETE
BURLINGTON ELEMENTARY SCHOOL (5946 ORIENT ST in BURLINGTON, KY)
(National Center for Education Statistics) - STATE ID-008035040 Organizations: BOONE COUNTY (SCHOOL DISTRICT)
MAPLEWOOD CHILDREN'S HOME ALTERNATIVE ( in BURLINGTON, KY)
(National Center for Education Statistics) - STATE ID-008035140 Organizations: BOONE COUNTY (SCHOOL DISTRICT)
MAPLEWOOD HOME ALTERNATIVE HIGH SCHOOL (3261 MAPLEWOOD DR in BURLINGTON, KY)
(National Center for Education Statistics) - STATE ID-008035150 Organizations: BOONE COUNTY (SCHOOL DISTRICT)
MID VALLEY PIPELINE (4910 LIMABURG in BURLINGTON, KY)
AIR MINOR (AIRS/AFS) (Resource Conservation and Recovery Act (tracking hazardous waste)) Business SIC classification: CRUDE PETROLEUM PIPELINES Organizations: MID VALLEY PIPELINE COMPANY (CONTACT/OWNER)
PEBBLE CREEK PHASE 5 - FALLS CREEK (RYLAND HOMES) (CAMP ERNEST ROAD in BURLINGTON, KY)
(Integrated Compliance Information System) - ICIS-04-2004-4756, FORMAL ENFORCEMENT ACTION ENFORCEMENT/COMPLIANCE ACTIVITY (Integrated Compliance Information System)
BURLINGTON ASHLAND (2502 BURLINGTON PIKE in BURLINGTON, KY)
(Resource Conservation and Recovery Act (tracking hazardous waste)) Organizations: BURLINGTON SHELL +++ (CONTACT/OWNER)
Alternative names: BURLINGTON SHELL +++
ARCHAMBAULT RESIDENCE (7213 FRONT ST in MAXVILLE, KY)
National Pollutant Discharge Elimination System NON-MAJOR (Tracking pollutant discharge elimination systems) - permit Business SIC classification: OPERATORS OF DWELLINGS OTHER THAN APARTMENT BUILDINGS
ARLINGHAUS PROPERTIES (RIVERSIDE DR in MCVILLE, KY)
National Pollutant Discharge Elimination System NON-MAJOR (Tracking pollutant discharge elimination systems) - permit Business SIC classification: OPERATORS OF APARTMENT BUILDINGS
BARDES RESIDENCE (10000 LOWER RIVER RD in BURLINGTON, KY)
National Pollutant Discharge Elimination System NON-MAJOR (Tracking pollutant discharge elimination systems) - permit Business SIC classification: OPERATORS OF DWELLINGS OTHER THAN APARTMENT BUILDINGS
BAUER RESIDENCE (9886 LOWER RIVER RD in BURLINGTON, KY)
National Pollutant Discharge Elimination System NON-MAJOR (Tracking pollutant discharge elimination systems) - permit Business SIC classification: OPERATORS OF DWELLINGS OTHER THAN APARTMENT BUILDINGS
BELLEVIEW COAL AND OIL CO (6324 PIKE ST in BURLINGTON, KY)
National Pollutant Discharge Elimination System NON-MAJOR (Tracking pollutant discharge elimination systems) - permit Business SIC classification: PETROLEUM BULK STATIONS AND TERMINALS
National Pollutant Discharge Elimination System NON-MAJOR (Tracking pollutant discharge elimination systems) - permit Business SIC classification: CONCRETE PRODUCTS, EXCEPT BLOCK AND BRICK
Housing units lacking complete plumbing facilities: 0.4% Housing units lacking complete kitchen facilities: 0.3%
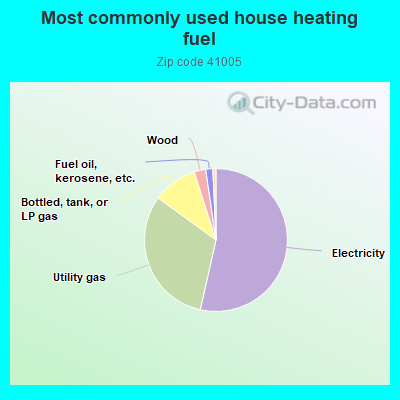
53.5%Electricity
31.4%Utility gas
10.1%Bottled, tank, or LP gas
2.6%Wood
1.6%Fuel oil, kerosene, etc.
0.7%No fuel used
Population in 1990: 8,322. Population change in the 1990s: +7,742 (+93.0%).
Place of birth for U.S.-born residents:
This state: 13,875
Northeast: 557
Midwest: 6,204
South: 2,007
West: 541
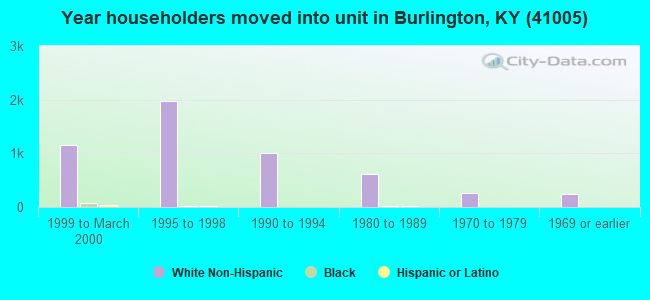
47% of the 41005 zip code residents lived in the same house 5 years ago. Out of people who lived in different houses, 41% lived in this county. Out of people who lived in different counties, 50% lived in Kentucky.
87% of the 41005 zip code residents lived in the same house 1 year ago. Out of people who lived in different houses, 38% moved from this county. Out of people who lived in different houses, 28% moved from different county within same state. Out of people who lived in different houses, 25% moved from different state. Out of people who lived in different houses, 12% moved from abroad.
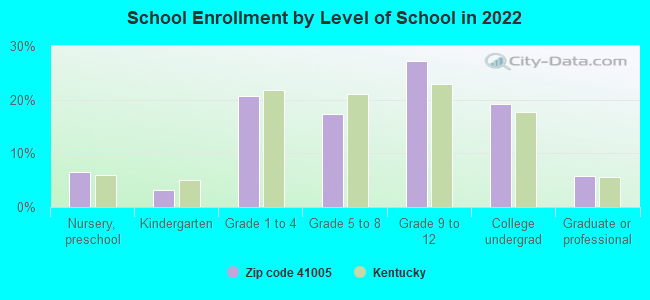
Private vs. public school enrollment:
Students in private schools in grades 1 to 8 (elementary and middle school): 275
Here:
12.7%
Kentucky:
17.2%
Students in private schools in grades 9 to 12 (high school): 77
Here:
5.0%
Kentucky:
15.2%
Students in private undergraduate colleges: 196
Here:
17.9%
Kentucky:
19.6%
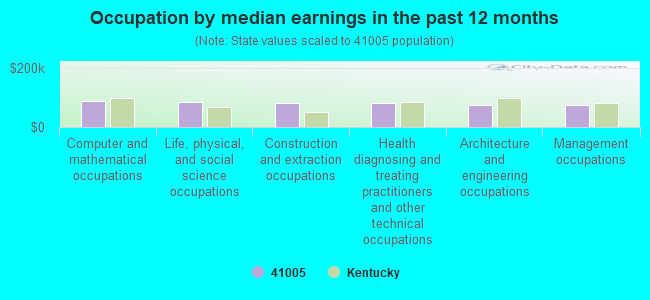
Occupation by median earnings in the past 12 months ($)
87,217Computer and mathematical occupations
84,094Life, physical, and social science occupations
81,553Construction and extraction occupations
80,178Health diagnosing and treating practitioners and other technical occupations
75,639Architecture and engineering occupations
74,124Management occupations
Companies with federal contracts located in this zip code:
SPARTAN CONSTRUCTION INCORPORA (1619 DISTRIBUTION DR in BURLINGTON, KY; small business) : $411,796 in 8 contractsfrom 2003 to 2006
Contracts for Demolition of Structures or Facilities (Other than Buildings) by U.S. Army Corps of Engineers - civil program financing only, Army Signed by year:2000: $0; 2001: $0; 2002: $0; 2003: $430,360; 2004: $292,440; 2005: $0; 2006: -$311,004.
Biggest contracts:
$380,360 with U.S. Army Corps of Engineers - civil program financing only for Demolition of Structures or Facilities (Other than Buildings). Signed on 2003-09-23. Completion date: 2005-09-30.
$147,940 with Army for Demolition of Structures or Facilities (Other than Buildings). Signed on 2004-09-23. Completion date: 2005-09-30.
$58,500, same as above.Signed on 2004-09-28. Completion date: 2005-09-30.
$43,000, same as above.Signed on 2004-03-03. Completion date: 2005-09-30.
AEROCRETE PRECAST CORPORATION (5660 LIMABURG RD in BURLINGTON, KY; small business) : $4,694 in 4 contractsfrom 2004 to 2006
$3,436 with Army for Miscellaneous Fabricated Nonmetallic Materials. Signed on 2006-02-02. Completion date: 2006-03-01.
$1,258 with Public Buildings Service for Clay and Concrete Products Industries Machinery. Taking place in TN. Signed on 2004-12-13. Completion date: 2005-01-30.
$1,258, same as above.Signed on 2004-08-30. Completion date: 2004-10-15.
-$1,258, same as above.Signed on 2004-12-13. Completion date: 2004-10-15.
Top industries in this zip code by the number of employees in 2005:
2004 - 2018 National Fire Incident Reporting System (NFIRS) incidents
According to the data from the years 2004 - 2018 the average number of fire incidents per year is 51. The highest number of reported fire incidents - 101 took place in 2007, and the least - 0 in 2005. The data has a declining trend.
When looking into fire subcategories, the most incidents belonged to: Outside Fires (42.9%), and Structure Fires (42.0%).
Fire incident types reported to NFIRS in Zip Code 41005
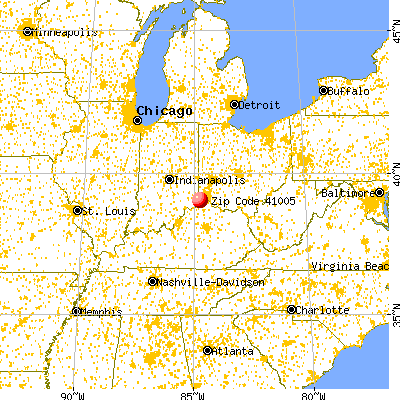


 Nearest zip codes: 41080, 41091, 41048, 41042, 45052, 45233.
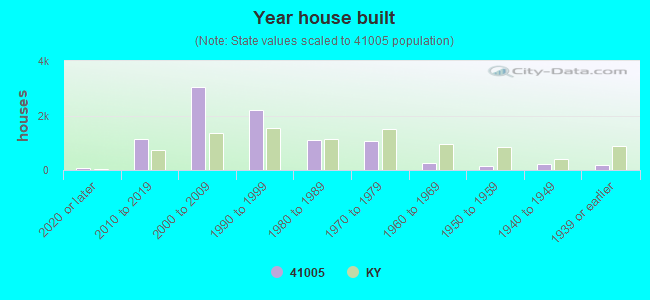


 According to the data from the years 2004 - 2018 the average number of fire incidents per year is 51. The highest number of reported fire incidents - 101 took place in 2007, and the least - 0 in 2005. The data has a declining trend.
 When looking into fire subcategories, the most incidents belonged to: Outside Fires (42.9%), and Structure Fires (42.0%).