Estimated zip code population in 2022: 20,948 Zip code population in 2010: 20,769 Zip code population in 2000: 20,730
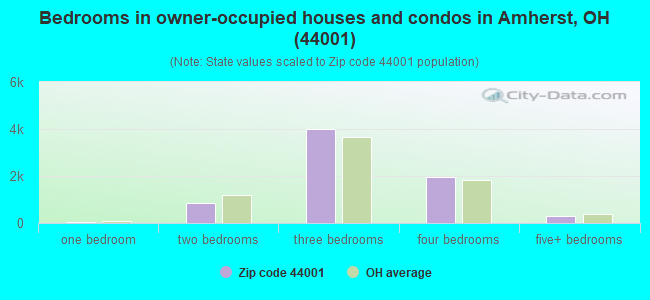
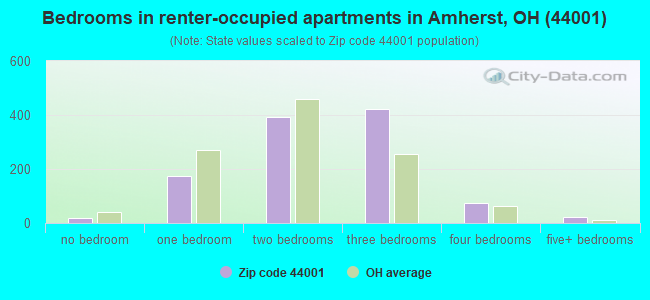
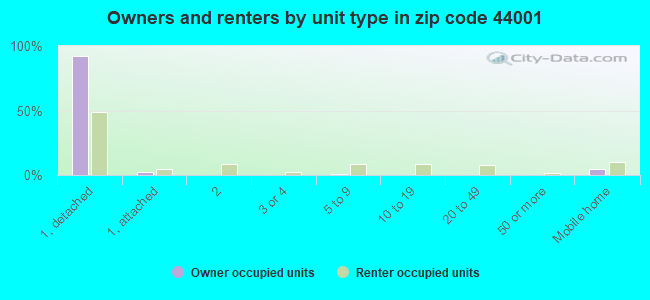
Houses and condos: 8,570 Renter-occupied apartments: 1,107
% of renters here:
13%
State:
33%
March 2022 cost of living index in zip code 44001: 93.4 (less than average, U.S. average is 100)
Land area: 34.3 sq. mi. Water area: 0.2 sq. mi.
Population density: 610 people per square mile
(low).
OSM Map
General Map
Google Map
MSN Map
OSM Map
General Map
Google Map
MSN Map
OSM Map
General Map
Google Map
MSN Map
OSM Map
General Map
Google Map
MSN Map
Please wait while loading the map...
Real estate property taxes paid for housing units in 2022:
This zip code:
1.3% ($2,943)
Ohio:
1.3% ($2,639)
Median real estate property taxes paid for housing units with mortgages in 2022: $3,243 (1.3%) Median real estate property taxes paid for housing units with no mortgage in 2022: $2,579 (1.4%)
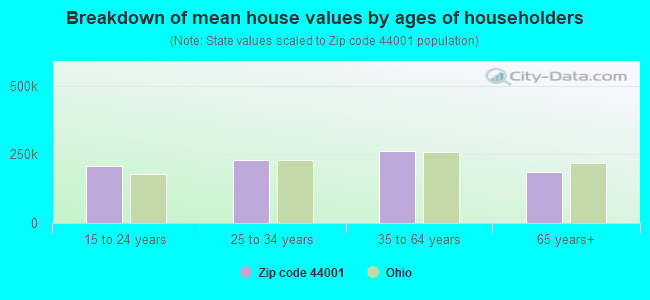
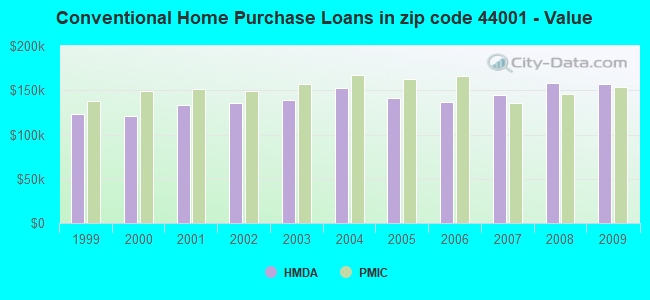
Estimated median house/condo value in 2022: $223,474
44001:
$223,474
Ohio:
$204,100
According to our research of Ohio and other state lists, there were 21 registered sex offenders living in 44001 zip code as of April 27, 2024. The ratio of all residents to sex offenders in zip code 44001 is 1,010 to 1. The ratio of registered sex offenders to all residents in this zip code is lower than the state average.
Median resident age:
This zip code:
45.8 years
Ohio median age:
39.9 years
Average household size:
This zip code:
2.5 people
Ohio:
2.4 people
Averages for the 2020 tax year for zip code 44001, filed in 2021:
Average Adjusted Gross Income (AGI) in 2020: $66,371 (Individual Income Tax Returns)
Here:
$66,371
State:
$67,288
Salary/wage: $56,374 (reported on 78.9% of returns)
Here:
$56,374
State:
$55,628
(% of AGI for various income ranges: 1065.7% for AGIs below $25k, 3323.4% for AGIs $25k-50k, 6180.9% for AGIs $50k-75k, 8789.9% for AGIs $75k-100k, 15668.5% for AGIs $100k-200k, 64564.5% for AGIs over 200k)
Taxable interest for individuals: $1,340 (reported on 31.9% of returns)
This zip code:
$1,340
Ohio:
$1,518
(% of AGI for various income ranges: 18.9% for AGIs below $25k, 28.8% for AGIs $25k-50k, 55.9% for AGIs $50k-75k, 42.3% for AGIs $75k-100k, 110.3% for AGIs $100k-200k, 1316.4% for AGIs over 200k)
Ordinary dividends: $4,004 (reported on 22.0% of returns)
Here:
$4,004
State:
$7,167
(% of AGI for various income ranges: 28.5% for AGIs below $25k, 50.6% for AGIs $25k-50k, 80.1% for AGIs $50k-75k, 112.4% for AGIs $75k-100k, 212.6% for AGIs $100k-200k, 3492.7% for AGIs over 200k)
Net capital gain/loss in AGI: +$9,838 (reported on 18.8% of returns)
Here:
+$9,838
State:
+$18,919
(% of AGI for various income ranges: 10.8% for AGIs below $25k, 40.0% for AGIs $25k-50k, 56.8% for AGIs $50k-75k, 148.1% for AGIs $75k-100k, 420.2% for AGIs $100k-200k, 12091.8% for AGIs over 200k)
Profit/loss from business: +$10,283 (reported on 12.0% of returns)
Here:
+$10,283
State:
+$13,744
(% of AGI for various income ranges: 75.3% for AGIs below $25k, 99.2% for AGIs $25k-50k, 121.0% for AGIs $50k-75k, 181.3% for AGIs $75k-100k, 356.8% for AGIs $100k-200k, 2741.8% for AGIs over 200k)
Taxable individual retirement arrangement distribution: $16,223 (reported on 12.1% of returns)
44001:
$16,223
Ohio:
$18,876
(% of AGI for various income ranges: 71.8% for AGIs below $25k, 141.0% for AGIs $25k-50k, 253.6% for AGIs $50k-75k, 407.5% for AGIs $75k-100k, 657.8% for AGIs $100k-200k, 2922.7% for AGIs over 200k)
Self-employed (Keogh) retirement plans: $20,500 (reported on 0.3% of returns)
44001:
$20,500
Ohio:
$24,898
(% of AGI for various income ranges: 53.9% for AGIs $100k-200k)
Total itemized deductions: $30,158 (reported on 4.8% of returns)
Here:
$30,158
State:
$33,869
(% of AGI for various income ranges: 39.2% for AGIs below $25k, 72.7% for AGIs $25k-50k, 137.0% for AGIs $50k-75k, 229.8% for AGIs $75k-100k, 468.9% for AGIs $100k-200k, 4302.7% for AGIs over 200k)
Charity contributions: $11,231 (reported on 3.6% of returns)
Here:
$11,231
State:
$14,577
(% of AGI for various income ranges: 13.4% for AGIs $25k-50k, 18.8% for AGIs $50k-75k, 28.8% for AGIs $75k-100k, 123.0% for AGIs $100k-200k, 2273.6% for AGIs over 200k)
Taxes paid: $7,040 (reported on 4.8% of returns)
44001:
$7,040
State:
$7,681
(% of AGI for various income ranges: 2.8% for AGIs below $25k, 11.2% for AGIs $25k-50k, 35.6% for AGIs $50k-75k, 62.1% for AGIs $75k-100k, 142.0% for AGIs $100k-200k, 790.0% for AGIs over 200k)
Earned income credit: $1,950 (reported on 9.6% of returns)
Here:
$1,950
State:
$2,304
(% of AGI for various income ranges: 53.2% for AGIs below $25k, 44.9% for AGIs $25k-50k, 0.8% for AGIs $50k-75k)
Percentage of individuals using paid preparers for their 2020 taxes: 94.0%
Here:
94%
State:
94%
(% for various income ranges: 92.4% for AGIs below $25k, 94.1% for AGIs $25k-50k, 95.1% for AGIs $50k-75k, 95.3% for AGIs $75k-100k, 94.6% for AGIs $100k-200k, 94.4% for AGIs over 200k)
Averages for the 2012 tax year for zip code 44001, filed in 2013:
Average Adjusted Gross Income (AGI) in 2012: $54,973 (Individual Income Tax Returns)
Here:
$54,973
State:
$54,926
Salary/wage: $47,274 (reported on 84.7% of returns)
Here:
$47,274
State:
$45,869
(% of AGI for various income ranges: 68.5% for AGIs below $25k, 72.4% for AGIs $25k-50k, 74.2% for AGIs $50k-75k, 77.3% for AGIs $75k-100k, 79.8% for AGIs $100k-200k, 52.2% for AGIs over 200k)
Taxable interest for individuals: $1,057 (reported on 39.3% of returns)
This zip code:
$1,057
Ohio:
$1,297
(% of AGI for various income ranges: 1.3% for AGIs below $25k, 0.8% for AGIs $25k-50k, 0.7% for AGIs $50k-75k, 0.5% for AGIs $75k-100k, 0.4% for AGIs $100k-200k, 1.6% for AGIs over 200k)
Ordinary dividends: $2,622 (reported on 23.2% of returns)
Here:
$2,622
State:
$5,821
(% of AGI for various income ranges: 1.6% for AGIs below $25k, 0.9% for AGIs $25k-50k, 1.0% for AGIs $50k-75k, 0.9% for AGIs $75k-100k, 1.0% for AGIs $100k-200k, 1.6% for AGIs over 200k)
Net capital gain/loss in AGI: +$2,572 (reported on 16.2% of returns)
Here:
+$2,572
State:
+$11,232
(% of AGI for various income ranges: 0.2% for AGIs $50k-75k, 0.3% for AGIs $75k-100k, 1.0% for AGIs $100k-200k, 3.2% for AGIs over 200k)
Profit/loss from business: +$11,305 (reported on 11.0% of returns)
Here:
+$11,305
State:
+$12,773
(% of AGI for various income ranges: 3.0% for AGIs below $25k, 1.7% for AGIs $25k-50k, 2.0% for AGIs $50k-75k, 2.0% for AGIs $75k-100k, 2.2% for AGIs $100k-200k, 3.4% for AGIs over 200k)
Taxable individual retirement arrangement distribution: $10,767 (reported on 12.1% of returns)
44001:
$10,767
Ohio:
$14,511
(% of AGI for various income ranges: 3.4% for AGIs below $25k, 2.9% for AGIs $25k-50k, 2.6% for AGIs $50k-75k, 2.5% for AGIs $75k-100k, 1.9% for AGIs $100k-200k, 1.6% for AGIs over 200k)
Self-employment retirement plans: $10,600 (reported on 0.4% of returns)
44001:
$10,600
Ohio:
$20,257
(% of AGI for various income ranges: 0.3% for AGIs $100k-200k)
Total itemized deductions: $18,552 (20% of AGI, reported on 35.9% of returns)
Here:
$18,552
State:
$21,278
Here:
19.6% of AGI
State:
18.8% of AGI
(% of AGI for various income ranges: 7.2% for AGIs below $25k, 10.2% for AGIs $25k-50k, 11.3% for AGIs $50k-75k, 12.4% for AGIs $75k-100k, 14.6% for AGIs $100k-200k, 12.6% for AGIs over 200k)
Charity contributions: $2,686 (reported on 28.8% of returns)
Here:
$2,686
State:
$3,943
(% of AGI for various income ranges: 0.5% for AGIs below $25k, 1.1% for AGIs $25k-50k, 1.1% for AGIs $50k-75k, 1.5% for AGIs $75k-100k, 1.8% for AGIs $100k-200k, 1.8% for AGIs over 200k)
Taxes paid: $7,893 (reported on 35.8% of returns)
44001:
$7,893
State:
$9,568
(% of AGI for various income ranges: 1.4% for AGIs below $25k, 2.8% for AGIs $25k-50k, 4.3% for AGIs $50k-75k, 5.1% for AGIs $75k-100k, 7.1% for AGIs $100k-200k, 7.1% for AGIs over 200k)
Earned income credit: $1,895 (reported on 10.3% of returns)
Here:
$1,895
State:
$2,285
(% of AGI for various income ranges: 3.4% for AGIs below $25k, 0.6% for AGIs $25k-50k)
Percentage of individuals using paid preparers for their 2012 taxes: 54.0%
Here:
54%
State:
51%
(% for various income ranges: 45.6% for AGIs below $25k, 55.9% for AGIs $25k-50k, 60.8% for AGIs $50k-75k, 59.8% for AGIs $75k-100k, 56.9% for AGIs $100k-200k, 76.2% for AGIs over 200k)
Averages for the 2004 tax year for zip code 44001, filed in 2005:
Average Adjusted Gross Income (AGI) in 2004: $47,123 (Individual Income Tax Returns)
Here:
$47,123
State:
$44,480
Salary/wage: $43,005 (reported on 86.5% of returns)
Here:
$43,005
State:
$39,198
(% of AGI for various income ranges: 102.6% for AGIs below $10k, 67.0% for AGIs $10k-25k, 76.3% for AGIs $25k-50k, 82.4% for AGIs $50k-75k, 87.0% for AGIs $75k-100k, 74.6% for AGIs over 100k)
Taxable interest for individuals: $1,418 (reported on 52.3% of returns)
This zip code:
$1,418
Ohio:
$1,532
(% of AGI for various income ranges: 5.6% for AGIs below $10k, 2.7% for AGIs $10k-25k, 1.4% for AGIs $25k-50k, 1.0% for AGIs $50k-75k, 1.1% for AGIs $75k-100k, 1.9% for AGIs over 100k)
Taxable dividends: $2,203 (reported on 29.3% of returns)
Here:
$2,203
State:
$3,496
(% of AGI for various income ranges: 3.9% for AGIs below $10k, 1.9% for AGIs $10k-25k, 1.2% for AGIs $25k-50k, 1.0% for AGIs $50k-75k, 0.7% for AGIs $75k-100k, 2.0% for AGIs over 100k)
Net capital gain/loss: +$5,678 (reported on 20.0% of returns)
Here:
+$5,678
State:
+$8,582
(% of AGI for various income ranges: -0.6% for AGIs below $10k, 0.1% for AGIs $10k-25k, 0.4% for AGIs $25k-50k, 0.9% for AGIs $50k-75k, 0.6% for AGIs $75k-100k, 6.6% for AGIs over 100k)
Profit/loss from business: +$9,979 (reported on 11.3% of returns)
Here:
+$9,979
State:
+$10,813
(% of AGI for various income ranges: 4.8% for AGIs below $10k, 3.5% for AGIs $10k-25k, 2.2% for AGIs $25k-50k, 1.6% for AGIs $50k-75k, 2.1% for AGIs $75k-100k, 2.9% for AGIs over 100k)
IRA payment deduction: $2,913 (reported on 2.5% of returns)
44001:
$2,913
Ohio:
$2,794
(% of AGI for various income ranges: 0.2% for AGIs $10k-25k, 0.2% for AGIs $25k-50k, 0.2% for AGIs $50k-75k, 0.1% for AGIs $75k-100k, 0.1% for AGIs over 100k)
Self-employed pension: $8,622 (reported on 0.4% of returns)
Here:
$8,622
Ohio:
$13,981
(% of AGI for various income ranges: 0.1% for AGIs $50k-75k, 0.1% for AGIs $75k-100k, 0.1% for AGIs over 100k)
Total itemized deductions: $16,620 (21% of AGI, reported on 41.6% of returns)
Here:
$16,620
State:
$17,503
Here:
21.1% of AGI
State:
20.8% of AGI
(% of AGI for various income ranges: 8.9% for AGIs below $10k, 9.0% for AGIs $10k-25k, 12.8% for AGIs $25k-50k, 15.5% for AGIs $50k-75k, 16.2% for AGIs $75k-100k, 15.9% for AGIs over 100k)
Charity contributions deductions: $2,308 (3% of AGI, reported on 36.6% of returns)
Here:
$2,308
State:
$3,087
Here:
2.8% of AGI
State:
3.4% of AGI
(% of AGI for various income ranges: 0.5% for AGIs below $10k, 0.8% for AGIs $10k-25k, 1.4% for AGIs $25k-50k, 1.6% for AGIs $50k-75k, 1.8% for AGIs $75k-100k, 2.5% for AGIs over 100k)
Total tax: $6,297 (reported on 80.1% of returns)
44001:
$6,297
State:
$6,781
(% of AGI for various income ranges: 2.5% for AGIs below $10k, 4.2% for AGIs $10k-25k, 7.3% for AGIs $25k-50k, 8.8% for AGIs $50k-75k, 10.1% for AGIs $75k-100k, 16.5% for AGIs over 100k)
Earned income credit: $1,405 (reported on 8.4% of returns)
Here:
$1,405
State:
$1,696
Percentage of individuals using paid preparers for their 2004 taxes: 57.0%
Here:
57%
State:
55%
(% for various income ranges: 43.5% for AGIs below $10k, 58.8% for AGIs $10k-25k, 59.8% for AGIs $25k-50k, 63.1% for AGIs $50k-75k, 59.6% for AGIs $75k-100k, 59.6% for AGIs over 100k)
Likely homosexual households (counted as self-reported same-sex unmarried-partner households)
Lesbian couples: 0.0% of all households
Gay men: 0.2% of all households
Household received Food Stamps/SNAP in the past 12 months: 330 Household did not receive Food Stamps/SNAP in the past 12 months: 7,865
Women who had a birth in the past 12 months: 122 (117 now married, 7 unmarried) Women who did not have a birth in the past 12 months: 4,121 (1,785 now married, 2,335 unmarried)
Housing units in zip code 44001 with a mortgage: 4,350 (638 second mortgage, 549 both second mortgage and home equity loan) Houses without a mortgage: 294
Median monthly owner costs for units with a mortgage: $1,426 Median monthly owner costs for units without a mortgage: $572
Residents with income below the poverty level in 2022:
This zip code:
5.8%
Whole state:
13.4%
Residents with income below 50% of the poverty level in 2022:
This zip code:
3.2%
Whole state:
7.0%
Median number of rooms in houses and condos:
Here:
6.9
State:
6.7
Median number of rooms in apartments:
Here:
4.9
State:
4.4
Notable locations in this zip code not listed on our city pages
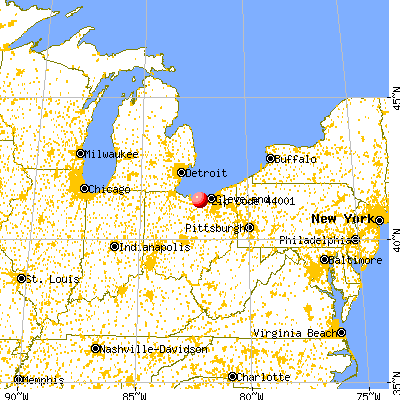
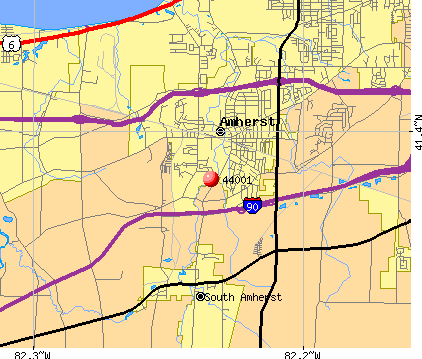
Notable locations in zip code 44001: Lorain County Speedway (A), Amherst Wastewater Treatment Plant (B), Hillcrest Orchards (C), McDowell Orchards (D), Miller Orchards (E), Lifecare Ambulance Service Station 9 (F), Amherst City Hall (G), Amherst Public Library (H), Amherst Fire Department (I), South Amherst Fire Department (J), Amherst Cinema (K). Display/hide their locations on the map
Shopping Centers: Amherst Plaza Shopping Center (1), Liberty Bell Shopping Center (2), Milan Avenue Shopping Center (3). Display/hide their locations on the map
Churches in zip code 44001 include: Saint Peter United Church of Christ (A), Old Stone United Church of Christ (B), Amherst Congregational United Church of Christ (C), Amherst Park Avenue United Methodist Church (D), Saint Paul Lutheran Church (E), Saint Joseph Roman Catholic Church (F), Amherst Church of Christ (G), Westminster Presbyterian Church (H), Calvary Church (I). Display/hide their locations on the map
Cemeteries: Cleveland Street Cemetery (1), Crownhill Cemetery (2), Ridge Hill Memorial Park (3), Township Cemetery (4), Evergreen Cemetery (5), Kendeigh Corner Cemetery (6), Middle Ridge Cemetery (7). Display/hide their locations on the map
Parks in zip code 44001 include: Neiding Park (1), DePaola Park (2), Amherst Township Park (3), Brownhelm Historic District (4). Display/hide their locations on the map
2,756 married couples with children.
855 single-parent households (628 men, 227 women).
96.6% of residents of 44001 zip code speak English at home.
1.1% of residents speak Spanish at home (92% very well, 4% well, 2% not well, 2% not at all).
1.0% of residents speak other Indo-European language at home (95% very well, 3% well, 2% not well).
1.1% of residents speak Asian or Pacific Island language at home (90% very well, 2% well, 8% not well).
0.2% of residents speak other language at home (100% very well).
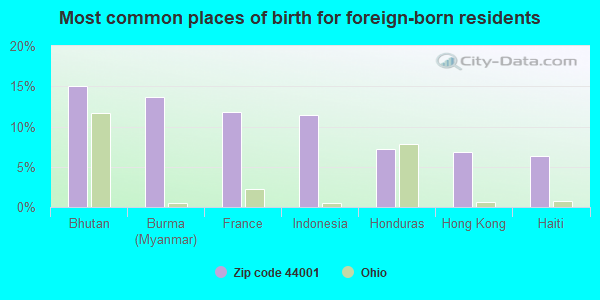
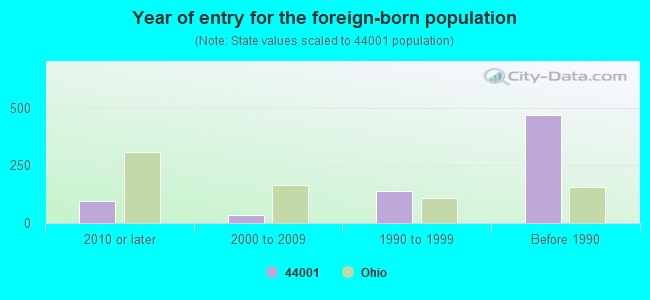
Foreign born population: 701 (3.3%) (81.4% of them are naturalized citizens)
This zip code:
3.3%
Whole state:
5.0%
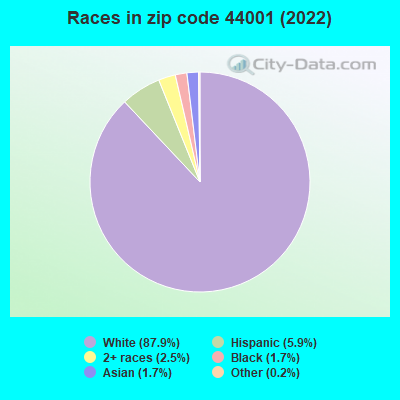
15%Bhutan
14%Burma (Myanmar)
12%France
11%Indonesia
7%Honduras
7%Hong Kong
6%Haiti
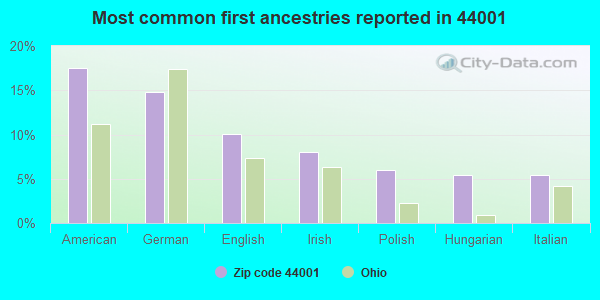
18%American
15%German
10%English
8%Irish
6%Polish
5%Hungarian
5%Italian
Year of entry for the foreign-born population
952010 or later
352000 to 2009
1391990 to 1999
468Before 1990
Facilities with environmental interests located in this zip code:
BP OIL CO SITE 05102 * (801 N LEAVILL RD in AMHERST, OH)
AIR MINOR (AIRS/AFS) STATE MASTER (Ohio general info) - AIR MAJOR STATE MASTER (Ohio general info) - RCRA-OHD987024627, HAZARDOUS WASTE PROGRAM, -18-5541-905-9, EPCRA Conditionally Exempt Small Quantity Generators, less than 100 kg/month of hazardous waste (Resource Conservation and Recovery Act (tracking hazardous waste)) - notification Business SIC classification: GASOLINE SERVICE STATIONS Organizations: BP OIL COMPANY (CONTACT/OWNER)
Alternative names: BP OIL CO NO 5102 *, BP OIL COMPANY #05102, BP OIL COMPANY #22458
AMHERST HOSPITAL * (254 CLEVELAND AVE in AMHERST, OH)
STATE MASTER (Ohio general info) - AIR MAJOR STATE MASTER (Ohio general info) - -47-8062-119-1, EPCRA Conditionally Exempt Small Quantity Generators, less than 100 kg/month of hazardous waste (Resource Conservation and Recovery Act (tracking hazardous waste)) - notification Organizations: AMHERST HOSPITAL ASSN (CONTACT/OWNER)
Alternative names: AMHERST HOSPITAL ASSN
AMHERST MARATHON (46005 TELEGRAPH RD in AMHERST, OH)
AIR MINOR (AIRS/AFS) STATE MASTER (Ohio general info) - EPCRA (Resource Conservation and Recovery Act (tracking hazardous waste)) Business SIC classification: GASOLINE SERVICE STATIONS Organizations: MARATHON OIL CO (CONTACT/OWNER)
Alternative names: AMHERST MARATHON #3198
AMHERST WWTP (931 N LAKE ST in AMHERST, OH)
STATE MASTER (Ohio general info) - PCS-OH0021628, National Pollutant Discharge Elimination System Permit National Pollutant Discharge Elimination System MAJOR (Tracking pollutant discharge elimination systems) - permit National Pollutant Discharge Elimination System NON-MAJOR (Tracking pollutant discharge elimination systems) - permit Business SIC classification: SEWERAGE SYSTEMS Organizations: CITY OF AMHERST (CONTACT/OWNER)
, AMHERST, CITY OF (CONTACT/OWNER)
Alternative names: AMHERST, CITY OF, CITY OF AMHERST
AMHERST MHP (ROUTE 113 TELEGRAPH ROAD in SOUTH AMHERST, OH)
STATE MASTER (Ohio general info) - PCS-OH0111911, National Pollutant Discharge Elimination System Permit National Pollutant Discharge Elimination System NON-MAJOR (Tracking pollutant discharge elimination systems) - permit Business SIC classification: SEWERAGE SYSTEMS Organizations: AMHERST MOBILE HOME PARK (CONTACT/OWNER)
Alternative names: AMHERST MOBIL HOME PARK, AMHERST MOBILE HOME PARK
AMHERST VERSAKLEEN (399 CLEVELAND AVE in AMHERST, OH)
STATE MASTER (Ohio general info) - AIR MAJOR (Resource Conservation and Recovery Act (tracking hazardous waste)) Organizations: BOURISSEAU ZANE (CONTACT/OWNER)
AMHERST DRY CLEANER (240 TENNEY AVENUE in SOUTH AMHERST, OH)
STATE MASTER (Ohio general info) - AIR MAJOR, RCRA-OHD017502881, HAZARDOUS WASTE PROGRAM Conditionally Exempt Small Quantity Generators, less than 100 kg/month of hazardous waste (Resource Conservation and Recovery Act (tracking hazardous waste)) Organizations: WALDECKI LUCILLE (CONTACT/OWNER)
, LUCILLE WALDECKI (CONTACT/OWNER)
AMHERST CITGO * (1999 COOPER FOSTER PARK #R in AMHERST, OH)
AIR MINOR (AIRS/AFS) STATE MASTER (Ohio general info) - EPCRA Business SIC classification: GASOLINE SERVICE STATIONS
AMMERST METAL PRODUCTS INC (7836 OBERLIN RD in AMHERST, OH)
STATE MASTER (Ohio general info) - RCRA-OHD987039237, HAZARDOUS WASTE PROGRAM Small Quantity Generators, between 100 kg and 1000 kg of hazardous waste/month (Resource Conservation and Recovery Act (tracking hazardous waste)) - notification Organizations: BRITTANY CORP (CONTACT/OWNER)
, BRITTANY CORPORATION (CONTACT/OWNER)
BP OIL CO SITE 05358 (45975 TELEGRAPH ROAD in SOUTH AMHERST, OH)
STATE MASTER (Ohio general info) - RCRA-OHD987025335, HAZARDOUS WASTE PROGRAM, -47-5541-168-12, EPCRA, SDWIS-4737412, DRINKING WATER PROGRAM Conditionally Exempt Small Quantity Generators, less than 100 kg/month of hazardous waste (Resource Conservation and Recovery Act (tracking hazardous waste)) - notification Organizations: BP OIL COMPANY (CONTACT/OWNER)
AMHERST IGA (1190 MILAN AVE in AMHERST, OH)
AIR MINOR (AIRS/AFS) Business SIC classification: GASOLINE SERVICE STATIONS
AMHERST AUTO BODY (46245 MIDDLERIDGE RD in AMHERST, OH)
Small Quantity Generators, between 100 kg and 1000 kg of hazardous waste/month (Resource Conservation and Recovery Act (tracking hazardous waste)) - notification Organizations: SCHULTZ GARY (CONTACT/OWNER)
Housing units lacking complete plumbing facilities: 0.5% Housing units lacking complete kitchen facilities: 0.9%
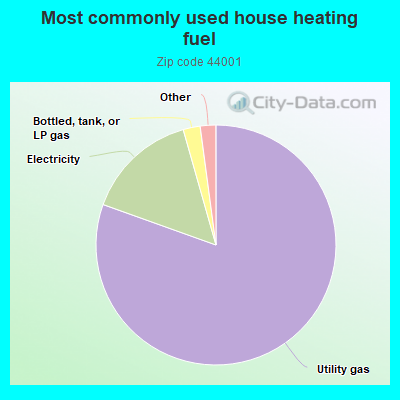
80.4%Utility gas
15.1%Electricity
2.3%Bottled, tank, or LP gas
0.8%No fuel used
0.7%Other fuel
Population in 1990: 18,839. Population change in the 1990s: +1,891 (+10.0%).
Place of birth for U.S.-born residents:
This state: 17,237
Northeast: 881
Midwest: 450
South: 1,309
West: 263
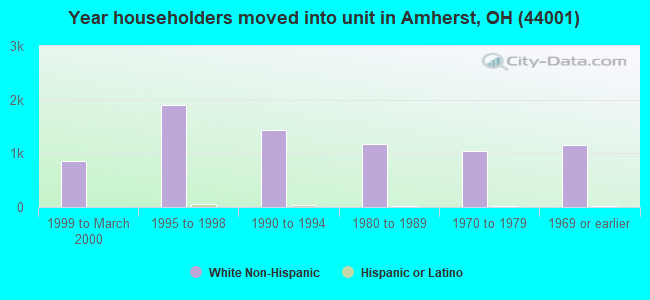
64% of the 44001 zip code residents lived in the same house 5 years ago. Out of people who lived in different houses, 76% lived in this county. Out of people who lived in different counties, 50% lived in Ohio.
95% of the 44001 zip code residents lived in the same house 1 year ago. Out of people who lived in different houses, 53% moved from this county. Out of people who lived in different houses, 23% moved from different county within same state. Out of people who lived in different houses, 23% moved from different state. Out of people who lived in different houses, 11% moved from abroad.
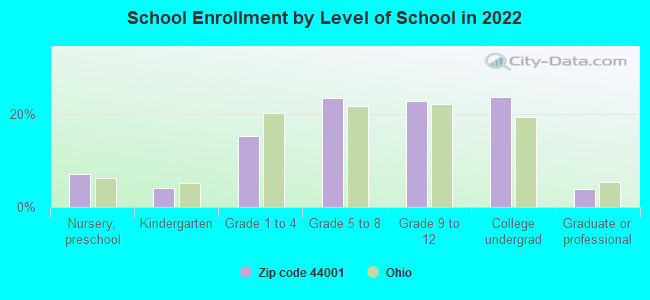
Private vs. public school enrollment:
Students in private schools in grades 1 to 8 (elementary and middle school): 86
Here:
4.9%
Ohio:
16.0%
Students in private schools in grades 9 to 12 (high school): 56
Here:
5.3%
Ohio:
13.1%
Students in private undergraduate colleges: 193
Here:
17.6%
Ohio:
22.3%
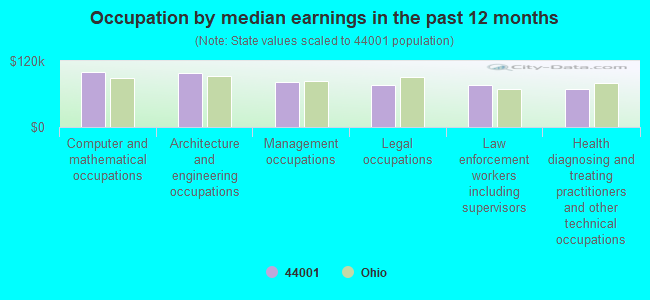
Occupation by median earnings in the past 12 months ($)
100,293Computer and mathematical occupations
99,023Architecture and engineering occupations
82,074Management occupations
77,094Legal occupations
76,541Law enforcement workers including supervisors
69,965Health diagnosing and treating practitioners and other technical occupations
Companies with federal contracts located in this zip code:
CLOVERVALE FARMS, INC (1833 COOPER FOSTER PARK RD in AMHERST, OH; small business) : $5,284,180 in 4 contractsin 2005
$2,437,120 with Defense Logistics Agency for Special Dietary Foods and Food Specialty Preparations. Signed on 2005-10-28. Completion date: 2005-11-08.
$2,034,560, same as above.Signed on 2005-09-30. Completion date: 2005-09-30.
$427,500, same as above.Signed on 2005-09-19. Completion date: 2005-09-19.
$385,000, same as above.Signed on 2005-09-23. Completion date: 2005-09-23.
Top industries in this zip code by the number of employees in 2005:
2003 - 2018 National Fire Incident Reporting System (NFIRS) incidents
Based on the data from the years 2003 - 2018 the average number of fires per year is 86. The highest number of reported fire incidents - 113 took place in 2004, and the least - 57 in 2013. The data has a dropping trend.
When looking into fire subcategories, the most reports belonged to: Structure Fires (41.7%), and Outside Fires (36.8%).
Fire incident types reported to NFIRS in Zip Code 44001


 Nearest zip codes: 44053, 44074, 44816, 44049, 44089, 44035.


 Based on the data from the years 2003 - 2018 the average number of fires per year is 86. The highest number of reported fire incidents - 113 took place in 2004, and the least - 57 in 2013. The data has a dropping trend.
 When looking into fire subcategories, the most reports belonged to: Structure Fires (41.7%), and Outside Fires (36.8%).