Lorain, Ohio Submit your own pictures of this city and show them to the world
OSM Map
General Map
Google Map
MSN Map
OSM Map
General Map
Google Map
MSN Map
OSM Map
General Map
Google Map
MSN Map
OSM Map
General Map
Google Map
MSN Map
Please wait while loading the map...
Population in 2022: 65,365 (100% urban, 0% rural). Population change since 2000: -4.8%Males: 31,041 Females: 34,324
March 2022 cost of living index in Lorain: 92.9 (less than average, U.S. average is 100) Percentage of residents living in poverty in 2022: 21.7%for White Non-Hispanic residents , 38.0% for Black residents , 34.4% for Hispanic or Latino residents , 15.9% for American Indian residents , 100.0% for Native Hawaiian and other Pacific Islander residents , 30.9% for other race residents , 29.6% for two or more races residents )
Profiles of local businesses
Business Search - 14 Million verified businesses
Data:
Median household income ($)
Median household income (% change since 2000)
Household income diversity
Ratio of average income to average house value (%)
Ratio of average income to average rent
Median household income ($) - White
Median household income ($) - Black or African American
Median household income ($) - Asian
Median household income ($) - Hispanic or Latino
Median household income ($) - American Indian and Alaska Native
Median household income ($) - Multirace
Median household income ($) - Other Race
Median household income for houses/condos with a mortgage ($)
Median household income for apartments without a mortgage ($)
Races - White alone (%)
Races - White alone (% change since 2000)
Races - Black alone (%)
Races - Black alone (% change since 2000)
Races - American Indian alone (%)
Races - American Indian alone (% change since 2000)
Races - Asian alone (%)
Races - Asian alone (% change since 2000)
Races - Hispanic (%)
Races - Hispanic (% change since 2000)
Races - Native Hawaiian and Other Pacific Islander alone (%)
Races - Native Hawaiian and Other Pacific Islander alone (% change since 2000)
Races - Two or more races (%)
Races - Two or more races (% change since 2000)
Races - Other race alone (%)
Races - Other race alone (% change since 2000)
Racial diversity
Unemployment (%)
Unemployment (% change since 2000)
Unemployment (%) - White
Unemployment (%) - Black or African American
Unemployment (%) - Asian
Unemployment (%) - Hispanic or Latino
Unemployment (%) - American Indian and Alaska Native
Unemployment (%) - Multirace
Unemployment (%) - Other Race
Population density (people per square mile)
Population - Males (%)
Population - Females (%)
Population - Males (%) - White
Population - Males (%) - Black or African American
Population - Males (%) - Asian
Population - Males (%) - Hispanic or Latino
Population - Males (%) - American Indian and Alaska Native
Population - Males (%) - Multirace
Population - Males (%) - Other Race
Population - Females (%) - White
Population - Females (%) - Black or African American
Population - Females (%) - Asian
Population - Females (%) - Hispanic or Latino
Population - Females (%) - American Indian and Alaska Native
Population - Females (%) - Multirace
Population - Females (%) - Other Race
Coronavirus confirmed cases (Apr 27, 2024)
Deaths caused by coronavirus (Apr 27, 2024)
Coronavirus confirmed cases (per 100k population) (Apr 27, 2024)
Deaths caused by coronavirus (per 100k population) (Apr 27, 2024)
Daily increase in number of cases (Apr 27, 2024)
Weekly increase in number of cases (Apr 27, 2024)
Cases doubled (in days) (Apr 27, 2024)
Hospitalized patients (Apr 18, 2022)
Negative test results (Apr 18, 2022)
Total test results (Apr 18, 2022)
COVID Vaccine doses distributed (per 100k population) (Sep 19, 2023)
COVID Vaccine doses administered (per 100k population) (Sep 19, 2023)
COVID Vaccine doses distributed (Sep 19, 2023)
COVID Vaccine doses administered (Sep 19, 2023)
Likely homosexual households (%)
Likely homosexual households (% change since 2000)
Likely homosexual households - Lesbian couples (%)
Likely homosexual households - Lesbian couples (% change since 2000)
Likely homosexual households - Gay men (%)
Likely homosexual households - Gay men (% change since 2000)
Cost of living index
Median gross rent ($)
Median contract rent ($)
Median monthly housing costs ($)
Median house or condo value ($)
Median house or condo value ($ change since 2000)
Mean house or condo value by units in structure - 1, detached ($)
Mean house or condo value by units in structure - 1, attached ($)
Mean house or condo value by units in structure - 2 ($)
Mean house or condo value by units in structure by units in structure - 3 or 4 ($)
Mean house or condo value by units in structure - 5 or more ($)
Mean house or condo value by units in structure - Boat, RV, van, etc. ($)
Mean house or condo value by units in structure - Mobile home ($)
Median house or condo value ($) - White
Median house or condo value ($) - Black or African American
Median house or condo value ($) - Asian
Median house or condo value ($) - Hispanic or Latino
Median house or condo value ($) - American Indian and Alaska Native
Median house or condo value ($) - Multirace
Median house or condo value ($) - Other Race
Median resident age
Resident age diversity
Median resident age - Males
Median resident age - Females
Median resident age - White
Median resident age - Black or African American
Median resident age - Asian
Median resident age - Hispanic or Latino
Median resident age - American Indian and Alaska Native
Median resident age - Multirace
Median resident age - Other Race
Median resident age - Males - White
Median resident age - Males - Black or African American
Median resident age - Males - Asian
Median resident age - Males - Hispanic or Latino
Median resident age - Males - American Indian and Alaska Native
Median resident age - Males - Multirace
Median resident age - Males - Other Race
Median resident age - Females - White
Median resident age - Females - Black or African American
Median resident age - Females - Asian
Median resident age - Females - Hispanic or Latino
Median resident age - Females - American Indian and Alaska Native
Median resident age - Females - Multirace
Median resident age - Females - Other Race
Commute - mean travel time to work (minutes)
Travel time to work - Less than 5 minutes (%)
Travel time to work - Less than 5 minutes (% change since 2000)
Travel time to work - 5 to 9 minutes (%)
Travel time to work - 5 to 9 minutes (% change since 2000)
Travel time to work - 10 to 19 minutes (%)
Travel time to work - 10 to 19 minutes (% change since 2000)
Travel time to work - 20 to 29 minutes (%)
Travel time to work - 20 to 29 minutes (% change since 2000)
Travel time to work - 30 to 39 minutes (%)
Travel time to work - 30 to 39 minutes (% change since 2000)
Travel time to work - 40 to 59 minutes (%)
Travel time to work - 40 to 59 minutes (% change since 2000)
Travel time to work - 60 to 89 minutes (%)
Travel time to work - 60 to 89 minutes (% change since 2000)
Travel time to work - 90 or more minutes (%)
Travel time to work - 90 or more minutes (% change since 2000)
Marital status - Never married (%)
Marital status - Now married (%)
Marital status - Separated (%)
Marital status - Widowed (%)
Marital status - Divorced (%)
Median family income ($)
Median family income (% change since 2000)
Median non-family income ($)
Median non-family income (% change since 2000)
Median per capita income ($)
Median per capita income (% change since 2000)
Median family income ($) - White
Median family income ($) - Black or African American
Median family income ($) - Asian
Median family income ($) - Hispanic or Latino
Median family income ($) - American Indian and Alaska Native
Median family income ($) - Multirace
Median family income ($) - Other Race
Median year house/condo built
Median year apartment built
Year house built - Built 2005 or later (%)
Year house built - Built 2000 to 2004 (%)
Year house built - Built 1990 to 1999 (%)
Year house built - Built 1980 to 1989 (%)
Year house built - Built 1970 to 1979 (%)
Year house built - Built 1960 to 1969 (%)
Year house built - Built 1950 to 1959 (%)
Year house built - Built 1940 to 1949 (%)
Year house built - Built 1939 or earlier (%)
Average household size
Household density (households per square mile)
Average household size - White
Average household size - Black or African American
Average household size - Asian
Average household size - Hispanic or Latino
Average household size - American Indian and Alaska Native
Average household size - Multirace
Average household size - Other Race
Occupied housing units (%)
Vacant housing units (%)
Owner occupied housing units (%)
Renter occupied housing units (%)
Vacancy status - For rent (%)
Vacancy status - For sale only (%)
Vacancy status - Rented or sold, not occupied (%)
Vacancy status - For seasonal, recreational, or occasional use (%)
Vacancy status - For migrant workers (%)
Vacancy status - Other vacant (%)
Residents with income below the poverty level (%)
Residents with income below 50% of the poverty level (%)
Children below poverty level (%)
Poor families by family type - Married-couple family (%)
Poor families by family type - Male, no wife present (%)
Poor families by family type - Female, no husband present (%)
Poverty status for native-born residents (%)
Poverty status for foreign-born residents (%)
Poverty among high school graduates not in families (%)
Poverty among people who did not graduate high school not in families (%)
Residents with income below the poverty level (%) - White
Residents with income below the poverty level (%) - Black or African American
Residents with income below the poverty level (%) - Asian
Residents with income below the poverty level (%) - Hispanic or Latino
Residents with income below the poverty level (%) - American Indian and Alaska Native
Residents with income below the poverty level (%) - Multirace
Residents with income below the poverty level (%) - Other Race
Air pollution - Air Quality Index (AQI)
Air pollution - CO
Air pollution - NO2
Air pollution - SO2
Air pollution - Ozone
Air pollution - PM10
Air pollution - PM25
Air pollution - Pb
Crime - Murders per 100,000 population
Crime - Rapes per 100,000 population
Crime - Robberies per 100,000 population
Crime - Assaults per 100,000 population
Crime - Burglaries per 100,000 population
Crime - Thefts per 100,000 population
Crime - Auto thefts per 100,000 population
Crime - Arson per 100,000 population
Crime - City-data.com crime index
Crime - Violent crime index
Crime - Property crime index
Crime - Murders per 100,000 population (5 year average)
Crime - Rapes per 100,000 population (5 year average)
Crime - Robberies per 100,000 population (5 year average)
Crime - Assaults per 100,000 population (5 year average)
Crime - Burglaries per 100,000 population (5 year average)
Crime - Thefts per 100,000 population (5 year average)
Crime - Auto thefts per 100,000 population (5 year average)
Crime - Arson per 100,000 population (5 year average)
Crime - City-data.com crime index (5 year average)
Crime - Violent crime index (5 year average)
Crime - Property crime index (5 year average)
1996 Presidential Elections Results (%) - Democratic Party (Clinton)
1996 Presidential Elections Results (%) - Republican Party (Dole)
1996 Presidential Elections Results (%) - Other
2000 Presidential Elections Results (%) - Democratic Party (Gore)
2000 Presidential Elections Results (%) - Republican Party (Bush)
2000 Presidential Elections Results (%) - Other
2004 Presidential Elections Results (%) - Democratic Party (Kerry)
2004 Presidential Elections Results (%) - Republican Party (Bush)
2004 Presidential Elections Results (%) - Other
2008 Presidential Elections Results (%) - Democratic Party (Obama)
2008 Presidential Elections Results (%) - Republican Party (McCain)
2008 Presidential Elections Results (%) - Other
2012 Presidential Elections Results (%) - Democratic Party (Obama)
2012 Presidential Elections Results (%) - Republican Party (Romney)
2012 Presidential Elections Results (%) - Other
2016 Presidential Elections Results (%) - Democratic Party (Clinton)
2016 Presidential Elections Results (%) - Republican Party (Trump)
2016 Presidential Elections Results (%) - Other
2020 Presidential Elections Results (%) - Democratic Party (Biden)
2020 Presidential Elections Results (%) - Republican Party (Trump)
2020 Presidential Elections Results (%) - Other
Ancestries Reported - Arab (%)
Ancestries Reported - Czech (%)
Ancestries Reported - Danish (%)
Ancestries Reported - Dutch (%)
Ancestries Reported - English (%)
Ancestries Reported - French (%)
Ancestries Reported - French Canadian (%)
Ancestries Reported - German (%)
Ancestries Reported - Greek (%)
Ancestries Reported - Hungarian (%)
Ancestries Reported - Irish (%)
Ancestries Reported - Italian (%)
Ancestries Reported - Lithuanian (%)
Ancestries Reported - Norwegian (%)
Ancestries Reported - Polish (%)
Ancestries Reported - Portuguese (%)
Ancestries Reported - Russian (%)
Ancestries Reported - Scotch-Irish (%)
Ancestries Reported - Scottish (%)
Ancestries Reported - Slovak (%)
Ancestries Reported - Subsaharan African (%)
Ancestries Reported - Swedish (%)
Ancestries Reported - Swiss (%)
Ancestries Reported - Ukrainian (%)
Ancestries Reported - United States (%)
Ancestries Reported - Welsh (%)
Ancestries Reported - West Indian (%)
Ancestries Reported - Other (%)
Educational Attainment - No schooling completed (%)
Educational Attainment - Less than high school (%)
Educational Attainment - High school or equivalent (%)
Educational Attainment - Less than 1 year of college (%)
Educational Attainment - 1 or more years of college (%)
Educational Attainment - Associate degree (%)
Educational Attainment - Bachelor's degree (%)
Educational Attainment - Master's degree (%)
Educational Attainment - Professional school degree (%)
Educational Attainment - Doctorate degree (%)
School Enrollment - Nursery, preschool (%)
School Enrollment - Kindergarten (%)
School Enrollment - Grade 1 to 4 (%)
School Enrollment - Grade 5 to 8 (%)
School Enrollment - Grade 9 to 12 (%)
School Enrollment - College undergrad (%)
School Enrollment - Graduate or professional (%)
School Enrollment - Not enrolled in school (%)
School enrollment - Public schools (%)
School enrollment - Private schools (%)
School enrollment - Not enrolled (%)
Median number of rooms in houses and condos
Median number of rooms in apartments
Housing units lacking complete plumbing facilities (%)
Housing units lacking complete kitchen facilities (%)
Density of houses
Urban houses (%)
Rural houses (%)
Households with people 60 years and over (%)
Households with people 65 years and over (%)
Households with people 75 years and over (%)
Households with one or more nonrelatives (%)
Households with no nonrelatives (%)
Population in households (%)
Family households (%)
Nonfamily households (%)
Population in families (%)
Family households with own children (%)
Median number of bedrooms in owner occupied houses
Mean number of bedrooms in owner occupied houses
Median number of bedrooms in renter occupied houses
Mean number of bedrooms in renter occupied houses
Median number of vehichles in owner occupied houses
Mean number of vehichles in owner occupied houses
Median number of vehichles in renter occupied houses
Mean number of vehichles in renter occupied houses
Mortgage status - with mortgage (%)
Mortgage status - with second mortgage (%)
Mortgage status - with home equity loan (%)
Mortgage status - with both second mortgage and home equity loan (%)
Mortgage status - without a mortgage (%)
Average family size
Average family size - White
Average family size - Black or African American
Average family size - Asian
Average family size - Hispanic or Latino
Average family size - American Indian and Alaska Native
Average family size - Multirace
Average family size - Other Race
Geographical mobility - Same house 1 year ago (%)
Geographical mobility - Moved within same county (%)
Geographical mobility - Moved from different county within same state (%)
Geographical mobility - Moved from different state (%)
Geographical mobility - Moved from abroad (%)
Place of birth - Born in state of residence (%)
Place of birth - Born in other state (%)
Place of birth - Native, outside of US (%)
Place of birth - Foreign born (%)
Housing units in structures - 1, detached (%)
Housing units in structures - 1, attached (%)
Housing units in structures - 2 (%)
Housing units in structures - 3 or 4 (%)
Housing units in structures - 5 to 9 (%)
Housing units in structures - 10 to 19 (%)
Housing units in structures - 20 to 49 (%)
Housing units in structures - 50 or more (%)
Housing units in structures - Mobile home (%)
Housing units in structures - Boat, RV, van, etc. (%)
House/condo owner moved in on average (years ago)
Renter moved in on average (years ago)
Year householder moved into unit - Moved in 1999 to March 2000 (%)
Year householder moved into unit - Moved in 1995 to 1998 (%)
Year householder moved into unit - Moved in 1990 to 1994 (%)
Year householder moved into unit - Moved in 1980 to 1989 (%)
Year householder moved into unit - Moved in 1970 to 1979 (%)
Year householder moved into unit - Moved in 1969 or earlier (%)
Means of transportation to work - Drove car alone (%)
Means of transportation to work - Carpooled (%)
Means of transportation to work - Public transportation (%)
Means of transportation to work - Bus or trolley bus (%)
Means of transportation to work - Streetcar or trolley car (%)
Means of transportation to work - Subway or elevated (%)
Means of transportation to work - Railroad (%)
Means of transportation to work - Ferryboat (%)
Means of transportation to work - Taxicab (%)
Means of transportation to work - Motorcycle (%)
Means of transportation to work - Bicycle (%)
Means of transportation to work - Walked (%)
Means of transportation to work - Other means (%)
Working at home (%)
Industry diversity
Most Common Industries - Agriculture, forestry, fishing and hunting, and mining (%)
Most Common Industries - Agriculture, forestry, fishing and hunting (%)
Most Common Industries - Mining, quarrying, and oil and gas extraction (%)
Most Common Industries - Construction (%)
Most Common Industries - Manufacturing (%)
Most Common Industries - Wholesale trade (%)
Most Common Industries - Retail trade (%)
Most Common Industries - Transportation and warehousing, and utilities (%)
Most Common Industries - Transportation and warehousing (%)
Most Common Industries - Utilities (%)
Most Common Industries - Information (%)
Most Common Industries - Finance and insurance, and real estate and rental and leasing (%)
Most Common Industries - Finance and insurance (%)
Most Common Industries - Real estate and rental and leasing (%)
Most Common Industries - Professional, scientific, and management, and administrative and waste management services (%)
Most Common Industries - Professional, scientific, and technical services (%)
Most Common Industries - Management of companies and enterprises (%)
Most Common Industries - Administrative and support and waste management services (%)
Most Common Industries - Educational services, and health care and social assistance (%)
Most Common Industries - Educational services (%)
Most Common Industries - Health care and social assistance (%)
Most Common Industries - Arts, entertainment, and recreation, and accommodation and food services (%)
Most Common Industries - Arts, entertainment, and recreation (%)
Most Common Industries - Accommodation and food services (%)
Most Common Industries - Other services, except public administration (%)
Most Common Industries - Public administration (%)
Occupation diversity
Most Common Occupations - Management, business, science, and arts occupations (%)
Most Common Occupations - Management, business, and financial occupations (%)
Most Common Occupations - Management occupations (%)
Most Common Occupations - Business and financial operations occupations (%)
Most Common Occupations - Computer, engineering, and science occupations (%)
Most Common Occupations - Computer and mathematical occupations (%)
Most Common Occupations - Architecture and engineering occupations (%)
Most Common Occupations - Life, physical, and social science occupations (%)
Most Common Occupations - Education, legal, community service, arts, and media occupations (%)
Most Common Occupations - Community and social service occupations (%)
Most Common Occupations - Legal occupations (%)
Most Common Occupations - Education, training, and library occupations (%)
Most Common Occupations - Arts, design, entertainment, sports, and media occupations (%)
Most Common Occupations - Healthcare practitioners and technical occupations (%)
Most Common Occupations - Health diagnosing and treating practitioners and other technical occupations (%)
Most Common Occupations - Health technologists and technicians (%)
Most Common Occupations - Service occupations (%)
Most Common Occupations - Healthcare support occupations (%)
Most Common Occupations - Protective service occupations (%)
Most Common Occupations - Fire fighting and prevention, and other protective service workers including supervisors (%)
Most Common Occupations - Law enforcement workers including supervisors (%)
Most Common Occupations - Food preparation and serving related occupations (%)
Most Common Occupations - Building and grounds cleaning and maintenance occupations (%)
Most Common Occupations - Personal care and service occupations (%)
Most Common Occupations - Sales and office occupations (%)
Most Common Occupations - Sales and related occupations (%)
Most Common Occupations - Office and administrative support occupations (%)
Most Common Occupations - Natural resources, construction, and maintenance occupations (%)
Most Common Occupations - Farming, fishing, and forestry occupations (%)
Most Common Occupations - Construction and extraction occupations (%)
Most Common Occupations - Installation, maintenance, and repair occupations (%)
Most Common Occupations - Production, transportation, and material moving occupations (%)
Most Common Occupations - Production occupations (%)
Most Common Occupations - Transportation occupations (%)
Most Common Occupations - Material moving occupations (%)
People in Group quarters - Institutionalized population (%)
People in Group quarters - Correctional institutions (%)
People in Group quarters - Federal prisons and detention centers (%)
People in Group quarters - Halfway houses (%)
People in Group quarters - Local jails and other confinement facilities (including police lockups) (%)
People in Group quarters - Military disciplinary barracks (%)
People in Group quarters - State prisons (%)
People in Group quarters - Other types of correctional institutions (%)
People in Group quarters - Nursing homes (%)
People in Group quarters - Hospitals/wards, hospices, and schools for the handicapped (%)
People in Group quarters - Hospitals/wards and hospices for chronically ill (%)
People in Group quarters - Hospices or homes for chronically ill (%)
People in Group quarters - Military hospitals or wards for chronically ill (%)
People in Group quarters - Other hospitals or wards for chronically ill (%)
People in Group quarters - Hospitals or wards for drug/alcohol abuse (%)
People in Group quarters - Mental (Psychiatric) hospitals or wards (%)
People in Group quarters - Schools, hospitals, or wards for the mentally retarded (%)
People in Group quarters - Schools, hospitals, or wards for the physically handicapped (%)
People in Group quarters - Institutions for the deaf (%)
People in Group quarters - Institutions for the blind (%)
People in Group quarters - Orthopedic wards and institutions for the physically handicapped (%)
People in Group quarters - Wards in general hospitals for patients who have no usual home elsewhere (%)
People in Group quarters - Wards in military hospitals for patients who have no usual home elsewhere (%)
People in Group quarters - Juvenile institutions (%)
People in Group quarters - Long-term care (%)
People in Group quarters - Homes for abused, dependent, and neglected children (%)
People in Group quarters - Residential treatment centers for emotionally disturbed children (%)
People in Group quarters - Training schools for juvenile delinquents (%)
People in Group quarters - Short-term care, detention or diagnostic centers for delinquent children (%)
People in Group quarters - Type of juvenile institution unknown (%)
People in Group quarters - Noninstitutionalized population (%)
People in Group quarters - College dormitories (includes college quarters off campus) (%)
People in Group quarters - Military quarters (%)
People in Group quarters - On base (%)
People in Group quarters - Barracks, unaccompanied personnel housing (UPH), (Enlisted/Officer), ;and similar group living quarters for military personnel (%)
People in Group quarters - Transient quarters for temporary residents (%)
People in Group quarters - Military ships (%)
People in Group quarters - Group homes (%)
People in Group quarters - Homes or halfway houses for drug/alcohol abuse (%)
People in Group quarters - Homes for the mentally ill (%)
People in Group quarters - Homes for the mentally retarded (%)
People in Group quarters - Homes for the physically handicapped (%)
People in Group quarters - Other group homes (%)
People in Group quarters - Religious group quarters (%)
People in Group quarters - Dormitories (%)
People in Group quarters - Agriculture workers' dormitories on farms (%)
People in Group quarters - Job Corps and vocational training facilities (%)
People in Group quarters - Other workers' dormitories (%)
People in Group quarters - Crews of maritime vessels (%)
People in Group quarters - Other nonhousehold living situations (%)
People in Group quarters - Other noninstitutional group quarters (%)
Residents speaking English at home (%)
Residents speaking English at home - Born in the United States (%)
Residents speaking English at home - Native, born elsewhere (%)
Residents speaking English at home - Foreign born (%)
Residents speaking Spanish at home (%)
Residents speaking Spanish at home - Born in the United States (%)
Residents speaking Spanish at home - Native, born elsewhere (%)
Residents speaking Spanish at home - Foreign born (%)
Residents speaking other language at home (%)
Residents speaking other language at home - Born in the United States (%)
Residents speaking other language at home - Native, born elsewhere (%)
Residents speaking other language at home - Foreign born (%)
Class of Workers - Employee of private company (%)
Class of Workers - Self-employed in own incorporated business (%)
Class of Workers - Private not-for-profit wage and salary workers (%)
Class of Workers - Local government workers (%)
Class of Workers - State government workers (%)
Class of Workers - Federal government workers (%)
Class of Workers - Self-employed workers in own not incorporated business and Unpaid family workers (%)
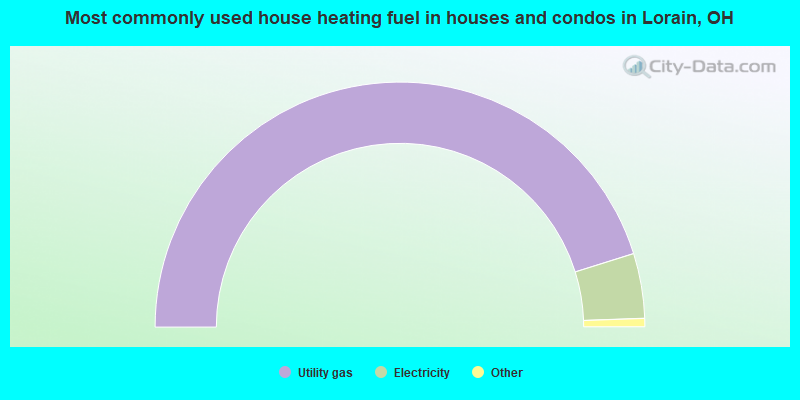
House heating fuel used in houses and condos - Utility gas (%)
House heating fuel used in houses and condos - Bottled, tank, or LP gas (%)
House heating fuel used in houses and condos - Electricity (%)
House heating fuel used in houses and condos - Fuel oil, kerosene, etc. (%)
House heating fuel used in houses and condos - Coal or coke (%)
House heating fuel used in houses and condos - Wood (%)
House heating fuel used in houses and condos - Solar energy (%)
House heating fuel used in houses and condos - Other fuel (%)
House heating fuel used in houses and condos - No fuel used (%)
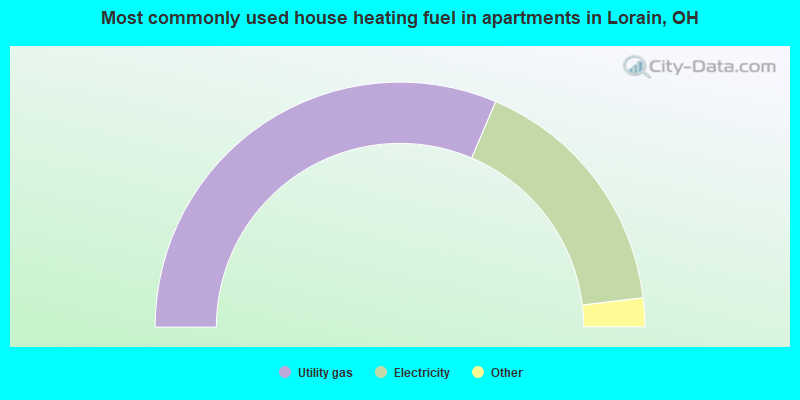
House heating fuel used in apartments - Utility gas (%)
House heating fuel used in apartments - Bottled, tank, or LP gas (%)
House heating fuel used in apartments - Electricity (%)
House heating fuel used in apartments - Fuel oil, kerosene, etc. (%)
House heating fuel used in apartments - Coal or coke (%)
House heating fuel used in apartments - Wood (%)
House heating fuel used in apartments - Solar energy (%)
House heating fuel used in apartments - Other fuel (%)
House heating fuel used in apartments - No fuel used (%)
Armed forces status - In Armed Forces (%)
Armed forces status - Civilian (%)
Armed forces status - Civilian - Veteran (%)
Armed forces status - Civilian - Nonveteran (%)
Fatal accidents locations in years 2005-2021
Fatal accidents locations in 2005
Fatal accidents locations in 2006
Fatal accidents locations in 2007
Fatal accidents locations in 2008
Fatal accidents locations in 2009
Fatal accidents locations in 2010
Fatal accidents locations in 2011
Fatal accidents locations in 2012
Fatal accidents locations in 2013
Fatal accidents locations in 2014
Fatal accidents locations in 2015
Fatal accidents locations in 2016
Fatal accidents locations in 2017
Fatal accidents locations in 2018
Fatal accidents locations in 2019
Fatal accidents locations in 2020
Fatal accidents locations in 2021
Alcohol use - People drinking some alcohol every month (%)
Alcohol use - People not drinking at all (%)
Alcohol use - Average days/month drinking alcohol
Alcohol use - Average drinks/week
Alcohol use - Average days/year people drink much
Audiometry - Average condition of hearing (%)
Audiometry - People that can hear a whisper from across a quiet room (%)
Audiometry - People that can hear normal voice from across a quiet room (%)
Audiometry - Ears ringing, roaring, buzzing (%)
Audiometry - Had a job exposure to loud noise (%)
Audiometry - Had off-work exposure to loud noise (%)
Blood Pressure & Cholesterol - Has high blood pressure (%)
Blood Pressure & Cholesterol - Checking blood pressure at home (%)
Blood Pressure & Cholesterol - Frequently checking blood cholesterol (%)
Blood Pressure & Cholesterol - Has high cholesterol level (%)
Consumer Behavior - Money monthly spent on food at supermarket/grocery store
Consumer Behavior - Money monthly spent on food at other stores
Consumer Behavior - Money monthly spent on eating out
Consumer Behavior - Money monthly spent on carryout/delivered foods
Consumer Behavior - Income spent on food at supermarket/grocery store (%)
Consumer Behavior - Income spent on food at other stores (%)
Consumer Behavior - Income spent on eating out (%)
Consumer Behavior - Income spent on carryout/delivered foods (%)
Current Health Status - General health condition (%)
Current Health Status - Blood donors (%)
Current Health Status - Has blood ever tested for HIV virus (%)
Current Health Status - Left-handed people (%)
Dermatology - People using sunscreen (%)
Diabetes - Diabetics (%)
Diabetes - Had a blood test for high blood sugar (%)
Diabetes - People taking insulin (%)
Diet Behavior & Nutrition - Diet health (%)
Diet Behavior & Nutrition - Milk product consumption (# of products/month)
Diet Behavior & Nutrition - Meals not home prepared (#/week)
Diet Behavior & Nutrition - Meals from fast food or pizza place (#/week)
Diet Behavior & Nutrition - Ready-to-eat foods (#/month)
Diet Behavior & Nutrition - Frozen meals/pizza (#/month)
Drug Use - People that ever used marijuana or hashish (%)
Drug Use - Ever used hard drugs (%)
Drug Use - Ever used any form of cocaine (%)
Drug Use - Ever used heroin (%)
Drug Use - Ever used methamphetamine (%)
Health Insurance - People covered by health insurance (%)
Kidney Conditions-Urology - Avg. # of times urinating at night
Medical Conditions - People with asthma (%)
Medical Conditions - People with anemia (%)
Medical Conditions - People with psoriasis (%)
Medical Conditions - People with overweight (%)
Medical Conditions - Elderly people having difficulties in thinking or remembering (%)
Medical Conditions - People who ever received blood transfusion (%)
Medical Conditions - People having trouble seeing even with glass/contacts (%)
Medical Conditions - People with arthritis (%)
Medical Conditions - People with gout (%)
Medical Conditions - People with congestive heart failure (%)
Medical Conditions - People with coronary heart disease (%)
Medical Conditions - People with angina pectoris (%)
Medical Conditions - People who ever had heart attack (%)
Medical Conditions - People who ever had stroke (%)
Medical Conditions - People with emphysema (%)
Medical Conditions - People with thyroid problem (%)
Medical Conditions - People with chronic bronchitis (%)
Medical Conditions - People with any liver condition (%)
Medical Conditions - People who ever had cancer or malignancy (%)
Mental Health - People who have little interest in doing things (%)
Mental Health - People feeling down, depressed, or hopeless (%)
Mental Health - People who have trouble sleeping or sleeping too much (%)
Mental Health - People feeling tired or having little energy (%)
Mental Health - People with poor appetite or overeating (%)
Mental Health - People feeling bad about themself (%)
Mental Health - People who have trouble concentrating on things (%)
Mental Health - People moving or speaking slowly or too fast (%)
Mental Health - People having thoughts they would be better off dead (%)
Oral Health - Average years since last visit a dentist
Oral Health - People embarrassed because of mouth (%)
Oral Health - People with gum disease (%)
Oral Health - General health of teeth and gums (%)
Oral Health - Average days a week using dental floss/device
Oral Health - Average days a week using mouthwash for dental problem
Oral Health - Average number of teeth
Pesticide Use - Households using pesticides to control insects (%)
Pesticide Use - Households using pesticides to kill weeds (%)
Physical Activity - People doing vigorous-intensity work activities (%)
Physical Activity - People doing moderate-intensity work activities (%)
Physical Activity - People walking or bicycling (%)
Physical Activity - People doing vigorous-intensity recreational activities (%)
Physical Activity - People doing moderate-intensity recreational activities (%)
Physical Activity - Average hours a day doing sedentary activities
Physical Activity - Average hours a day watching TV or videos
Physical Activity - Average hours a day using computer
Physical Functioning - People having limitations keeping them from working (%)
Physical Functioning - People limited in amount of work they can do (%)
Physical Functioning - People that need special equipment to walk (%)
Physical Functioning - People experiencing confusion/memory problems (%)
Physical Functioning - People requiring special healthcare equipment (%)
Prescription Medications - Average number of prescription medicines taking
Preventive Aspirin Use - Adults 40+ taking low-dose aspirin (%)
Reproductive Health - Vaginal deliveries (%)
Reproductive Health - Cesarean deliveries (%)
Reproductive Health - Deliveries resulted in a live birth (%)
Reproductive Health - Pregnancies resulted in a delivery (%)
Reproductive Health - Women breastfeeding newborns (%)
Reproductive Health - Women that had a hysterectomy (%)
Reproductive Health - Women that had both ovaries removed (%)
Reproductive Health - Women that have ever taken birth control pills (%)
Reproductive Health - Women taking birth control pills (%)
Reproductive Health - Women that have ever used Depo-Provera or injectables (%)
Reproductive Health - Women that have ever used female hormones (%)
Sexual Behavior - People 18+ that ever had sex (vaginal, anal, or oral) (%)
Sexual Behavior - Males 18+ that ever had vaginal sex with a woman (%)
Sexual Behavior - Males 18+ that ever performed oral sex on a woman (%)
Sexual Behavior - Males 18+ that ever had anal sex with a woman (%)
Sexual Behavior - Males 18+ that ever had any sex with a man (%)
Sexual Behavior - Females 18+ that ever had vaginal sex with a man (%)
Sexual Behavior - Females 18+ that ever performed oral sex on a man (%)
Sexual Behavior - Females 18+ that ever had anal sex with a man (%)
Sexual Behavior - Females 18+ that ever had any kind of sex with a woman (%)
Sexual Behavior - Average age people first had sex
Sexual Behavior - Average number of female sex partners in lifetime (males 18+)
Sexual Behavior - Average number of female vaginal sex partners in lifetime (males 18+)
Sexual Behavior - Average age people first performed oral sex on a woman (18+)
Sexual Behavior - Average number of woman performed oral sex on in lifetime (18+)
Sexual Behavior - Average number of male sex partners in lifetime (males 18+)
Sexual Behavior - Average number of male anal sex partners in lifetime (males 18+)
Sexual Behavior - Average age people first performed oral sex on a man (18+)
Sexual Behavior - Average number of male oral sex partners in lifetime (18+)
Sexual Behavior - People using protection when performing oral sex (%)
Sexual Behavior - Average number of times people have vaginal or anal sex a year
Sexual Behavior - People having sex without condom (%)
Sexual Behavior - Average number of male sex partners in lifetime (females 18+)
Sexual Behavior - Average number of male vaginal sex partners in lifetime (females 18+)
Sexual Behavior - Average number of female sex partners in lifetime (females 18+)
Sexual Behavior - Circumcised males 18+ (%)
Sleep Disorders - Average hours sleeping at night
Sleep Disorders - People that has trouble sleeping (%)
Smoking-Cigarette Use - People smoking cigarettes (%)
Taste & Smell - People 40+ having problems with smell (%)
Taste & Smell - People 40+ having problems with taste (%)
Taste & Smell - People 40+ that ever had wisdom teeth removed (%)
Taste & Smell - People 40+ that ever had tonsils teeth removed (%)
Taste & Smell - People 40+ that ever had a loss of consciousness because of a head injury (%)
Taste & Smell - People 40+ that ever had a broken nose or other serious injury to face or skull (%)
Taste & Smell - People 40+ that ever had two or more sinus infections (%)
Weight - Average height (inches)
Weight - Average weight (pounds)
Weight - Average BMI
Weight - People that are obese (%)
Weight - People that ever were obese (%)
Weight - People trying to lose weight (%)
The City-Data.com crime index weighs serious crimes and violent crimes more heavily. Higher means more crime, U.S. average is 246.1. It adjusts for the number of visitors and daily workers commuting into cities.
- means the value is smaller than the state average.
- means the value is about the same as the state average.
- means the value is bigger than the state average.
- means the value is much bigger than the state average.
Crime rate in Lorain detailed stats: murders, rapes, robberies, assaults, burglaries, thefts, arson Officers per 1,000 residents here:
1.52Ohio average:
2.01
Latest news from Lorain, OH collected exclusively by city-data.com from local newspapers, TV, and radio stations
Ancestries: American (9.3%), German (6.9%), Polish (3.7%), Irish (3.7%), Italian (3.0%), English (2.7%).
Current Local Time:
Land area: 24.0 square miles.
Population density: 2,722 people per square mile (average).
1,789 residents are foreign born (1.2% Latin America , 0.8% Europe , 0.5% Asia ).
Median real estate property taxes paid for housing units with mortgages in 2022: $1,749 (1.2%)Median real estate property taxes paid for housing units with no mortgage in 2022: $1,200 (1.1%)
Nearest city with pop. 200,000+: Cleveland, OH
Nearest city with pop. 1,000,000+: Chicago, IL
Nearest cities:
Latitude: 41.45 N, Longitude: 82.17 W
Daytime population change due to commuting: -12,763 (-19.5%)Workers who live and work in this city: 9,195 (32.8%)
Single-family new house construction building permits:
2022: 96 buildings , average cost: $171,8002021: 119 buildings , average cost: $155,4002020: 132 buildings , average cost: $126,7002019: 87 buildings , average cost: $120,2002018: 108 buildings , average cost: $130,8002017: 96 buildings , average cost: $125,4002016: 81 buildings , average cost: $122,6002015: 127 buildings , average cost: $100,3002014: 72 buildings , average cost: $103,5002013: 64 buildings , average cost: $86,5002012: 53 buildings , average cost: $90,9002011: 31 buildings , average cost: $91,4002010: 42 buildings , average cost: $93,0002009: 57 buildings , average cost: $85,6002008: 77 buildings , average cost: $94,9002007: 118 buildings , average cost: $103,7002006: 122 buildings , average cost: $118,8002005: 150 buildings , average cost: $116,8002004: 180 buildings , average cost: $105,6002003: 148 buildings , average cost: $118,2002002: 202 buildings , average cost: $111,1002001: 138 buildings , average cost: $110,5002000: 85 buildings , average cost: $100,6001999: 92 buildings , average cost: $118,9001998: 108 buildings , average cost: $163,1001997: 90 buildings , average cost: $135,000Unemployment in December 2023:
Most common occupations in Lorain, OH (%)
Both Males Females
Other production occupations, including supervisors (6.3%)
Assemblers and fabricators (5.9%)
Metal workers and plastic workers (5.3%)
Building and grounds cleaning and maintenance occupations (4.1%)
Material recording, scheduling, dispatching, and distributing workers (4.0%)
Secretaries and administrative assistants (3.3%)
Cashiers (3.1%)
Metal workers and plastic workers (8.3%)
Other production occupations, including supervisors (8.3%)
Assemblers and fabricators (7.0%)
Electrical equipment mechanics and other installation, maintenance, and repair workers, including supervisors (5.3%)
Material recording, scheduling, dispatching, and distributing workers (5.0%)
Building and grounds cleaning and maintenance occupations (4.3%)
Driver/sales workers and truck drivers (4.2%)
Secretaries and administrative assistants (6.5%)
Cashiers (5.2%)
Assemblers and fabricators (4.7%)
Other office and administrative support workers, including supervisors (4.5%)
Other production occupations, including supervisors (4.3%)
Building and grounds cleaning and maintenance occupations (4.0%)
Nursing, psychiatric, and home health aides (4.0%)
Tornado activity:
Lorain-area historical tornado activity is slightly below Ohio state average. It is 2% greater than the overall U.S. average.
On 4/11/1965, a category F4 (max. wind speeds 207-260 mph) tornado 15.7 miles away from the Lorain city center killed 18 people and injured 200 people and caused between $5,000,000 and $50,000,000 in damages.
On 6/8/1953, a category F4 tornado 23.5 miles away from the city center killed 17 people and injured 379 people .
Earthquake activity:
Lorain-area historical earthquake activity is significantly above Ohio state average. It is 45% smaller than the overall U.S. average. On 9/25/1998 at 19:52:52, a magnitude 5.2 (4.8 MB, 4.3 MS, 5.2 LG, 4.5 MW, Depth: 3.1 mi, Class: Moderate, Intensity: VI - VII) earthquake occurred 91.9 miles away from Lorain center On 1/31/1986 at 16:46:43, a magnitude 5.0 (5.0 MB) earthquake occurred 53.3 miles away from the city center On 8/23/2011 at 17:51:04, a magnitude 5.8 (5.8 MW, Depth: 3.7 mi) earthquake occurred 332.6 miles away from the city center On 7/27/1980 at 18:52:21, a magnitude 5.2 (5.1 MB, 4.7 MS, 5.0 UK, 5.2 UK) earthquake occurred 243.3 miles away from Lorain center On 7/12/1986 at 08:19:37, a magnitude 4.5 (4.5 MB, Class: Light, Intensity: IV - V) earthquake occurred 131.1 miles away from Lorain center On 6/10/2019 at 14:50:45, a magnitude 4.0 (4.0 MB, Depth: 1.2 mi) earthquake occurred 40.2 miles away from Lorain center Magnitude types: regional Lg-wave magnitude (LG), body-wave magnitude (MB), surface-wave magnitude (MS), moment magnitude (MW) Natural disasters: The number of natural disasters in Lorain County (16) is near the US average (15).Major Disasters (Presidential) Declared: 11Emergencies Declared: 4Storms: 9, Floods: 8, Tornadoes: 4, Snowstorms: 2, Blizzard: 1, Hurricane: 1, Mudslide: 1, Power Outage: 1, Tropical Storm: 1, Winter Storm: 1, Other: 1 (Note: some incidents may be assigned to more than one category). Main business address for: LNB BANCORP INC STATE COMMERCIAL BANKS ).
Hospitals in Lorain: COMMUNITY HEALTH PARTN HOSP OF ST JOS (3700 KOLBE ROAD) ECHOING LAKE / ROWLAND HOME (3295 LEAVITT ROAD) MEISTER ROAD HOME (4609 MEISTER ROAD) MERCY REGIONAL MEDICAL CENTER (Voluntary non-profit - Private, provides emergency services, 3700 KOLBE ROAD) SURGERY CENTER LORAIN (4804 LEAVITT ROAD) Nursing Homes in Lorain: ANCHOR LODGE NURSING HOME INC (3756 W ERIE AVE) AUTUMN AEGIS NURSING HOME (1130 TOWER BLVD) COMMUNITY HEALTH PARTNERS SNF (3700 KOLBE RD) LAKE POINTE HEALTH CARE (3364 KOLBE RD) LORAIN MANOR NURSING HOME (1882 E 32 ST) OAK HILLS NURSING CENTER (3650 BEAVERCREST DRIVE) OHIO EXTENDED CARE CENTER (3364 KOLBE RD) Dialysis Facilities in Lorain: DAVITA - AMHERST DIALYSIS (3200 COOPER FOSTER PARK RD. W.) Amtrak station near Lorain: 7 miles: ELYRIA (410 E. RIVER RD.) Services: partially wheelchair accessible, enclosed waiting area, public restrooms, public payphones, free short-term parking, free long-term parking, call for taxi service, public transit connection.
College/University in Lorain: Northern Institute of Cosmetology Full-time enrollment: 35; Location: 669 Broadway; Private, for-profit; Website: www.nicosmetology.com)
Colleges/universities with over 2000 students nearest to Lorain:
Lorain County Community College (about 6 miles; Elyria, OH ; Full-time enrollment: 7,690)
Oberlin College (about 11 miles; Oberlin, OH ; FT enrollment: 2,795)
Baldwin Wallace University (about 18 miles; Berea, OH ; FT enrollment: 3,699)
Cleveland State University (about 26 miles; Cleveland, OH ; FT enrollment: 14,161)
Cuyahoga Community College District (about 27 miles; Cleveland, OH ; FT enrollment: 20,271)
Case Western Reserve University (about 30 miles; Cleveland, OH ; FT enrollment: 7,034)
John Carroll University (about 34 miles; University Heights, OH ; FT enrollment: 3,546)
Public high schools in Lorain: CLEARVIEW HIGH SCHOOL Students: 591, Location: 4700 BROADWAY, Grades: 9-12)DURLING MIDDLE SCHOOL Students: 505, Location: 100 N RIDGE RD W, Grades: 4-9)SUMMIT ACADEMY SECONDARY - LORAIN Students: 61, Location: 1051 E ST, Grades: 9-12, Charter school )LORAIN K-12 DIGITAL ACADEMY Location: 1800 WEST 40TH STREET, Grades: KG-12, Charter school )
HORIZON SCIENCE ACADEMY LORAIN Location: 760 TOWER BLVD, Grades: KG-11, Charter school )
LORAIN HIGH SCHOOL Location: 2600 ASHLAND AVE, Grades: 9-12)
CREDIT RECOVERY ACADEMY Location: 2321 FAIRLESS DR, Grades: 9-12)
NEW BEGINNINGS Location: 3200 CLINTON AVE, Grades: 6-12)
Biggest public elementary/middle schools in Lorain: VINCENT ELEMENTARY SCHOOL Students: 559, Location: 2303 N RIDGE RD E, Grades: PK-5)GENERAL JOHNNIE WILSON MIDDLE SCHOOL Students: 516, Location: 2700 WASHINGTON AVE, Grades: 7-8)LONGFELLOW MIDDLE SCHOOL Students: 444, Location: 305 LOUISIANA AVE, Grades: 7-8)LARKMOOR ELEMENTARY SCHOOL Students: 442, Location: 1201 NEBRASKA, Grades: PK-6)WASHINGTON ELEMENTARY SCHOOL Students: 374, Location: 1025 W 23RD ST, Grades: KG-6)PALM ELEMENTARY SCHOOL Students: 300, Location: 2319 E 34TH ST, Grades: KG-6)FRANK JACINTO ELEMENTARY Students: 291, Location: 2515 MARSHALL AVE, Grades: PK-6)ACADEMY OF ARTS AND SCIENCES Students: 126, Location: 3038 LEAVITT RD, Grades: KG-1, Charter school )SUMMIT ACADEMY MIDDLE SCHOOL - LORAIN Students: 78, Location: 346 ILLINOIS AVE, Grades: 6-8, Charter school )LORAIN PREPARATORY ACADEMY Students: 30, Location: 4125 LEAVITT RD BLDG 2, Grades: 2-8, Charter school )Private elementary/middle schools in Lorain: ST PETER SCHOOL Students: 415, Location: 3601 OBERLIN AVE, Grades: PK-8)
ST ANTHONY OF PADUA SCHOOL Students: 260, Location: 1339 E ERIE AVE, Grades: PK-8)
See full list of schools located in Lorain Library in Lorain: LORAIN PUBLIC LIBRARY Operating income: $9,849,375; Location: 351 W. SIXTH ST.; 665,492 books ; 15,978 e-books ; 69,680 audio materials ; 97,391 video materials ; 13 local licensed databases ; 266 state licensed databases ; 86 other licensed databases ; 1,384 print serial subscriptions ; 469 electronic serial subscriptions )
User-submitted facts and corrections:
Fishing Charters are available at Spitzers Marina
lorain catholic high closed at the end of the 2003-2004 school year
NOTABLE LOCATIONS IN LORAIN: HarborWalk housing development on the Black River. 440-288-8611
lorain catholic high closed at the end of the 2003-2004 school year
Helen Steiner Rice (author/poet) was born in Lorain, Ohio on May 19, 1900.
helen steiner rice was not listed as a famous person born in lorain.
Notable locations in Lorain: (A) , Pearl Avenue Industrial Park (B) , Hot Waters Marina (C) , Lorain Yacht Club (D) , Emerald Valley Golf Course (E) , West Park Industrial Park (F) , Copper Kettle Marina (G) , Beaver Park Marina (H) , Lorain Industrial Park (I) , Coppers Kettle Marina (J) , Beaver Creek Boat Club (K) , Lorain Country Club (L) , Lifecare Ambulance Service Station 2 (M) , Lorain Public Library (N) , Palace Civic Center (O) , Lorain Fire Department Station 3 (P) , Lorain Fire Department Station 4 (Q) , Lorain Fire Department Station 7 (R) , Nativity Manor (S) , Lorain City Hall (T) . Display/hide their locations on the map
Shopping Centers: (1) , Lorain Plaza Shopping Center (2) , Westgate Shopping Center (3) . Display/hide their locations on the map
Main business address in Lorain: (A) . Display/hide its location on the map
Churches in Lorain include: (A) , Christ United Methodist Church (B) , New Morning Star Primitive Baptist Church (C) , Northminster Presbyterian Church (D) , First Baptist Church (E) , Foursquare Gospel Church (F) , Zion Lutheran Church (G) , Lord of Life Lutheran Church (H) , Saint Nicholas Greek Orthodox Church (I) . Display/hide their locations on the map
Cemeteries: (1) , Elmwood Cemetery (2) , Claus Family Cemetery (3) . Display/hide their locations on the map
Streams, rivers, and creeks: (A) , Black River (B) . Display/hide their locations on the map
Parks in Lorain include: (1) , Central Park (2) , Bartish Park (3) , Hoy-Lo-Mae Park (4) , Kennedy Park (5) , Kneirim Park (6) , Columbus Park (7) , Elmwood Park (8) , Sunny Acres Park (9) . Display/hide their locations on the map
Tourist attractions: (1) , Futuretronics Pinball (Amusement & Theme Parks; 20555 North Ridge Road) (2) , Dreams Bingo (4519 Ashland Avenue SuiteB) (3) , Footprint Tours Inc (Tours & Charters; 209 West 6th Street Suite 12) (4) . Display/hide their approximate locations on the map
Hotels: (1) , Holiday Inn Elyria-Lorain (1825 Lorain Boulevard) (2) . Display/hide their approximate locations on the map
Court: (1) . Display/hide its approximate location on the map
Birthplace of: Ernest King - Navy admiral, Theodore Roy Golubic - Artist, Toni Morrison - (born 1931), black author, Nobel Prize for Literature, Beloved, Alex Daniels - Football player, Bruce Weigl - Poet, Charles J. Berry - Marine Corps Medal of Honor recipient, Don Novello - Comedian, Mary Lawrence (actor) - Actor Television and film actress, Paul Kromer - Football player, Ray Lawrence (record producer) - Record producer.
Lorain County has a predicted average indoor radon screening level between 2 and 4 pCi/L (pico curies per liter) - Moderate Potential Drinking water stations with addresses in Lorain and their reported violations in the past:
ELYRIA WATER DEPARTMENT (Population served: 68,000, Surface water):
Past health violations:
Treatment Technique (SWTR and GWR) - In DEC-2011. Follow-up actions: St Public Notif requested (DEC-29-2011), St Violation/Reminder Notice (DEC-29-2011), St Public Notif received (JAN-05-2012), St Compliance achieved (JAN-31-2012)
Past monitoring violations:
Monitoring of Treatment (SWTR-Filter) - In FEB-2012. Follow-up actions: St Compliance achieved (MAR-31-2012), St Public Notif requested (APR-06-2012), St Violation/Reminder Notice (APR-06-2012)
Average household size: This city:
2.5 peopleOhio:
2.4 people
Percentage of family households: This city:
64.1%Whole state:
65.0%
Percentage of households with unmarried partners: This city:
8.6%Whole state:
6.8%
Likely homosexual households (counted as self-reported same-sex unmarried-partner households)
Lesbian couples: 0.3% of all households Gay men: 0.2% of all households
People in group quarters in Lorain in 2010:
423 people in nursing facilities/skilled-nursing facilities
81 people in group homes intended for adults
76 people in emergency and transitional shelters (with sleeping facilities) for people experiencing homelessness
61 people in other noninstitutional facilities
11 people in in-patient hospice facilities
10 people in local jails and other municipal confinement facilities
People in group quarters in Lorain in 2000:
499 people in nursing homes
139 people in other noninstitutional group quarters
23 people in homes for the mentally retarded
17 people in other types of correctional institutions
11 people in religious group quarters
10 people in homes for the mentally ill
7 people in local jails and other confinement facilities (including police lockups)
6 people in hospitals/wards and hospices for chronically ill
6 people in hospices or homes for chronically ill
5 people in homes or halfway houses for drug/alcohol abuse
5 people in other group homes
Banks with most branches in Lorain (2011 data):
The Lorain National Bank: at 457 Broadway, Drive-In Branch, Pearl Avenue Branch, Oberlin Avenue Branch. Info updated 2007/06/05: Bank assets: $1,167.9 mil, Deposits: $993.8 mil, local headquarters , positive income , Commercial Lending Specialization, 21 total offices , Holding Company: Lnb Bancorp Inc.
JPMorgan Chase Bank, National Association: Southview Branch, Midcities Branch, Broadway Branch. Info updated 2011/11/10: Bank assets: $1,811,678.0 mil, Deposits: $1,190,738.0 mil, headquarters in Columbus, OH, positive income , International Specialization, 5577 total offices , Holding Company: Jpmorgan Chase & Co.
U.S. Bank National Association: Lorain Super Walmart Branch at 4380 Leavitt Rd, branch established on 2010/10/01; Lorain-Amherst K-Mart Branch at 5350 Leavitt Road, branch established on 1993/10/25. Info updated 2012/01/30: Bank assets: $330,470.8 mil, Deposits: $236,091.5 mil, headquarters in Cincinnati, OH, positive income , 3121 total offices , Holding Company: U.S. Bancorp
First Federal Savings and Loan Association of Lorain: First Federal Savings And Loan Assoc at 3721 Oberlin Avenue, branch established on 1921/01/01; 2233 East 42nd Street Branch at 2233 East 42nd Street, branch established on 1921/01/01. Info updated 2011/07/21: Bank assets: $488.2 mil, Deposits: $383.5 mil, local headquarters , positive income , Mortgage Lending Specialization, 7 total offices
Fifth Third Bank: Lorain-Downtown at 559 Broadway, branch established on 1889/01/01. Info updated 2009/10/05: Bank assets: $114,540.4 mil, Deposits: $89,689.1 mil, headquarters in Cincinnati, OH, positive income , Commercial Lending Specialization, 1378 total offices , Holding Company: Fifth Third Bancorp
First Place Bank: Sheffield Center Branch at 400 Sheffield Center, branch established on 2009/06/30. Info updated 2011/07/21: Bank assets: $2,754.5 mil, Deposits: $2,219.6 mil, headquarters in Warren, OH, negative income in the last year , Commercial Lending Specialization, 43 total offices
Firstmerit Bank, National Association: Tower Boulevard Branch at 4200 Oberlin Ave, branch established on 1968/08/05. Info updated 2010/05/17: Bank assets: $14,420.6 mil, Deposits: $11,497.6 mil, headquarters in Akron, OH, positive income , Commercial Lending Specialization, 213 total offices , Holding Company: Firstmerit Corporation
KeyBank National Association: Deerfield Village Lorain Branch at 7400 Oak Point Road, branch established on 2009/09/14. Info updated 2008/03/03: Bank assets: $86,198.8 mil, Deposits: $64,214.8 mil, headquarters in Cleveland, OH, positive income , Commercial Lending Specialization, 1067 total offices , Holding Company: Keycorp
Buckeye Community Bank: at 105 Sheffield Center, branch established on 1999/10/12. Info updated 2006/11/03: Bank assets: $144.3 mil, Deposits: $127.0 mil, local headquarters , positive income , Commercial Lending Specialization, 1 total offices , Holding Company: Buckeye Bancshares, Inc.
For population 15 years and over in Lorain:
Never married: 38.0%Now married: 38.5%Separated: 2.8%Widowed: 6.9%Divorced: 13.9% For population 25 years and over in Lorain:
High school or higher: 83.8%Bachelor's degree or higher: 16.4%Graduate or professional degree: 7.3%Unemployed: 6.5%Mean travel time to work (commute): 26.6 minutes
Education Gini index (Inequality in education) Here:
11.3Ohio average:
11.0
Religion statistics for Lorain, OH (based on Lorain County data)
Religion Adherents Congregations Catholic 73,443 27 Evangelical Protestant 34,366 161 Mainline Protestant 20,221 68 Black Protestant 2,321 13 Other 1,610 15 Orthodox 791 7 None 168,604 -
Source: Clifford Grammich, Kirk Hadaway, Richard Houseal, Dale E.Jones, Alexei Krindatch, Richie Stanley and Richard H.Taylor. 2012. 2010 U.S.Religion Census: Religious Congregations & Membership Study. Association of Statisticians of American Religious Bodies. Jones, Dale E., et al. 2002. Congregations and Membership in the United States 2000. Nashville, TN: Glenmary Research Center. Graphs represent county-level data
Food Environment Statistics: Number of grocery stores : 55This county :
1.82 / 10,000 pop.Ohio :
1.89 / 10,000 pop.
Number of supercenters and club stores : 4Here :
0.13 / 10,000 pop.Ohio :
0.13 / 10,000 pop.
Number of convenience stores (no gas) : 36This county :
1.19 / 10,000 pop.Ohio :
1.25 / 10,000 pop.
Number of convenience stores (with gas) : 81This county :
2.68 / 10,000 pop.State :
2.93 / 10,000 pop.
Number of full-service restaurants : 156Here :
5.15 / 10,000 pop.State :
6.25 / 10,000 pop.
Adult diabetes rate : Lorain County :
9.4%Ohio :
10.3%
Adult obesity rate : Lorain County :
29.0%Ohio :
29.1%
Low-income preschool obesity rate : Health and Nutrition: Healthy diet rate : This city:
48.0%State:
50.4%
Average overall health of teeth and gums : People feeling badly about themselves : People not drinking alcohol at all : This city:
12.2%Ohio:
10.4%
Average hours sleeping at night : General health condition : Average condition of hearing : More about Health and Nutrition of Lorain, OH Residents
Local government employment and payroll (March 2022)
Function
Full-time employees
Monthly full-time payroll
Average yearly full-time wage
Part-time employees
Monthly part-time payroll
Police Protection - Officers
106 $736,051 $83,327 0 $0 Firefighters
65 $512,215 $94,563 0 $0 Water Supply
63 $327,446 $62,371 0 $0 Sewerage
49 $251,135 $61,502 0 $0 Judicial and Legal
49 $220,067 $53,894 0 $0 Other and Unallocable
36 $197,388 $65,796 2 $3,587 Streets and Highways
32 $149,314 $55,993 0 $0 Housing and Community Development (Local)
22 $55,823 $30,449 0 $0 Other Government Administration
20 $68,549 $41,129 3 $1,329 Financial Administration
18 $101,107 $67,405 0 $0 Police - Other
10 $46,709 $56,051 14 $16,651 Parks and Recreation
8 $30,889 $46,334 0 $0 Water Transport and Terminals
5 $25,960 $62,304 1 $1,468 Correction
3 $12,097 $48,388 0 $0 Fire - Other
1 $4,331 $51,972 0 $0
Totals for Government
487 $2,739,080 $67,493 20 $23,035
Lorain government finances - Expenditure in 2021 (per resident):
Construction - Sewerage: $7,622,000 ($116.61)
Regular Highways: $6,382,000 ($97.64)Water Utilities: $4,912,000 ($75.15)Sea and Inland Port Facilities: $2,519,000 ($38.54)General Public Buildings: $17,000 ($0.26)Current Operations - Police Protection: $11,166,000 ($170.83)
Sewerage: $8,146,000 ($124.62)Local Fire Protection: $7,106,000 ($108.71)Housing and Community Development: $6,845,000 ($104.72)Water Utilities: $6,496,000 ($99.38)General - Other: $5,257,000 ($80.43)Regular Highways: $3,867,000 ($59.16)Judicial and Legal Services: $2,484,000 ($38.00)Natural Resources - Other: $2,042,000 ($31.24)Financial Administration: $1,415,000 ($21.65)General Public Buildings: $1,295,000 ($19.81)Sea and Inland Port Facilities: $950,000 ($14.53)Central Staff Services: $657,000 ($10.05)Parks and Recreation: $654,000 ($10.01)Health - Other: $308,000 ($4.71)Solid Waste Management: $14,000 ($0.21)General - Interest on Debt: $2,523,000 ($38.60)
Total Salaries and Wages: $31,672,000 ($484.54)
Lorain government finances - Revenue in 2021 (per resident):
Charges - Sewerage: $19,970,000 ($305.52)
Sea and Inland Port Facilities: $200,000 ($3.06)Federal Intergovernmental - Public Welfare: $6,771,000 ($103.59)
Natural Resources: $4,602,000 ($70.40)Housing and Community Development: $3,457,000 ($52.89)General Local Government Support: $1,249,000 ($19.11)Other: $271,000 ($4.15)Highways: $199,000 ($3.04)Local Intergovernmental - Other: $143,000 ($2.19)
Miscellaneous - General Revenue - Other: $9,424,000 ($144.18)
Fines and Forfeits: $1,579,000 ($24.16)Interest Earnings: $743,000 ($11.37)Special Assessments: $124,000 ($1.90)Donations From Private Sources: $6,000 ($0.09)Revenue - Water Utilities: $15,107,000 ($231.12)
State Intergovernmental - Other: $1,454,000 ($22.24)
Highways: $1,093,000 ($16.72)Tax - Individual Income: $25,070,000 ($383.54)
Property: $5,456,000 ($83.47)Public Utilities Sales: $645,000 ($9.87)Other: $275,000 ($4.21)Motor Vehicle License: $258,000 ($3.95)Other Selective Sales: $87,000 ($1.33)Alcoholic Beverage Sales: $24,000 ($0.37)
Lorain government finances - Debt in 2021 (per resident):
Long Term Debt - Beginning Outstanding - Unspecified Public Purpose: $116,690,000 ($1785.21)
Outstanding Unspecified Public Purpose: $114,204,000 ($1747.17)Retired Unspecified Public Purpose: $12,204,000 ($186.71)Issue, Unspecified Public Purpose: $9,718,000 ($148.67)Short Term Debt Outstanding - Beginning: $3,022,000 ($46.23)
End of Fiscal Year: $2,800,000 ($42.84)
Lorain government finances - Cash and Securities in 2021 (per resident):
Other Funds - Cash and Securities: $56,041,000 ($857.35)
5.57% of this county's 2021 resident taxpayers lived in other counties in 2020 ($62,281 average adjusted gross income )
Here:
5.57%Ohio average:
5.68%
0.02% of residents moved from foreign countries ($71 average AGI )Lorain County:
0.02%Ohio average:
0.01%
Top counties from which taxpayers relocated into this county between 2020 and 2021:
4.60% of this county's 2020 resident taxpayers moved to other counties in 2021 ($62,588 average adjusted gross income )
Here:
4.60%Ohio average:
5.79%
0.02% of residents moved to foreign countries ($112 average AGI )Lorain County:
0.02%Ohio average:
0.01%
Top counties to which taxpayers relocated from this county between 2020 and 2021:
Businesses in Lorain, OH
Name Count Name Count
7-Eleven 1 Kmart 1 Advance Auto Parts 1 Kohl's 1 Applebee's 1 Little Caesars Pizza 2 AutoZone 1 Long John Silver's 1 Baskin-Robbins 1 Lowe's 1 Blockbuster 1 MasterBrand Cabinets 3 Burger King 4 McDonald's 3 CVS 1 Payless 1 Circle K 1 Pizza Hut 2 Curves 1 Quiznos 1 Decora Cabinetry 2 RadioShack 1 Dennys 1 Rite Aid 2 Dunkin Donuts 1 Sears 2 Fashion Bug 1 U-Haul 4 FedEx 6 UPS 4 GNC 1 Walgreens 2 H&R Block 3 Walmart 1 Home Depot 1 Wendy's 1 Jones New York 1
Strongest AM radio stations in Lorain:
WDLW (1380 AM; 0 kW; LORAIN, OH)
WKNR (850 AM; 50 kW; CLEVELAND, OH; Owner: CARON BROADCASTING, INC.)
WHK (1220 AM; 50 kW; CLEVELAND, OH; Owner: CARON BROADCASTING, INC.)
WJTB (1040 AM; daytime; 5 kW; NORTH RIDGEVILLE, OH; Owner: TAYLOR BROADCASTING CO)
WTAM (1100 AM; 50 kW; CLEVELAND, OH; Owner: JACOR BROADCASTING CORPORATION)
WJR (760 AM; 50 kW; DETROIT, MI; Owner: ABC, INC.)
WFDF (910 AM; 50 kW; FLINT, MI; Owner: ABC, INC.)
WWMK (1260 AM; 10 kW; CLEVELAND, OH; Owner: ABC, INC.)
WDFN (1130 AM; 50 kW; DETROIT, MI; Owner: AMFM RADIO LICENSES, L.L.C.)
WERE (1300 AM; 5 kW; CLEVELAND, OH)
WCHB (1200 AM; 50 kW; TAYLOR, MI; Owner: RADIO ONE OF DETROIT, LLC)
WWJ (950 AM; 50 kW; DETROIT, MI; Owner: INFINITY BROADCASTING OPERATIONS, INC.)
WHLO (640 AM; 5 kW; AKRON, OH; Owner: CLEAR CHANNEL BROADCASTING LICENSES, INC.)
Strongest FM radio stations in Lorain:
WCLV (104.9 FM; LORAIN, OH; Owner: RADIO SEAWAY, INC.)
WNWV (107.3 FM; ELYRIA, OH; Owner: ELYRIA-LORAIN BROADCASTING CO.)
WQAL (104.1 FM; CLEVELAND, OH; Owner: INFINITY RADIO OPERATIONS INC.)
WMJI (105.7 FM; CLEVELAND, OH; Owner: CITICASTERS LICENSES, L.P.)
WMVX (106.5 FM; CLEVELAND, OH; Owner: JACOR BROADCASTING CORPORATION)
WNCX (98.5 FM; CLEVELAND, OH; Owner: INFINITY RADIO OF CLEVELAND INC.)
WDOK (102.1 FM; CLEVELAND, OH; Owner: INFINITY RADIO OPERATIONS INC.)
WKFM (96.1 FM; HURON, OH; Owner: ELYRIA-LORAIN BROADCASTING COMPANY)
WNZN (89.1 FM; LORAIN, OH; Owner: THE SPANISH CULTURAL NETWORK)
WCRF-FM (103.3 FM; CLEVELAND, OH; Owner: THE MOODY BIBLE INSTITUTE OF CHICAGO)
WBWC (88.3 FM; BEREA, OH; Owner: BALDWIN-WALLACE COLLEGE)
WMMS (100.7 FM; CLEVELAND, OH; Owner: CITICASTERS LICENSES, L.P.)
WCPN (90.3 FM; CLEVELAND, OH; Owner: IDEASTREAM)
WKSU-FM (89.7 FM; KENT, OH; Owner: KENT STATE UNIVERSITY)
WGAR-FM (99.5 FM; CLEVELAND, OH; Owner: CITICASTERS LICENSES, L.P.)
WGGN (97.7 FM; CASTALIA, OH; Owner: CHRISTIAN FAITH BROADCAST, INC.)
WQMX (94.9 FM; MEDINA, OH; Owner: RUBBER CITY RADIO GROUP, INC)
WZIP (88.1 FM; AKRON, OH; Owner: THE UNIVERSITY OF AKRON)
WZAK (93.1 FM; CLEVELAND, OH; Owner: RADIO ONE LICENSES, LLC)
WONE-FM (97.5 FM; AKRON, OH; Owner: RUBBER CITY RADIO GROUP, INC.)
TV broadcast stations around Lorain:
WKYC-TV (Channel 3; CLEVELAND, OH; Owner: WKYC-TV, INC.)
WEWS-TV (Channel 5; CLEVELAND, OH; Owner: SCRIPPS HOWARD BROADCASTING COMPANY)
WOIO (Channel 19; SHAKER HEIGHTS, OH; Owner: RAYCOM NATIONAL, INC.)
WBNX-TV (Channel 55; AKRON, OH; Owner: WINSTON BROADCASTING NETWORK, INC.)
WQHS-TV (Channel 61; CLEVELAND, OH; Owner: UNIVISION CLEVELAND LLC)
W35AX (Channel 35; CLEVELAND, OH; Owner: MEDIA-COM TELEVISION, INC.)
WUAB (Channel 43; LORAIN, OH; Owner: RAYCOM NATIONAL, INC.)
WVIZ (Channel 25; CLEVELAND, OH; Owner: IDEASTREAM)
WJW (Channel 8; CLEVELAND, OH; Owner: WJW LICENSE, INC.)
WRAP-CA (Channel 32; CLEVELAND, OH; Owner: COMMERCIAL BROADCASTING CORP.)
WMFD-TV (Channel 68; MANSFIELD, OH; Owner: MID-STATE TELEVISION,INC.)
WEAO (Channel 49; AKRON, OH; Owner: NORTHEASTERN EDUCATIONAL TELEVISION OF OHIO, INC.)
WGGN-TV (Channel 52; SANDUSKY, OH; Owner: CHRISTIAN FAITH BROADCAST, INC.)
WVPX (Channel 23; AKRON, OH; Owner: PAXSON AKRON LICENSE, INC.)
Medal of Honor Recipients
Medal of Honor Recipients born in Lorain: Charles Joseph Berry, George Croghan Reid.
National Bridge Inventory (NBI) Statistics 24 Number of bridges479ft / 146m Total length $6,109,000 Total costs325,010 Total average daily traffic22,568 Total average daily truck traffic
New bridges - historical statistics
1 1900-1909 4 1930-1939 1 1940-1949 7 1950-1959 4 1960-1969 1 1970-1979 1 2000-2009 5 2010-2019
See full National Bridge Inventory statistics for Lorain, OH
Home Mortgage Disclosure Act Aggregated Statistics For Year 2009(Based on 16 full and 6 partial tracts) A) FHA, FSA/RHS & VA B) Conventional C) Refinancings D) Home Improvement Loans E) Loans on Dwellings For 5+ Families F) Non-occupant Loans on G) Loans On Manufactured Number Average Value Number Average Value Number Average Value Number Average Value Number Average Value Number Average Value Number Average Value
LOANS ORIGINATED 207 $93,653 166 $78,147 445 $107,648 89 $24,345 3 $815,000 87 $64,270 0 $0 APPLICATIONS APPROVED, NOT ACCEPTED 9 $72,439 12 $53,357 44 $90,846 11 $31,850 0 $0 5 $61,416 1 $16,000 APPLICATIONS DENIED 28 $80,250 42 $72,511 309 $96,018 101 $23,197 1 $5,640 41 $59,141 4 $23,000 APPLICATIONS WITHDRAWN 16 $89,262 25 $83,721 170 $107,304 11 $37,788 0 $0 15 $78,641 0 $0 FILES CLOSED FOR INCOMPLETENESS 6 $79,368 4 $79,530 34 $110,724 2 $28,000 0 $0 3 $33,333 0 $0
Aggregated Statistics For Year 2008(Based on 16 full and 6 partial tracts) A) FHA, FSA/RHS & VA B) Conventional C) Refinancings D) Home Improvement Loans F) Non-occupant Loans on G) Loans On Manufactured Number Average Value Number Average Value Number Average Value Number Average Value Number Average Value Number Average Value
LOANS ORIGINATED 227 $94,746 235 $95,023 473 $89,243 110 $21,811 143 $55,352 4 $15,450 APPLICATIONS APPROVED, NOT ACCEPTED 12 $105,942 23 $79,478 74 $86,229 20 $17,372 23 $59,943 5 $36,232 APPLICATIONS DENIED 35 $89,643 80 $74,384 518 $97,129 208 $22,162 74 $58,400 15 $21,947 APPLICATIONS WITHDRAWN 14 $95,756 40 $103,690 142 $100,710 9 $62,993 27 $64,392 1 $77,000 FILES CLOSED FOR INCOMPLETENESS 1 $77,000 5 $80,632 40 $116,304 10 $38,069 4 $74,275 0 $0
Aggregated Statistics For Year 2007(Based on 16 full and 6 partial tracts) A) FHA, FSA/RHS & VA B) Conventional C) Refinancings D) Home Improvement Loans E) Loans on Dwellings For 5+ Families F) Non-occupant Loans on G) Loans On Manufactured Number Average Value Number Average Value Number Average Value Number Average Value Number Average Value Number Average Value Number Average Value
LOANS ORIGINATED 98 $95,423 464 $102,366 695 $83,868 136 $27,310 12 $909,525 261 $67,470 5 $25,120 APPLICATIONS APPROVED, NOT ACCEPTED 6 $62,057 60 $88,185 157 $97,700 24 $33,999 0 $0 35 $70,391 6 $23,167 APPLICATIONS DENIED 21 $76,920 168 $87,619 938 $96,625 212 $36,302 0 $0 160 $80,455 14 $44,469 APPLICATIONS WITHDRAWN 11 $75,701 56 $88,271 248 $94,702 20 $31,529 1 $1,499,290 51 $68,976 1 $38,000 FILES CLOSED FOR INCOMPLETENESS 1 $187,000 45 $102,490 101 $105,437 3 $65,000 0 $0 21 $95,457 0 $0
Aggregated Statistics For Year 2006(Based on 16 full and 6 partial tracts) A) FHA, FSA/RHS & VA B) Conventional C) Refinancings D) Home Improvement Loans E) Loans on Dwellings For 5+ Families F) Non-occupant Loans on G) Loans On Manufactured Number Average Value Number Average Value Number Average Value Number Average Value Number Average Value Number Average Value Number Average Value
LOANS ORIGINATED 108 $102,617 839 $86,834 962 $80,747 189 $27,529 9 $400,150 374 $64,594 3 $99,323 APPLICATIONS APPROVED, NOT ACCEPTED 4 $89,250 150 $81,052 239 $84,983 32 $21,388 4 $1,225,690 56 $66,284 4 $17,198 APPLICATIONS DENIED 15 $108,669 356 $82,533 1,073 $87,426 286 $29,672 3 $415,050 183 $73,289 6 $77,457 APPLICATIONS WITHDRAWN 16 $90,754 131 $90,284 478 $93,336 47 $39,020 2 $162,500 69 $69,408 8 $86,036 FILES CLOSED FOR INCOMPLETENESS 0 $0 46 $80,511 132 $93,711 5 $84,868 0 $0 31 $70,615 1 $48,000
Aggregated Statistics For Year 2005(Based on 16 full and 6 partial tracts) A) FHA, FSA/RHS & VA B) Conventional C) Refinancings D) Home Improvement Loans E) Loans on Dwellings For 5+ Families F) Non-occupant Loans on G) Loans On Manufactured Number Average Value Number Average Value Number Average Value Number Average Value Number Average Value Number Average Value Number Average Value
LOANS ORIGINATED 186 $103,669 1,018 $91,310 1,281 $89,547 219 $31,551 11 $1,271,265 426 $67,769 4 $29,978 APPLICATIONS APPROVED, NOT ACCEPTED 7 $88,759 163 $86,669 287 $85,856 34 $26,281 2 $318,000 56 $73,553 6 $48,007 APPLICATIONS DENIED 18 $108,776 305 $80,560 1,335 $92,194 345 $28,413 1 $98,640 152 $70,155 18 $32,519 APPLICATIONS WITHDRAWN 7 $119,731 142 $95,418 730 $228,594 111 $131,734 2 $781,000 90 $79,858 2 $45,825 FILES CLOSED FOR INCOMPLETENESS 3 $124,357 37 $96,138 145 $106,225 6 $35,147 0 $0 19 $75,757 0 $0
Aggregated Statistics For Year 2004(Based on 16 full and 6 partial tracts) A) FHA, FSA/RHS & VA B) Conventional C) Refinancings D) Home Improvement Loans E) Loans on Dwellings For 5+ Families F) Non-occupant Loans on G) Loans On Manufactured Number Average Value Number Average Value Number Average Value Number Average Value Number Average Value Number Average Value Number Average Value
LOANS ORIGINATED 229 $107,336 814 $85,508 1,280 $87,110 157 $29,447 13 $771,658 326 $64,688 4 $45,902 APPLICATIONS APPROVED, NOT ACCEPTED 6 $91,638 139 $84,994 379 $90,876 30 $34,875 2 $209,500 67 $70,417 10 $30,222 APPLICATIONS DENIED 21 $96,646 249 $80,329 1,380 $91,083 250 $26,102 0 $0 144 $65,519 8 $36,128 APPLICATIONS WITHDRAWN 9 $99,320 114 $90,010 591 $95,167 38 $54,006 0 $0 57 $63,501 1 $100,000 FILES CLOSED FOR INCOMPLETENESS 3 $110,630 39 $94,754 208 $93,815 7 $35,946 0 $0 23 $70,050 0 $0
Aggregated Statistics For Year 2003(Based on 16 full and 6 partial tracts) A) FHA, FSA/RHS & VA B) Conventional C) Refinancings D) Home Improvement Loans E) Loans on Dwellings For 5+ Families F) Non-occupant Loans on Number Average Value Number Average Value Number Average Value Number Average Value Number Average Value Number Average Value
LOANS ORIGINATED 206 $101,527 806 $95,200 1,953 $87,993 93 $18,556 11 $515,616 320 $68,168 APPLICATIONS APPROVED, NOT ACCEPTED 8 $80,346 103 $88,142 397 $82,993 28 $16,080 2 $575,230 51 $70,677 APPLICATIONS DENIED 18 $95,054 149 $81,476 1,146 $87,471 207 $13,682 0 $0 89 $74,695 APPLICATIONS WITHDRAWN 21 $103,480 115 $91,131 540 $89,215 17 $31,965 0 $0 49 $67,941 FILES CLOSED FOR INCOMPLETENESS 4 $94,708 41 $80,163 210 $90,859 4 $18,478 0 $0 20 $65,484
Aggregated Statistics For Year 2002(Based on 16 full and 6 partial tracts) A) FHA, FSA/RHS & VA B) Conventional C) Refinancings D) Home Improvement Loans E) Loans on Dwellings For 5+ Families F) Non-occupant Loans on Number Average Value Number Average Value Number Average Value Number Average Value Number Average Value Number Average Value
LOANS ORIGINATED 280 $90,074 616 $93,855 1,755 $83,619 157 $14,211 7 $718,300 282 $64,724 APPLICATIONS APPROVED, NOT ACCEPTED 12 $87,660 86 $91,233 475 $78,219 45 $13,465 1 $67,000 49 $69,225 APPLICATIONS DENIED 27 $91,749 141 $86,754 1,160 $80,887 233 $10,923 1 $210,000 77 $63,857 APPLICATIONS WITHDRAWN 21 $103,749 69 $93,710 550 $83,504 24 $27,525 1 $750,000 52 $65,912 FILES CLOSED FOR INCOMPLETENESS 3 $70,333 32 $81,839 196 $81,536 8 $37,704 0 $0 15 $64,091
Aggregated Statistics For Year 2001(Based on 16 full and 6 partial tracts) A) FHA, FSA/RHS & VA B) Conventional C) Refinancings D) Home Improvement Loans E) Loans on Dwellings For 5+ Families F) Non-occupant Loans on Number Average Value Number Average Value Number Average Value Number Average Value Number Average Value Number Average Value
LOANS ORIGINATED 385 $89,310 587 $84,900 1,620 $76,222 192 $16,774 7 $694,301 233 $55,382 APPLICATIONS APPROVED, NOT ACCEPTED 12 $88,532 64 $71,713 361 $68,941 53 $19,545 0 $0 35 $68,631 APPLICATIONS DENIED 20 $92,715 163 $71,075 1,294 $70,288 258 $11,860 1 $1,100,000 106 $65,507 APPLICATIONS WITHDRAWN 26 $88,473 74 $88,132 613 $76,037 40 $14,109 0 $0 49 $69,552 FILES CLOSED FOR INCOMPLETENESS 6 $77,732 26 $73,940 156 $79,765 5 $32,402 0 $0 14 $53,586
Aggregated Statistics For Year 2000(Based on 16 full and 6 partial tracts) A) FHA, FSA/RHS & VA B) Conventional C) Refinancings D) Home Improvement Loans E) Loans on Dwellings For 5+ Families F) Non-occupant Loans on Number Average Value Number Average Value Number Average Value Number Average Value Number Average Value Number Average Value
LOANS ORIGINATED 336 $84,146 571 $77,800 812 $63,519 250 $13,009 12 $641,060 226 $59,382 APPLICATIONS APPROVED, NOT ACCEPTED 9 $109,224 65 $63,486 307 $64,785 114 $16,119 0 $0 42 $60,067 APPLICATIONS DENIED 26 $94,113 215 $65,826 1,063 $64,395 327 $14,639 0 $0 115 $56,649 APPLICATIONS WITHDRAWN 23 $83,991 111 $71,020 462 $65,470 55 $24,854 0 $0 42 $66,107 FILES CLOSED FOR INCOMPLETENESS 3 $74,667 22 $62,469 113 $69,201 5 $28,178 0 $0 15 $62,000
Aggregated Statistics For Year 1999(Based on 16 full and 6 partial tracts) A) FHA, FSA/RHS & VA B) Conventional C) Refinancings D) Home Improvement Loans E) Loans on Dwellings For 5+ Families F) Non-occupant Loans on Number Average Value Number Average Value Number Average Value Number Average Value Number Average Value Number Average Value
LOANS ORIGINATED 368 $81,361 621 $79,817 1,239 $62,778 276 $13,004 15 $543,156 298 $55,527 APPLICATIONS APPROVED, NOT ACCEPTED 2 $136,460 70 $68,556 491 $63,888 105 $10,937 0 $0 48 $55,399 APPLICATIONS DENIED 18 $65,719 194 $59,150 895 $63,492 371 $13,384 2 $7,495 72 $46,554 APPLICATIONS WITHDRAWN 27 $79,071 80 $70,228 516 $62,344 49 $27,772 1 $1,700,000 41 $57,650 FILES CLOSED FOR INCOMPLETENESS 3 $67,663 26 $76,027 171 $68,760 12 $17,142 0 $0 15 $68,327
Detailed mortgage data for all 22 tracts in Lorain, OH
Private Mortgage Insurance Companies Aggregated Statistics For Year 2009(Based on 8 full and 3 partial tracts) A) Conventional B) Refinancings C) Non-occupant Loans on Number Average Value Number Average Value Number Average Value
LOANS ORIGINATED 5 $131,826 3 $130,360 1 $116,000 APPLICATIONS APPROVED, NOT ACCEPTED 8 $67,822 3 $117,467 1 $41,000 APPLICATIONS DENIED 6 $130,375 1 $103,000 1 $116,000 APPLICATIONS WITHDRAWN 0 $0 0 $0 0 $0 FILES CLOSED FOR INCOMPLETENESS 3 $99,247 0 $0 0 $0
Aggregated Statistics For Year 2008(Based on 16 full and 6 partial tracts) A) Conventional B) Refinancings C) Non-occupant Loans on Number Average Value Number Average Value Number Average Value
LOANS ORIGINATED 84 $111,955 24 $119,461 13 $74,971 APPLICATIONS APPROVED, NOT ACCEPTED 41 $93,067 36 $104,133 12 $85,519 APPLICATIONS DENIED 9 $79,667 4 $91,292 6 $95,500 APPLICATIONS WITHDRAWN 6 $88,167 2 $153,175 0 $0 FILES CLOSED FOR INCOMPLETENESS 6 $98,718 2 $57,500 6 $90,645
Aggregated Statistics For Year 2007(Based on 16 full and 6 partial tracts) A) Conventional B) Refinancings C) Non-occupant Loans on Number Average Value Number Average Value Number Average Value
LOANS ORIGINATED 215 $102,209 80 $115,216 31 $76,106 APPLICATIONS APPROVED, NOT ACCEPTED 31 $133,445 28 $117,705 8 $77,490 APPLICATIONS DENIED 5 $97,522 2 $123,000 2 $82,570 APPLICATIONS WITHDRAWN 9 $74,697 7 $120,057 3 $72,757 FILES CLOSED FOR INCOMPLETENESS 0 $0 3 $100,757 0 $0
Aggregated Statistics For Year 2006(Based on 15 full and 6 partial tracts) A) Conventional B) Refinancings C) Non-occupant Loans on Number Average Value Number Average Value Number Average Value
LOANS ORIGINATED 146 $111,272 70 $106,092 24 $61,276 APPLICATIONS APPROVED, NOT ACCEPTED 23 $103,766 37 $107,918 8 $52,375 APPLICATIONS DENIED 5 $66,312 2 $88,475 4 $66,250 APPLICATIONS WITHDRAWN 11 $136,898 7 $113,650 2 $64,000 FILES CLOSED FOR INCOMPLETENESS 0 $0 3 $54,940 0 $0
Aggregated Statistics For Year 2005(Based on 15 full and 6 partial tracts) A) Conventional B) Refinancings C) Non-occupant Loans on D) Loans On Manufactured Number Average Value Number Average Value Number Average Value Number Average Value
LOANS ORIGINATED 166 $97,256 93 $113,366 45 $66,984 0 $0 APPLICATIONS APPROVED, NOT ACCEPTED 32 $103,241 54 $116,065 12 $63,083 2 $101,005 APPLICATIONS DENIED 2 $52,485 3 $70,327 3 $50,650 0 $0 APPLICATIONS WITHDRAWN 6 $110,658 10 $117,084 4 $82,500 0 $0 FILES CLOSED FOR INCOMPLETENESS 0 $0 2 $107,000 0 $0 0 $0
Aggregated Statistics For Year 2004(Based on 16 full and 6 partial tracts) A) Conventional B) Refinancings C) Non-occupant Loans on Number Average Value Number Average Value Number Average Value
LOANS ORIGINATED 164 $96,083 116 $99,677 41 $58,187 APPLICATIONS APPROVED, NOT ACCEPTED 27 $104,272 81 $102,932 10 $75,992 APPLICATIONS DENIED 1 $110,000 4 $82,630 2 $83,760 APPLICATIONS WITHDRAWN 9 $76,268 26 $99,920 3 $92,137 FILES CLOSED FOR INCOMPLETENESS 2 $63,000 3 $70,000 1 $72,000
Aggregated Statistics For Year 2003(Based on 15 full and 6 partial tracts) A) Conventional B) Refinancings C) Non-occupant Loans on Number Average Value Number Average Value Number Average Value
LOANS ORIGINATED 204 $97,336 215 $103,520 65 $65,917 APPLICATIONS APPROVED, NOT ACCEPTED 31 $101,163 120 $109,197 18 $84,550 APPLICATIONS DENIED 3 $166,603 3 $89,000 2 $110,000 APPLICATIONS WITHDRAWN 11 $114,701 35 $94,889 10 $87,323 FILES CLOSED FOR INCOMPLETENESS 3 $50,060 5 $92,500 3 $50,060
Aggregated Statistics For Year 2002(Based on 16 full and 6 partial tracts) A) Conventional B) Refinancings C) Non-occupant Loans on Number Average Value Number Average Value Number Average Value
LOANS ORIGINATED 183 $95,354 217 $103,003 38 $65,585 APPLICATIONS APPROVED, NOT ACCEPTED 31 $121,896 83 $93,954 12 $63,202 APPLICATIONS DENIED 3 $67,443 4 $71,000 0 $0 APPLICATIONS WITHDRAWN 11 $111,760 44 $97,316 7 $86,613 FILES CLOSED FOR INCOMPLETENESS 1 $75,000 3 $92,667 0 $0
Aggregated Statistics For Year 2001(Based on 16 full and 6 partial tracts) A) Conventional B) Refinancings C) Non-occupant Loans on Number Average Value Number Average Value Number Average Value
LOANS ORIGINATED 160 $90,467 195 $91,510 50 $59,397 APPLICATIONS APPROVED, NOT ACCEPTED 24 $75,831 56 $89,591 7 $53,081 APPLICATIONS DENIED 10 $75,600 11 $103,616 11 $85,649 APPLICATIONS WITHDRAWN 4 $89,500 12 $104,777 2 $61,500 FILES CLOSED FOR INCOMPLETENESS 0 $0 2 $86,500 0 $0
Aggregated Statistics For Year 2000(Based on 16 full and 6 partial tracts) A) Conventional B) Refinancings C) Non-occupant Loans on Number Average Value Number Average Value Number Average Value
LOANS ORIGINATED 153 $83,107 51 $81,605 42 $56,680 APPLICATIONS APPROVED, NOT ACCEPTED 15 $72,817 25 $82,542 3 $91,240 APPLICATIONS DENIED 8 $87,294 7 $114,061 3 $65,197 APPLICATIONS WITHDRAWN 4 $54,035 4 $73,780 4 $51,692 FILES CLOSED FOR INCOMPLETENESS 1 $64,000 0 $0 0 $0
Aggregated Statistics For Year 1999(Based on 15 full and 6 partial tracts) A) Conventional B) Refinancings C) Non-occupant Loans on Number Average Value Number Average Value Number Average Value
LOANS ORIGINATED 122 $94,130 91 $82,343 19 $48,448 APPLICATIONS APPROVED, NOT ACCEPTED 14 $81,162 11 $88,681 4 $60,248 APPLICATIONS DENIED 8 $105,522 4 $118,440 2 $59,980 APPLICATIONS WITHDRAWN 3 $80,033 7 $60,779 1 $23,990 FILES CLOSED FOR INCOMPLETENESS 2 $59,500 0 $0 0 $0
Most common first names in Lorain, OH among deceased individuals Name Count Lived (average)
John 944 75.3 years Mary 883 79.8 years Joseph 464 75.6 years William 463 72.6 years James 370 70.4 years Helen 368 79.4 years George 350 75.5 years Frank 349 74.8 years Anna 344 82.0 years Robert 321 69.6 years
Most common last names in Lorain, OH among deceased individuals Last name Count Lived (average)
Smith 214 72.8 years Miller 107 74.0 years Jones 106 72.9 years Williams 95 71.0 years Johnson 83 72.2 years Thomas 75 72.8 years Brown 60 71.4 years Thompson 55 72.0 years Jackson 52 67.3 years Davis 52 70.3 years
Lorain compared to Ohio state average:
Median house value below state average. Unemployed percentage below state average. Hispanic race population percentage significantly above state average. Foreign-born population percentage below state average.
#6 on the list of "Top 101 cities with the smallest racial income disparities between White and Black householders (with at least 2,000 householders)"
#10 on the list of "Top 101 cities with the largest city-data.com crime index increase from 2002 to 2012 (population 50,000+)"
#14 on the list of "Top 101 cities with largest percentage of females in industries: retail trade (population 50,000+)"
#20 on the list of "Top 101 larger cities with the largest decrease or smallest increase in house/condo value from 2000 (population 50,000+)"
#21 on the list of "Top 101 larger cities with the largest decrease or smallest increase in household income from 2000 (population 50,000+)"
#23 on the list of "Top 101 cities with the highest number of burglaries per 100,000 residents, excludes tourist destinations and others with a lot of outsiders visiting based on city industries data (population 50,000+)"
#23 on the list of "Top 101 cities with the largest percentage population decrease from 2000 (population 50,000+)"
#23 on the list of "Top 100 cities with declining populations from 2000 to 2014 (pop. 50,000+)"
#24 on the list of "Top 101 cities with largest percentage of males in occupations: production occupations (population 50,000+)"
#31 on the list of "Top 101 cities with the lowest cost per building permit (population 50,000+)"
#33 on the list of "Top 101 cities with the lowest percentage of workers working at home, population 50,000+"
#33 on the list of "Top 101 cities with the most people born in the same U.S. state as the city (population 50,000+)"
#41 on the list of "Top 101 cities with the most full-time local library workers per 1000 residents (population 5,000+)"
#42 on the list of "Top 101 cities with the smallest racial income disparities between White and Black householders (with at least 200 householders)"
#43 on the list of "Top 101 cities with largest percentage of males in industries: manufacturing (population 50,000+)"
#46 on the list of "Top 101 cities with the highest percentage of single-parent households, population 50,000+"
#51 on the list of "Top 101 cities with largest percentage of females in occupations: food preparation and serving related occupations (population 50,000+)"
#51 on the list of "Top 101 cities with the lowest minimum monthly sunshine amount (population 50,000+)"
#55 on the list of "Top 101 cities with the highest number of arson incidents per 100,000 residents, excludes tourist destinations and others with a lot of outsiders visiting based on city industries data (population 50,000+)"
#55 on the list of "Top 101 cities with the highest average snowfall in a year (population 50,000+)"
#16 (44055) on the list of "Top 101 zip codes with the largest percentage of Hungarian first ancestries (pop 5,000+)"
#56 (44055) on the list of "Top 101 zip codes with the lowest 2012 average net capital gain/loss (pop 5,000+)"
#1 on the list of "Top 101 counties with the highest average weight of females"
#10 on the list of "Top 101 counties with the lowest percentage of residents that drank alcohol in the past 30 days"
#16 on the list of "Top 101 counties with the lowest Particulate Matter (PM10 ) Annual air pollution readings in 2012 (µg/m3 )"
#17 on the list of "Top 101 counties with the lowest percentage of residents relocating from foreign countries between 2010 and 2011"
#22 on the list of "Top 101 counties with the highest percentage of residents that smoked 100+ cigarettes in their lives"
Top Patent Applicants
Robert Skrjanc (6)
James W. Schmitkons (6)
James V. Bachman (6)
Marco Parrilla (3)
Martin Patrick Tansey (3)
Vincent A. Prieto (3)
Rocco Deangelis (3)
Michael E. Winiasz (2)
Alexander Campana (2)
Saunjula Staton (2)
Total of 84 patent applications in 2008-2024.
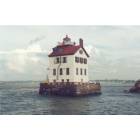

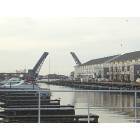
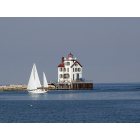


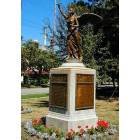
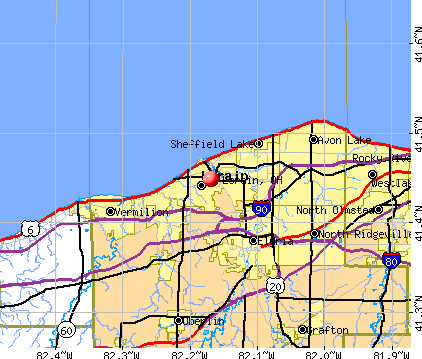


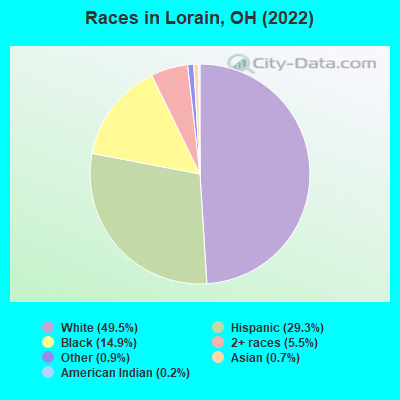
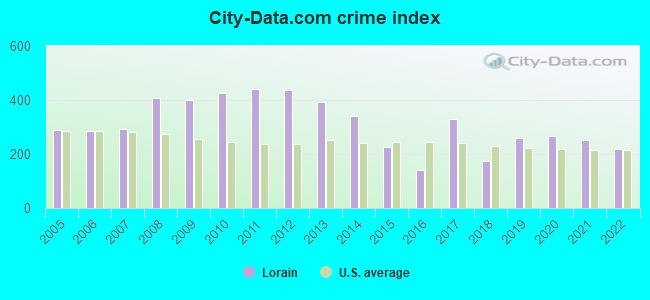
 Recent articles from our blog. Our writers, many of them Ph.D. graduates or candidates, create easy-to-read articles on a wide variety of topics.

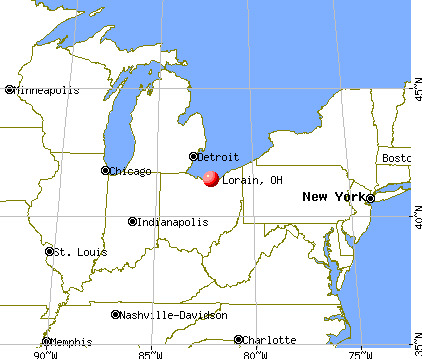
 (26.0 miles
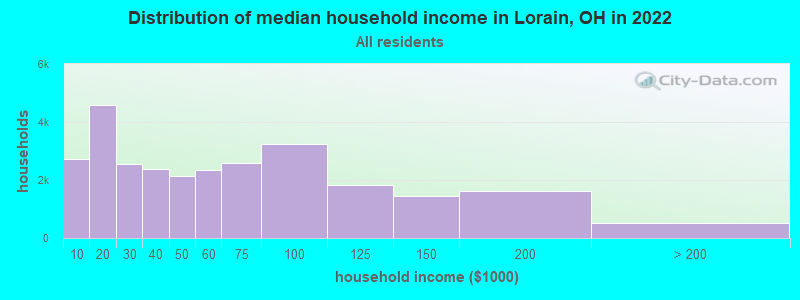
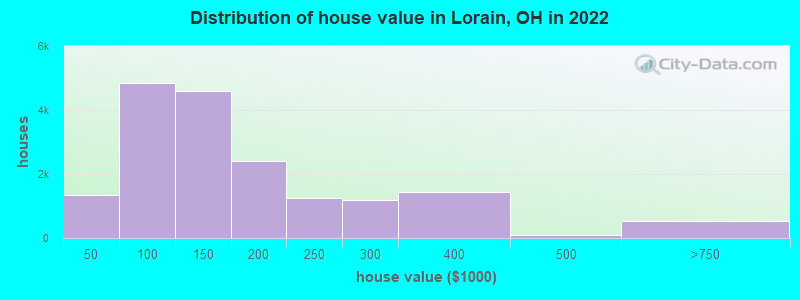

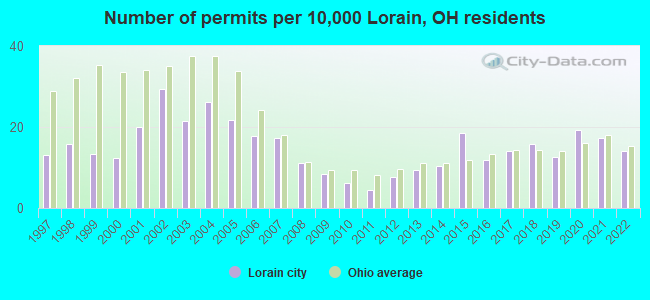
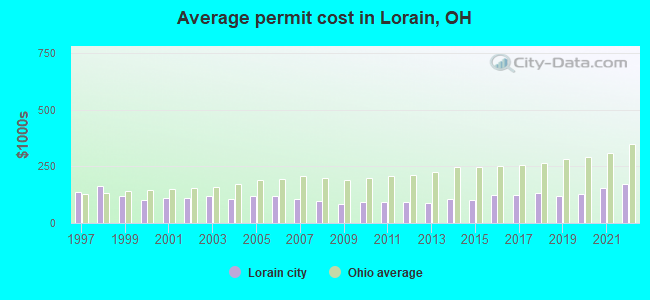
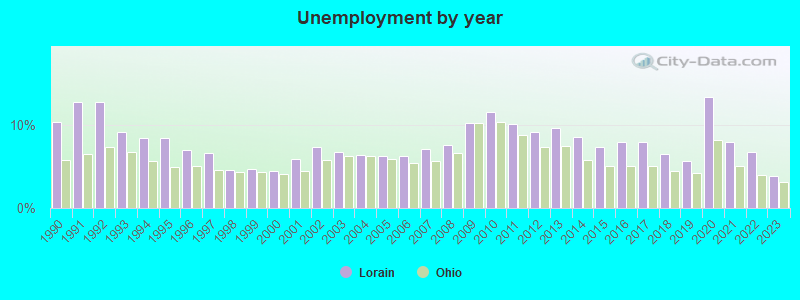
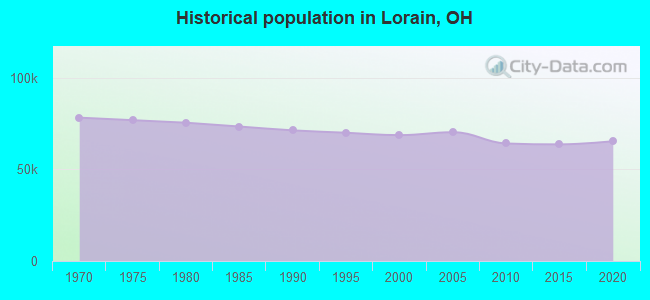
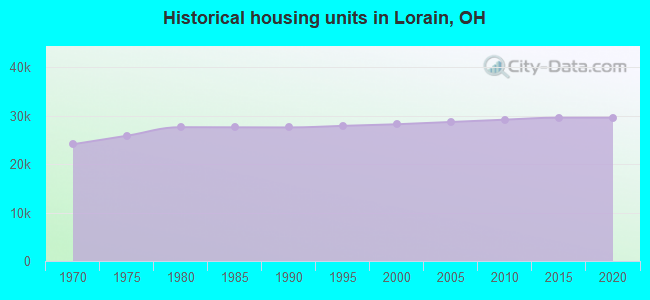
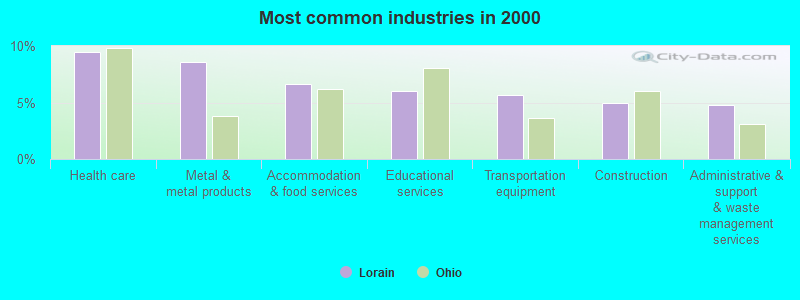
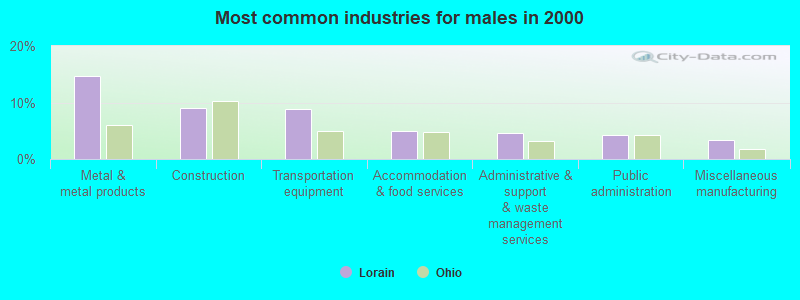
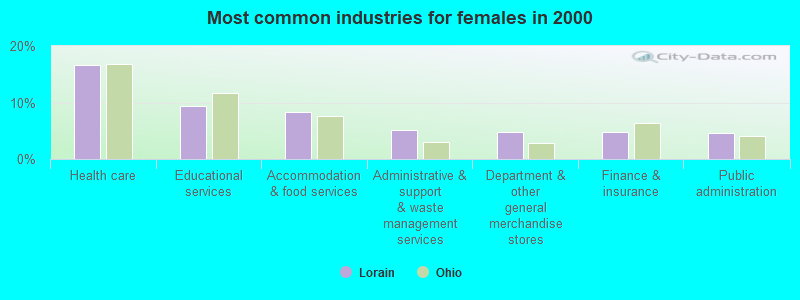
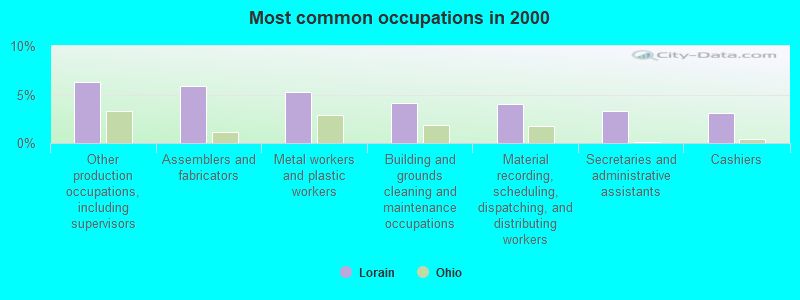
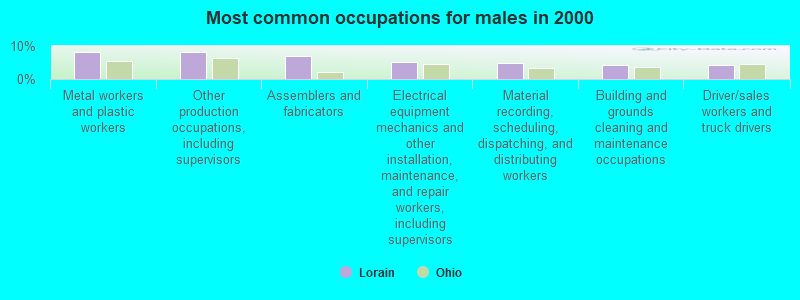
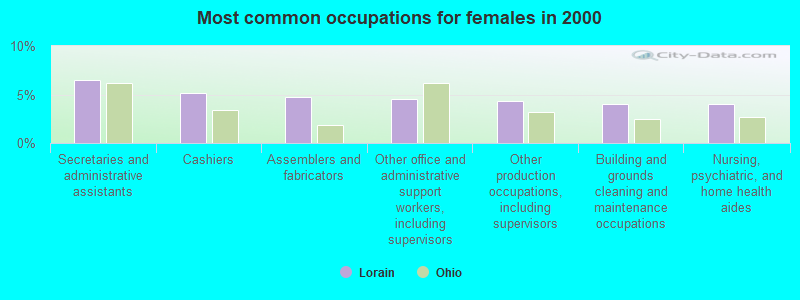


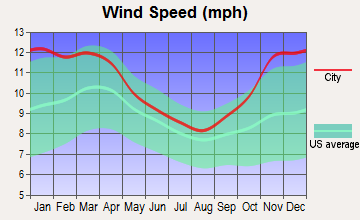
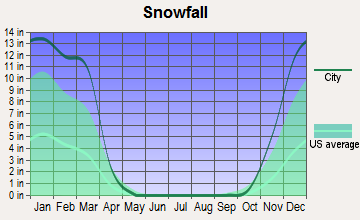
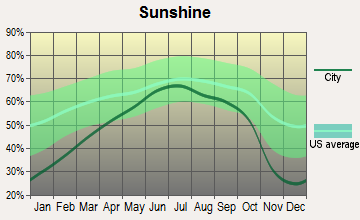
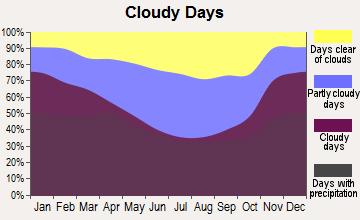
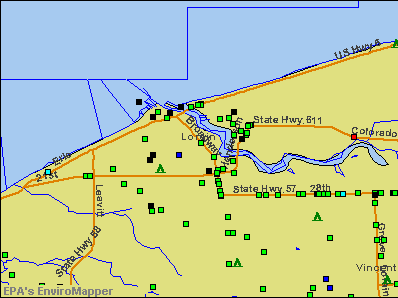

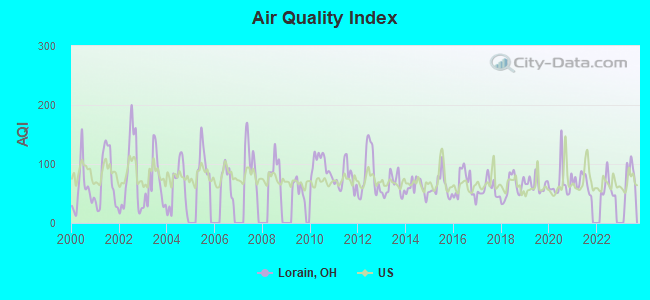
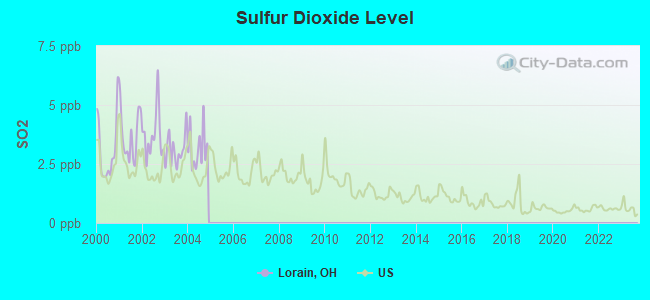
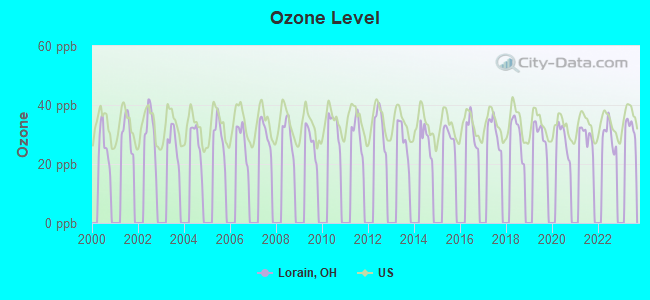
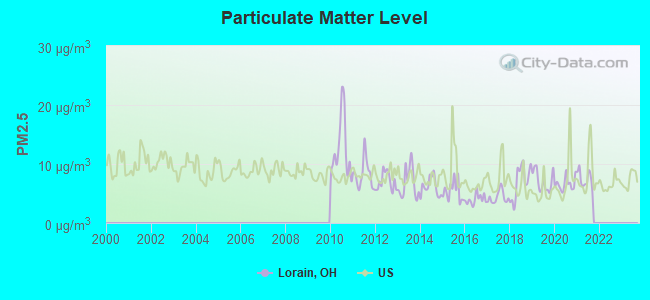
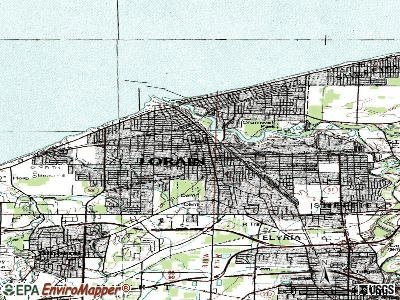
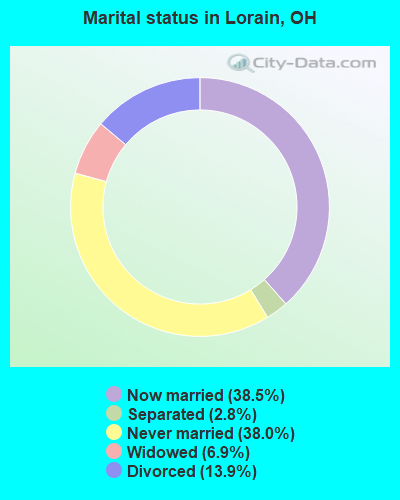
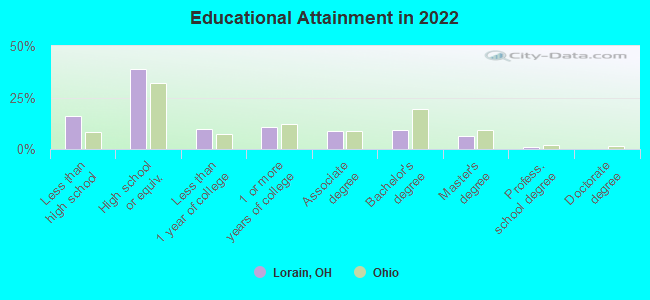
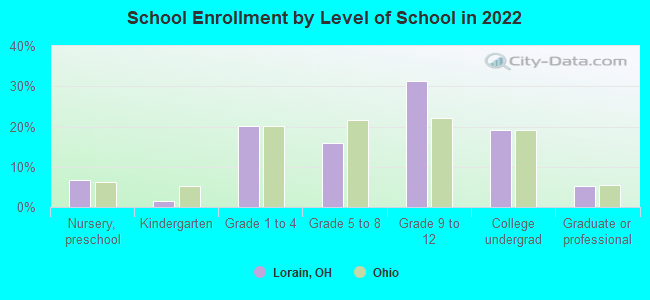
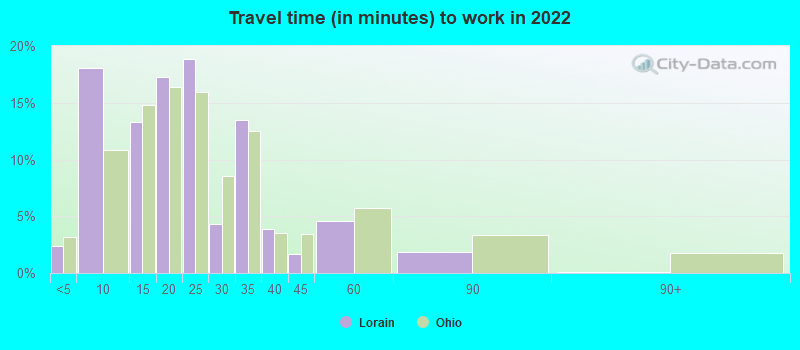
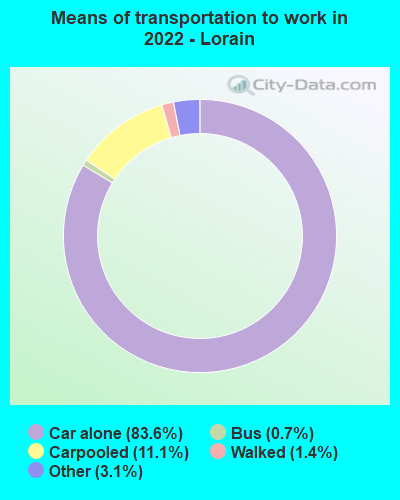
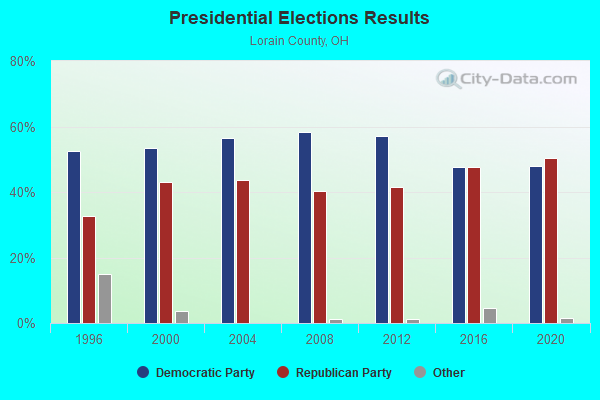
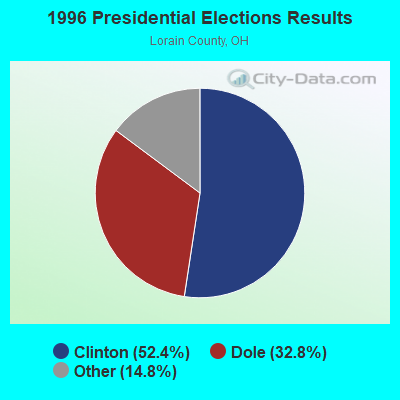
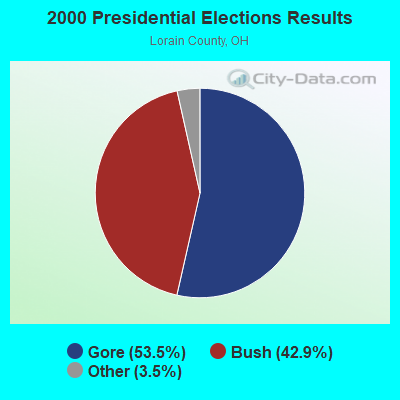
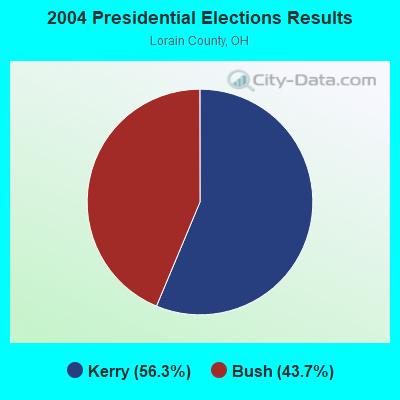
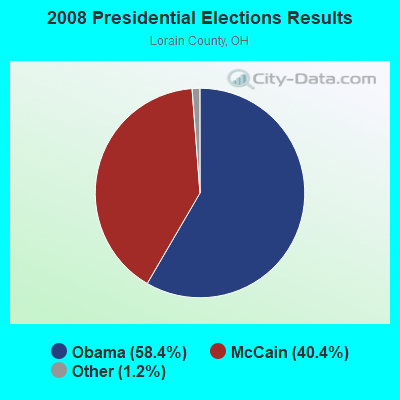
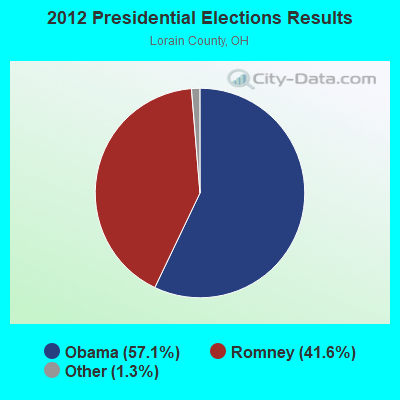
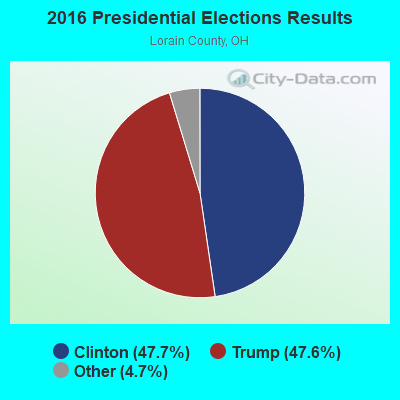
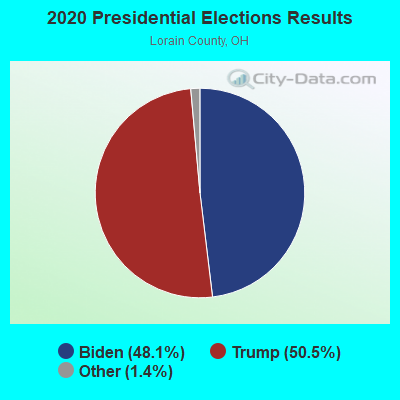
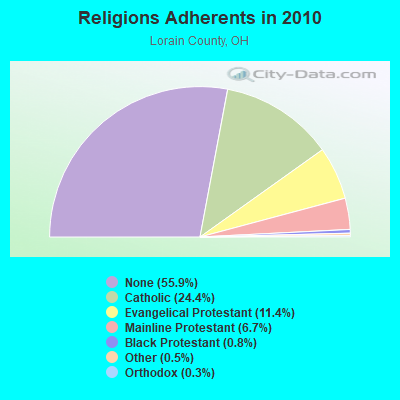
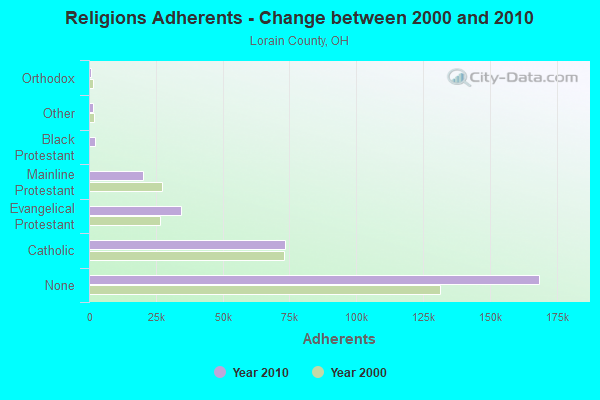
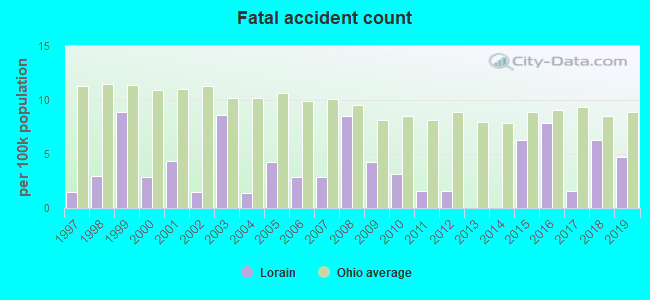
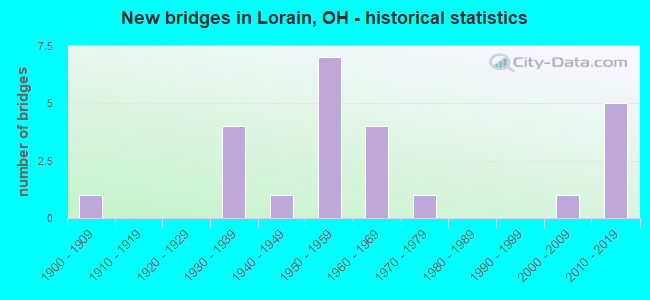
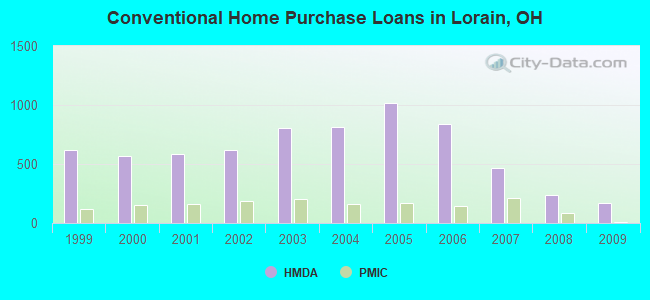
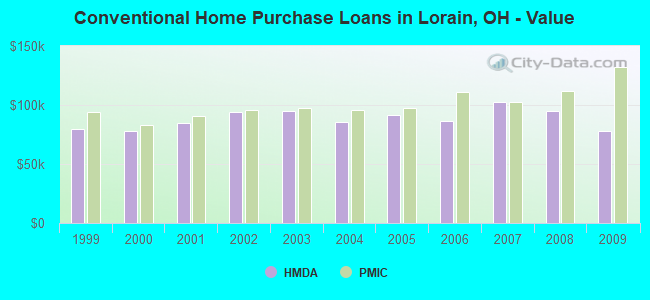
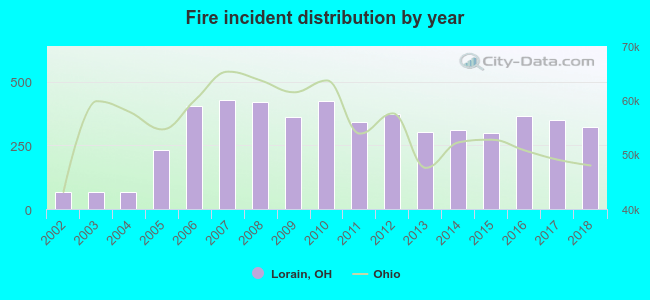 Based on the data from the years 2002 - 2018 the average number of fires per year is 302. The highest number of fire incidents - 427 took place in 2007, and the least - 67 in 2003. The data has a rising trend.
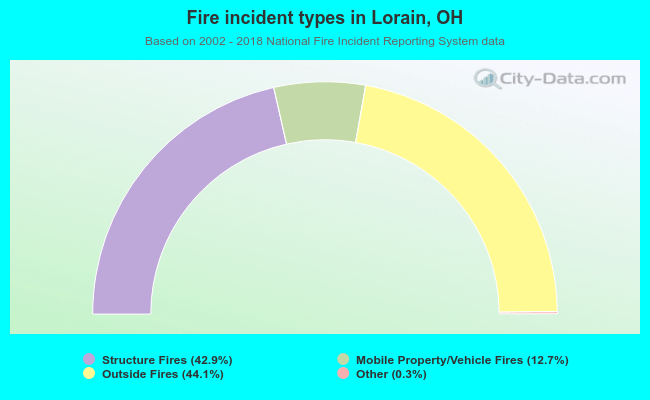 When looking into fire subcategories, the most incidents belonged to: Outside Fires (44.1%), and Structure Fires (42.9%).