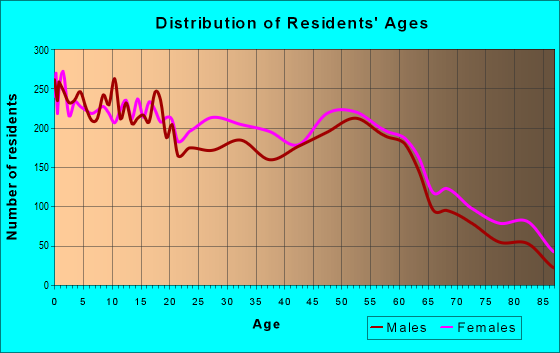
Estimated zip code population in 2022: 28,219 Zip code population in 2010: 29,850 Zip code population in 2000: 33,148
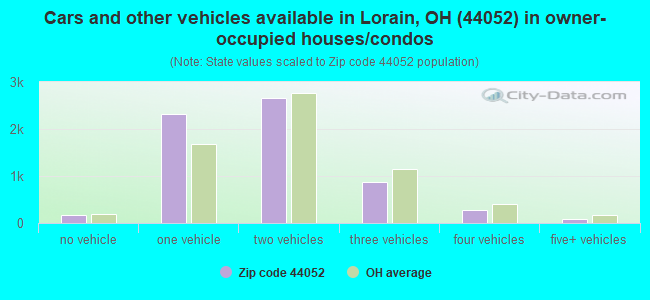
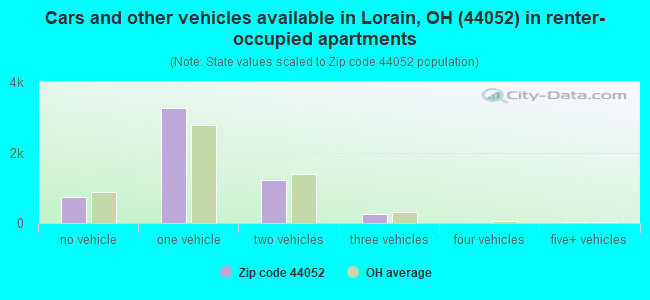
Houses and condos: 13,690 Renter-occupied apartments: 5,463
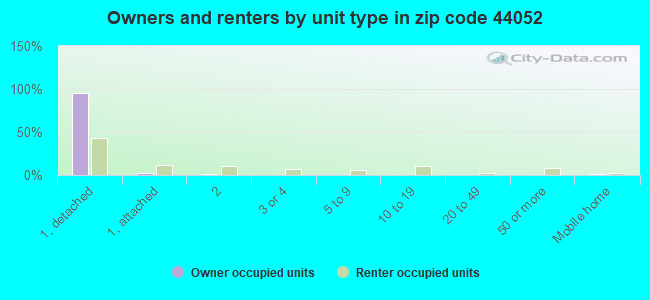
% of renters here:
46%
State:
33%
March 2022 cost of living index in zip code 44052: 93.2 (less than average, U.S. average is 100)
Land area: 9.2 sq. mi. Water area: 1.2 sq. mi.
Population density: 3,057 people per square mile
(average).
OSM Map
General Map
Google Map
MSN Map
OSM Map
General Map
Google Map
MSN Map
OSM Map
General Map
Google Map
MSN Map
OSM Map
General Map
Google Map
MSN Map
Please wait while loading the map...
Real estate property taxes paid for housing units in 2022:
This zip code:
1.4% ($1,510)
Ohio:
1.3% ($2,639)
Median real estate property taxes paid for housing units with mortgages in 2022: $1,610 (1.4%) Median real estate property taxes paid for housing units with no mortgage in 2022: $1,423 (1.5%)
Averages for the 2020 tax year for zip code 44052, filed in 2021:
Average Adjusted Gross Income (AGI) in 2020: $34,825 (Individual Income Tax Returns)
Here:
$34,825
State:
$67,288
Salary/wage: $30,484 (reported on 83.6% of returns)
Here:
$30,484
State:
$55,628
(% of AGI for various income ranges: 1080.6% for AGIs below $25k, 3313.0% for AGIs $25k-50k, 6068.1% for AGIs $50k-75k, 9338.2% for AGIs $75k-100k, 14783.4% for AGIs $100k-200k)
Taxable interest for individuals: $946 (reported on 12.9% of returns)
This zip code:
$946
Ohio:
$1,518
(% of AGI for various income ranges: 4.8% for AGIs below $25k, 9.2% for AGIs $25k-50k, 25.4% for AGIs $50k-75k, 31.4% for AGIs $75k-100k, 177.2% for AGIs $100k-200k)
Ordinary dividends: $2,831 (reported on 7.2% of returns)
Here:
$2,831
State:
$7,167
(% of AGI for various income ranges: 4.3% for AGIs below $25k, 10.3% for AGIs $25k-50k, 44.3% for AGIs $50k-75k, 79.5% for AGIs $75k-100k, 247.6% for AGIs $100k-200k)
Net capital gain/loss in AGI: +$4,627 (reported on 5.8% of returns)
Here:
+$4,627
State:
+$18,919
(% of AGI for various income ranges: 3.0% for AGIs below $25k, 6.3% for AGIs $25k-50k, 28.6% for AGIs $50k-75k, 148.2% for AGIs $75k-100k, 541.4% for AGIs $100k-200k)
Profit/loss from business: +$6,384 (reported on 10.2% of returns)
Here:
+$6,384
State:
+$13,744
(% of AGI for various income ranges: 88.7% for AGIs below $25k, 51.6% for AGIs $25k-50k, 80.0% for AGIs $50k-75k, 207.3% for AGIs $75k-100k, 163.1% for AGIs $100k-200k)
Taxable individual retirement arrangement distribution: $13,214 (reported on 5.2% of returns)
44052:
$13,214
Ohio:
$18,876
(% of AGI for various income ranges: 23.4% for AGIs below $25k, 54.4% for AGIs $25k-50k, 158.1% for AGIs $50k-75k, 349.5% for AGIs $75k-100k, 915.5% for AGIs $100k-200k)
Total itemized deductions: $27,942 (reported on 1.4% of returns)
Here:
$27,942
State:
$33,869
(% of AGI for various income ranges: 33.1% for AGIs $25k-50k, 86.5% for AGIs $50k-75k, 177.3% for AGIs $75k-100k, 790.3% for AGIs $100k-200k)
Charity contributions: $7,173 (reported on 1.1% of returns)
Here:
$7,173
State:
$14,577
(% of AGI for various income ranges: 6.3% for AGIs $25k-50k, 21.7% for AGIs $50k-75k, 35.2% for AGIs $75k-100k, 149.7% for AGIs $100k-200k)
Taxes paid: $5,837 (reported on 1.4% of returns)
44052:
$5,837
State:
$7,681
(% of AGI for various income ranges: 4.3% for AGIs $25k-50k, 19.3% for AGIs $50k-75k, 45.9% for AGIs $75k-100k, 180.3% for AGIs $100k-200k)
Earned income credit: $2,666 (reported on 31.3% of returns)
Here:
$2,666
State:
$2,304
(% of AGI for various income ranges: 150.8% for AGIs below $25k, 95.1% for AGIs $25k-50k, 1.2% for AGIs $50k-75k)
Percentage of individuals using paid preparers for their 2020 taxes: 94.5%
Here:
94%
State:
94%
(% for various income ranges: 94.5% for AGIs below $25k, 95.2% for AGIs $25k-50k, 93.6% for AGIs $50k-75k, 94.0% for AGIs $75k-100k, 92.0% for AGIs $100k-200k, 83.3% for AGIs over 200k)
Averages for the 2012 tax year for zip code 44052, filed in 2013:
Average Adjusted Gross Income (AGI) in 2012: $31,949 (Individual Income Tax Returns)
Here:
$31,949
State:
$54,926
Salary/wage: $28,250 (reported on 86.9% of returns)
Here:
$28,250
State:
$45,869
(% of AGI for various income ranges: 77.6% for AGIs below $25k, 78.3% for AGIs $25k-50k, 78.4% for AGIs $50k-75k, 76.9% for AGIs $75k-100k, 75.5% for AGIs $100k-200k, 54.7% for AGIs over 200k)
Taxable interest for individuals: $1,087 (reported on 19.6% of returns)
This zip code:
$1,087
Ohio:
$1,297
(% of AGI for various income ranges: 0.6% for AGIs below $25k, 0.6% for AGIs $25k-50k, 0.5% for AGIs $50k-75k, 1.0% for AGIs $75k-100k, 0.9% for AGIs $100k-200k, 0.6% for AGIs over 200k)
Ordinary dividends: $2,489 (reported on 9.5% of returns)
Here:
$2,489
State:
$5,821
(% of AGI for various income ranges: 0.5% for AGIs below $25k, 0.5% for AGIs $25k-50k, 0.6% for AGIs $50k-75k, 1.1% for AGIs $75k-100k, 0.9% for AGIs $100k-200k, 3.3% for AGIs over 200k)
Net capital gain/loss in AGI: +$384 (reported on 5.3% of returns)
Here:
+$384
State:
+$11,232
(% of AGI for various income ranges: 0.4% for AGIs $75k-100k, 0.6% for AGIs $100k-200k)
Profit/loss from business: +$7,061 (reported on 9.0% of returns)
Here:
+$7,061
State:
+$12,773
(% of AGI for various income ranges: 5.7% for AGIs below $25k, 1.2% for AGIs $25k-50k, 0.8% for AGIs $50k-75k, 0.6% for AGIs $75k-100k, 1.3% for AGIs $100k-200k)
Taxable individual retirement arrangement distribution: $10,492 (reported on 6.9% of returns)
44052:
$10,492
Ohio:
$14,511
(% of AGI for various income ranges: 1.4% for AGIs below $25k, 2.0% for AGIs $25k-50k, 2.2% for AGIs $50k-75k, 2.8% for AGIs $75k-100k, 4.5% for AGIs $100k-200k)
Total itemized deductions: $15,630 (23% of AGI, reported on 15.3% of returns)
Here:
$15,630
State:
$21,278
Here:
23.5% of AGI
State:
18.8% of AGI
(% of AGI for various income ranges: 4.0% for AGIs below $25k, 6.1% for AGIs $25k-50k, 8.3% for AGIs $50k-75k, 9.6% for AGIs $75k-100k, 10.9% for AGIs $100k-200k, 16.6% for AGIs over 200k)
Charity contributions: $2,740 (reported on 11.3% of returns)
Here:
$2,740
State:
$3,943
(% of AGI for various income ranges: 0.3% for AGIs below $25k, 0.8% for AGIs $25k-50k, 1.1% for AGIs $50k-75k, 1.2% for AGIs $75k-100k, 1.6% for AGIs $100k-200k, 2.7% for AGIs over 200k)
Taxes paid: $5,176 (reported on 15.3% of returns)
44052:
$5,176
State:
$9,568
(% of AGI for various income ranges: 0.6% for AGIs below $25k, 1.6% for AGIs $25k-50k, 2.7% for AGIs $50k-75k, 3.6% for AGIs $75k-100k, 5.1% for AGIs $100k-200k, 7.4% for AGIs over 200k)
Earned income credit: $2,580 (reported on 32.7% of returns)
Here:
$2,580
State:
$2,285
(% of AGI for various income ranges: 10.4% for AGIs below $25k, 1.4% for AGIs $25k-50k)
Percentage of individuals using paid preparers for their 2012 taxes: 46.9%
Here:
47%
State:
51%
(% for various income ranges: 43.7% for AGIs below $25k, 49.3% for AGIs $25k-50k, 51.1% for AGIs $50k-75k, 55.4% for AGIs $75k-100k, 52.6% for AGIs $100k-200k, 75.0% for AGIs over 200k)
Averages for the 2004 tax year for zip code 44052, filed in 2005:
Average Adjusted Gross Income (AGI) in 2004: $30,213 (Individual Income Tax Returns)
Here:
$30,213
State:
$44,480
Salary/wage: $27,714 (reported on 88.0% of returns)
Here:
$27,714
State:
$39,198
(% of AGI for various income ranges: 86.1% for AGIs below $10k, 78.3% for AGIs $10k-25k, 82.8% for AGIs $25k-50k, 84.9% for AGIs $50k-75k, 86.4% for AGIs $75k-100k, 63.8% for AGIs over 100k)
Taxable interest for individuals: $1,148 (reported on 30.7% of returns)
This zip code:
$1,148
Ohio:
$1,532
(% of AGI for various income ranges: 2.1% for AGIs below $10k, 1.6% for AGIs $10k-25k, 1.0% for AGIs $25k-50k, 0.8% for AGIs $50k-75k, 0.9% for AGIs $75k-100k, 1.7% for AGIs over 100k)
Taxable dividends: $2,191 (reported on 14.1% of returns)
Here:
$2,191
State:
$3,496
(% of AGI for various income ranges: 1.1% for AGIs below $10k, 0.9% for AGIs $10k-25k, 0.6% for AGIs $25k-50k, 0.6% for AGIs $50k-75k, 0.8% for AGIs $75k-100k, 3.5% for AGIs over 100k)
Net capital gain/loss: +$3,822 (reported on 8.5% of returns)
Here:
+$3,822
State:
+$8,582
(% of AGI for various income ranges: -0.4% for AGIs below $10k, 0.1% for AGIs $10k-25k, 0.3% for AGIs $25k-50k, 0.5% for AGIs $50k-75k, 0.4% for AGIs $75k-100k, 6.8% for AGIs over 100k)
Profit/loss from business: +$5,653 (reported on 7.3% of returns)
Here:
+$5,653
State:
+$10,813
(% of AGI for various income ranges: 3.7% for AGIs below $10k, 2.2% for AGIs $10k-25k, 1.1% for AGIs $25k-50k, 0.6% for AGIs $50k-75k, 1.0% for AGIs $75k-100k, 1.9% for AGIs over 100k)
IRA payment deduction: $2,200 (reported on 1.4% of returns)
44052:
$2,200
Ohio:
$2,794
(% of AGI for various income ranges: 0.1% for AGIs $10k-25k, 0.1% for AGIs $25k-50k, 0.1% for AGIs $50k-75k, 0.1% for AGIs $75k-100k, 0.1% for AGIs over 100k)
Self-employed pension: $10,467 (reported on 0.1% of returns)
Here:
$10,467
Ohio:
$13,981
Total itemized deductions: $12,955 (22% of AGI, reported on 23.4% of returns)
Here:
$12,955
State:
$17,503
Here:
22.3% of AGI
State:
20.8% of AGI
(% of AGI for various income ranges: 4.8% for AGIs below $10k, 5.4% for AGIs $10k-25k, 9.6% for AGIs $25k-50k, 11.8% for AGIs $50k-75k, 12.3% for AGIs $75k-100k, 14.1% for AGIs over 100k)
Charity contributions deductions: $2,080 (3% of AGI, reported on 19.0% of returns)
Here:
$2,080
State:
$3,087
Here:
3.4% of AGI
State:
3.4% of AGI
(% of AGI for various income ranges: 0.2% for AGIs below $10k, 0.4% for AGIs $10k-25k, 1.0% for AGIs $25k-50k, 1.4% for AGIs $50k-75k, 1.6% for AGIs $75k-100k, 3.2% for AGIs over 100k)
Total tax: $3,797 (reported on 66.2% of returns)
44052:
$3,797
State:
$6,781
(% of AGI for various income ranges: 1.4% for AGIs below $10k, 3.2% for AGIs $10k-25k, 6.8% for AGIs $25k-50k, 9.5% for AGIs $50k-75k, 11.1% for AGIs $75k-100k, 16.7% for AGIs over 100k)
Earned income credit: $1,794 (reported on 26.0% of returns)
Here:
$1,794
State:
$1,696
Percentage of individuals using paid preparers for their 2004 taxes: 58.4%
Here:
58%
State:
55%
(% for various income ranges: 55.7% for AGIs below $10k, 60.4% for AGIs $10k-25k, 58.5% for AGIs $25k-50k, 58.2% for AGIs $50k-75k, 57.3% for AGIs $75k-100k, 63.0% for AGIs over 100k)
Likely homosexual households (counted as self-reported same-sex unmarried-partner households)
Lesbian couples: 0.1% of all households
Gay men: 0.1% of all households
Household received Food Stamps/SNAP in the past 12 months: 3,157 Household did not receive Food Stamps/SNAP in the past 12 months: 8,711
Women who had a birth in the past 12 months: 780 (339 now married, 431 unmarried) Women who did not have a birth in the past 12 months: 5,374 (1,494 now married, 3,882 unmarried)
Housing units in zip code 44052 with a mortgage: 3,560 (330 second mortgage, 18 home equity loan, 255 both second mortgage and home equity loan) Houses without a mortgage: 231
Median monthly owner costs for units with a mortgage: $955 Median monthly owner costs for units without a mortgage: $446
Residents with income below the poverty level in 2022:
This zip code:
32.4%
Whole state:
13.4%
Residents with income below 50% of the poverty level in 2022:
This zip code:
17.9%
Whole state:
7.0%
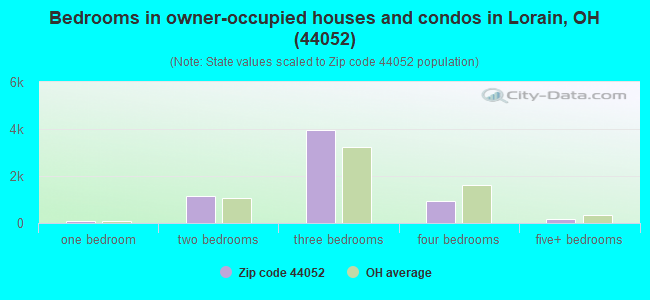
Median number of rooms in houses and condos:
Here:
6.1
State:
6.7
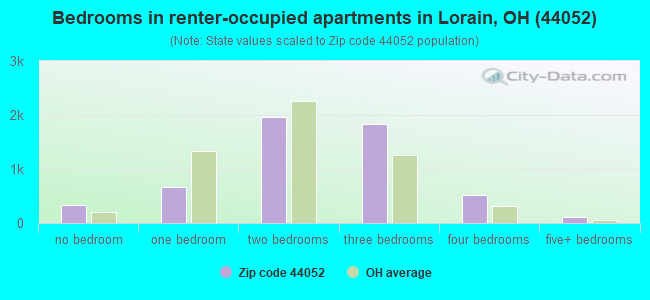
Median number of rooms in apartments:
Here:
5.1
State:
4.4
Notable locations in this zip code not listed on our city pages
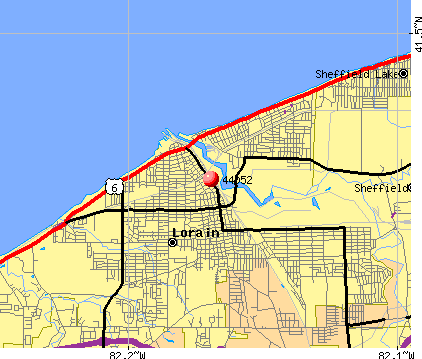
Notable locations in zip code 44052: Spitzers Marina (A), Hot Waters Marina (B), Lorain Yacht Club (C), Lorain Lighthouse (D), Black River Wastewater Treatment Plant (E), Lifecare Ambulance Service Station 2 (F), Sheffield Township Fire Department Station 1 (G), Lorain Public Library (H), Palace Civic Center (I), Lorain Fire Department Station 4 (J), Nativity Manor (K), Lorain City Hall (L), Lorain Fire Department Central Station (M), East Breakwater Middle Light (N), West Breakwater Light (O), John F Kennedy Plaza (P), Lakeview Plaza (Q). Display/hide their locations on the map
Churches in zip code 44052 include: Full Gospel Tabernacle (A), Faith United Methodist Church (B), Christian Pentecostal Church (C), Spanish Pentecostal Church (D), First Spanish Evangelical Disciples of Christ Church (E), Saint Joseph Roman Catholic Church (F), Nativity Blessed Virgin Mary Roman Catholic Church (G), New Mount Calvary Baptist Church (H), Second Baptist Church (I). Display/hide their locations on the map
Parks in zip code 44052 include: Century Park (1), Central Park (2), Hoy-Lo-Mae Park (3), Elmwood Park (4), Sunny Acres Park (5), George Daniel Field (6), Riverside Park (7), G Street Park (8), Washington Park (9). Display/hide their locations on the map
2,462 married couples with children.
4,015 single-parent households (323 men, 3,692 women).
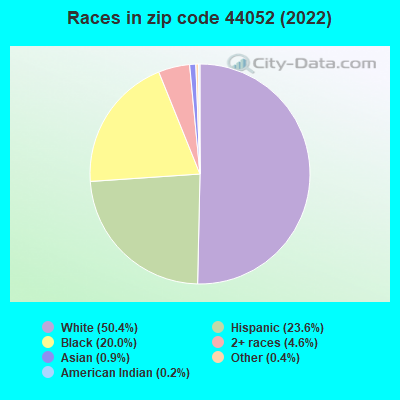
86.1% of residents of 44052 zip code speak English at home.
12.9% of residents speak Spanish at home (55% very well, 20% well, 20% not well, 5% not at all).
1.2% of residents speak other Indo-European language at home (49% very well, 39% well, 13% not well).
0.1% of residents speak Asian or Pacific Island language at home (15% very well, 85% well).
0.1% of residents speak other language at home (66% very well, 34% not well).
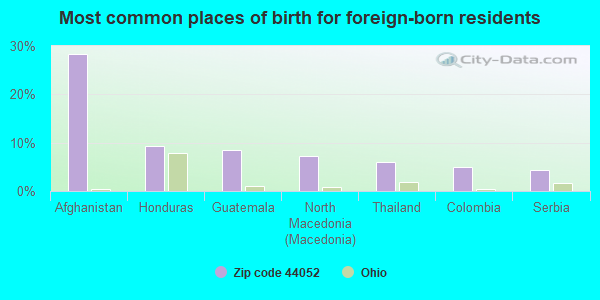
Foreign born population: 753 (2.7%) (64.6% of them are naturalized citizens)
Facilities with environmental interests located in this zip code:
ADMIRAL KING HIGH SCHOOL (2600 ASHLAND AVE in LORAIN, OH)
(National Center for Education Statistics) - STATE ID-019059 STATE MASTER (Ohio general info) - AIR MAJOR Small Quantity Generators, between 100 kg and 1000 kg of hazardous waste/month (Resource Conservation and Recovery Act (tracking hazardous waste)) - notification Organizations: SCHLACHTER ROSCOE (CONTACT/OWNER)
, LORAIN CITY SD (SCHOOL DISTRICT)
AT&T LONG LINES LORAIN (APPROX 4.5 MI S OF LORAIN in LORAIN, OH)
STATE MASTER (Ohio general info) - RCRA-OHT400013850, HAZARDOUS WASTE PROGRAM (Resource Conservation and Recovery Act (tracking hazardous waste)) Organizations: UNKNOWN (CONTACT/OWNER)
Alternative names: AT&T LONG LINES LORAIN OH
ANGELICA HEALTHCARE SERVICE GROUP (1820 IOWA AVENUE in LORAIN, OH)
STATE MASTER (Ohio general info) - AIR MAJOR, EPCRA Small Quantity Generators, between 100 kg and 1000 kg of hazardous waste/month (Resource Conservation and Recovery Act (tracking hazardous waste)) - notification Organizations: ANGELICA CORP (CONTACT/OWNER)
Alternative names: ANGELICA HEALTH CARE SERVICES GROUP, ANGELICA TEXTILE SERVICES
BP OIL CO SITE 05198 (1704 HENDERON DR in LORAIN, OH)
STATE MASTER (Ohio general info) - RCRA-OHD987024452, HAZARDOUS WASTE PROGRAM, AIR MAJOR, -47-5541-905-3, EPCRA Conditionally Exempt Small Quantity Generators, less than 100 kg/month of hazardous waste (Resource Conservation and Recovery Act (tracking hazardous waste)) - notification Organizations: BP OIL COMPANY (CONTACT/OWNER)
7-ELEVEN STORE #60 (3054 N. LEAVITT RD. in LORAIN, OH)
AIR MINOR (AIRS/AFS) Business SIC classification: GASOLINE SERVICE STATIONS Alternative names: 7-11FOOD STORE #56660
BJ'S WHOLESALE CLUB (38292 COLORADO AVE in LORAIN, OH)
AIR MINOR (AIRS/AFS) Business SIC classification: GASOLINE SERVICE STATIONS
BLUE DIAMOND CITGO (3451 COLORADO AVE. in LORAIN, OH)
AIR MINOR (AIRS/AFS) Business SIC classification: GASOLINE SERVICE STATIONS
Housing units lacking complete plumbing facilities: 3.1% Housing units lacking complete kitchen facilities: 3.3%
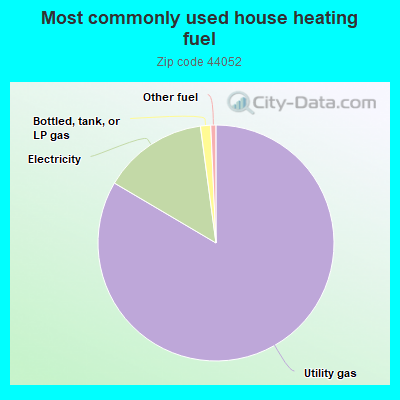
82.9%Utility gas
14.3%Electricity
1.4%Bottled, tank, or LP gas
0.7%Other fuel
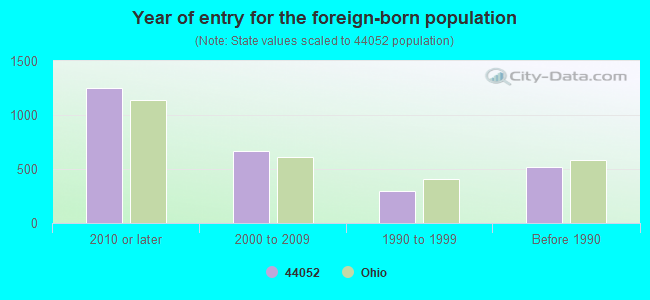
Population in 1990: 35,989.
Place of birth for U.S.-born residents:
This state: 21,198
Northeast: 1,527
Midwest: 483
South: 2,006
West: 325
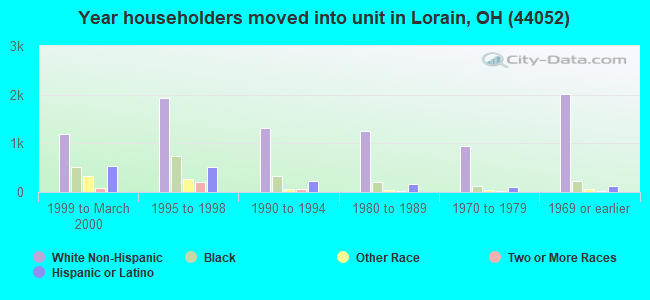
57% of the 44052 zip code residents lived in the same house 5 years ago. Out of people who lived in different houses, 79% lived in this county. Out of people who lived in different counties, 50% lived in Ohio.
92% of the 44052 zip code residents lived in the same house 1 year ago. Out of people who lived in different houses, 66% moved from this county. Out of people who lived in different houses, 24% moved from different county within same state. Out of people who lived in different houses, 8% moved from different state. Out of people who lived in different houses, 2% moved from abroad.
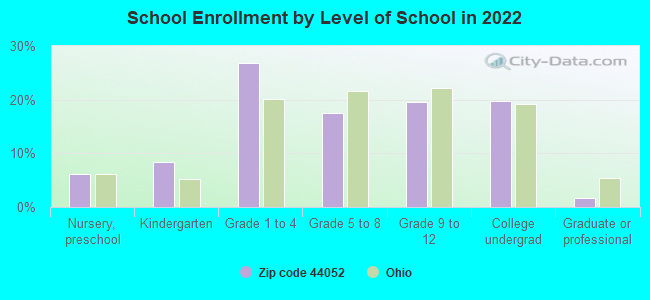
Private vs. public school enrollment:
Students in private schools in grades 1 to 8 (elementary and middle school): 570
Here:
21.1%
Ohio:
16.0%
Students in private schools in grades 9 to 12 (high school): 94
Here:
8.0%
Ohio:
13.1%
Students in private undergraduate colleges: 335
Here:
27.9%
Ohio:
22.3%
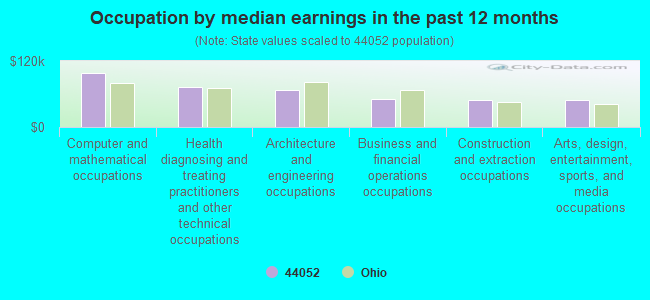
Occupation by median earnings in the past 12 months ($)
97,756Computer and mathematical occupations
71,904Health diagnosing and treating practitioners and other technical occupations
67,324Architecture and engineering occupations
51,456Business and financial operations occupations
49,933Construction and extraction occupations
49,190Arts, design, entertainment, sports, and media occupations
Companies with federal contracts located in this zip code (LORAIN, OH):
VICTOR J. MONZ JR. (150 EAST 8TH STREET; small business) : $182,150 in 2 contractsfrom 1999 to 2000
$110,150 with U.S. Army Corps of Engineers - civil program financing only for Maintenance, Repair or Alteration of Real Property -- Other Non-Building Facilities. Signed on 2000-02-11. Completion date: 1999-12-31.
$72,000, same as above.Signed on 1999-12-15. Completion date: 1999-12-31.
MARCONI COMMUNICATIONS (1122 F STREET) : $44,897 in 5 contractsfrom 2003 to 2005
Contracts for Telephone and Telegraph Equipment, Other ADP and Telecommunications Services (includes data storage on tapes, compact disks, etc.), Maintenance, Repair and Rebuilding of Equipment -- Communication, Detection, and Coherent Radiation Equipment, Radio and Television Communication Equipment, Except Airborne by Army, Air Force Signed by year:2000: $0; 2001: $0; 2002: $0; 2003: $18,435; 2004: $20,304; 2005: $6,158; 2006: $0.
Biggest contracts:
$18,435 with Army for Telephone and Telegraph Equipment. Signed on 2003-08-18. Completion date: 2003-10-07.
$8,849 with Army for Other ADP and Telecommunications Services (includes data storage on tapes, compact disks, etc.). Taking place in DC. Signed on 2004-09-17. Completion date: 2005-09-03.
$6,675 with Air Force for Maintenance, Repair and Rebuilding of Equipment -- Communication, Detection, and Coherent Radiation Equipment. Taking place in CO. Signed on 2004-10-01. Completion date: 2005-09-30.
$6,158 with Army for Other ADP and Telecommunications Services (includes data storage on tapes, compact disks, etc.). Taking place in DC. Signed on 2005-08-16. Effective on 2005-07-12. Completion date: 2006-09-03.
MARCONI COMMUNICATIONS HOLDING (1122 F ST; small business)
$30,875 with Army for Miscellaneous Communication Equipment. Signed on 2000-09-25. Completion date: 2000-10-27.
CENTURYTEL OF OHIO, INC (203 WEST 9TH ST; small business) : $16,352 in 3 contractsfrom 2001 to 2005
$13,881 with Department of Defense for ADP Telecommunications and Transmission Services. Signed on 2001-10-31. Completion date: 2003-09-24.
$2,471 with Air Force for ADP Telecommunications and Transmission Services. Taking place in OK. Signed on 2005-09-20. Completion date: 2005-09-30.
$0 with Department of Defense for ADP Telecommunications and Transmission Services. Signed on 2001-10-31. Completion date: 2003-09-24.
WILLIAMS, CHARLES (1635 LEHIGH AVE; small business) : $10,770 in 3 contractsin 2005
$4,200 with Army for Custodial Janitorial Services. Signed on 2005-12-01. Completion date: 2006-09-30.
$4,100 with Army for Custodial Janitorial Services. Taking place in PA. Signed on 2005-12-22. Completion date: 2006-09-30.
$2,470, same as above.Signed on 2005-12-14. Completion date: 2006-09-30.
CENTURYTEL OF MICHIGAN, INC (203 WEST 9TH ST) : $7,860 in 5 contractsfrom 2001 to 2006
Contracts for ADP Telecommunications and Transmission Services, by Defense Information Systems Agency, Nuclear Regulatory Commission, Department of Defense Signed by year:2000: $0; 2001: $780; 2002: $0; 2003: $3,710; 2004: $0; 2005: $3,346; 2006: $24.
Biggest contracts:
$3,710 with Defense Information Systems Agency for ADP Telecommunications and Transmission Services. Signed on 2003-11-30. Completion date: 2013-10-12.
$3,346 with Nuclear Regulatory Commission for . Signed on 2005-01-12. Effective on 2005-02-01. Completion date: 2006-01-31.
$780 with Department of Defense for ADP Telecommunications and Transmission Services. Taking place in MI. Signed on 2001-06-30. Completion date: 2012-05-02.
$24 with Nuclear Regulatory Commission for . Signed on 2006-04-20. Effective on 2005-02-01. Completion date: 2006-01-31.
Top industries in this zip code by the number of employees in 2005:
2003 - 2018 National Fire Incident Reporting System (NFIRS) incidents
Based on the data from the years 2003 - 2018 the average number of fires per year is 278. The highest number of reported fire incidents - 363 took place in 2012, and the least - 187 in 2005. The data has a dropping trend.
When looking into fire subcategories, the most reports belonged to: Outside Fires (42.0%), and Structure Fires (40.1%).
Fire incident types reported to NFIRS in Zip Code 44052


 Nearest zip codes: 44055, 44053, 44054, 44035, 44001, 44012.
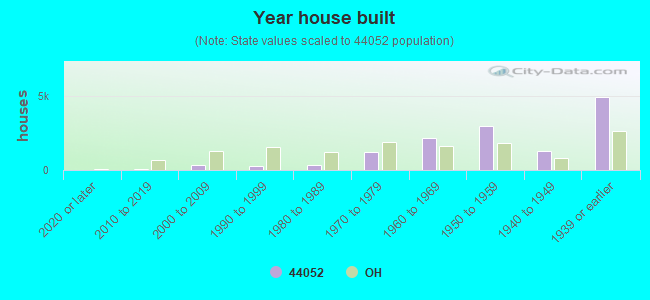


 Based on the data from the years 2003 - 2018 the average number of fires per year is 278. The highest number of reported fire incidents - 363 took place in 2012, and the least - 187 in 2005. The data has a dropping trend.
 When looking into fire subcategories, the most reports belonged to: Outside Fires (42.0%), and Structure Fires (40.1%).