Estimated zip code population in 2022: 20,939
Zip code population in 2010: 18,256
Zip code population in 2000: 17,193
Houses and condos: 9,425
Renter-occupied apartments: 3,225
% of renters here:
36%State:
33%
March 2022 cost of living index in zip code 44053: 93.6
(less than average, U.S. average is 100)
Land area: 11.9
sq. mi.
Water area: 0.8
sq. mi.
Population density: 1,765 people per square mile (low).
OSM Map
General Map
Google Map
MSN Map
OSM Map
General Map
Google Map
MSN Map
OSM Map
General Map
Google Map
MSN Map
OSM Map
General Map
Google Map
MSN Map
Please wait while loading the map...
Real estate property taxes paid for housing units in 2022:
This zip code:
1.2% ($2,347)Ohio:
1.3% ($2,639)
Median real estate property taxes paid for housing units with mortgages in 2022: $2,475 (1.1%)
Median real estate property taxes paid for housing units with no mortgage in 2022: $2,177 (1.3%)
Profiles of local businesses
Business Search - 14 Million verified businesses
Males: 10,451 Females: 10,488
For population 25 years and over in 44053:
High school or higher: 89.1%Bachelor's degree or higher: 21.1%Graduate or professional degree: 8.0%Unemployed: 2.1%Mean travel time to work (commute): 24.2 minutes
For population 15 years and over in 44053:
Never married: 34.6%Now married: 46.7%Separated: 1.9%Widowed: 5.3%Divorced: 11.5%
Zip code 44053 compared to state average:
Unemployed percentage below state average. Hispanic race population percentage significantly above state average. Foreign-born population percentage significantly below state average. Length of stay since moving in significantly above state average. House age below state average. 12,900 61.6% White 4,847 23.2% Hispanic or Latino 2,244 10.7% Black 744 3.6% Two or more races 118 0.6% Some other race 44 0.2% American Indian 38 0.2% Asian
Data:
Median household income ($)
Median household income (% change since 2000)
Household income diversity
Ratio of average income to average house value (%)
Ratio of average income to average rent
Median household income ($) - White
Median household income ($) - Black or African American
Median household income ($) - Asian
Median household income ($) - Hispanic or Latino
Median household income ($) - American Indian and Alaska Native
Median household income ($) - Multirace
Median household income ($) - Other Race
Median household income for houses/condos with a mortgage ($)
Median household income for apartments without a mortgage ($)
Races - White alone (%)
Races - White alone (% change since 2000)
Races - Black alone (%)
Races - Black alone (% change since 2000)
Races - American Indian alone (%)
Races - American Indian alone (% change since 2000)
Races - Asian alone (%)
Races - Asian alone (% change since 2000)
Races - Hispanic (%)
Races - Hispanic (% change since 2000)
Races - Native Hawaiian and Other Pacific Islander alone (%)
Races - Native Hawaiian and Other Pacific Islander alone (% change since 2000)
Races - Two or more races (%)
Races - Two or more races (% change since 2000)
Races - Other race alone (%)
Races - Other race alone (% change since 2000)
Racial diversity
Unemployment (%)
Unemployment (% change since 2000)
Unemployment (%) - White
Unemployment (%) - Black or African American
Unemployment (%) - Asian
Unemployment (%) - Hispanic or Latino
Unemployment (%) - American Indian and Alaska Native
Unemployment (%) - Multirace
Unemployment (%) - Other Race
Population density (people per square mile)
Population - Males (%)
Population - Females (%)
Population - Males (%) - White
Population - Males (%) - Black or African American
Population - Males (%) - Asian
Population - Males (%) - Hispanic or Latino
Population - Males (%) - American Indian and Alaska Native
Population - Males (%) - Multirace
Population - Males (%) - Other Race
Population - Females (%) - White
Population - Females (%) - Black or African American
Population - Females (%) - Asian
Population - Females (%) - Hispanic or Latino
Population - Females (%) - American Indian and Alaska Native
Population - Females (%) - Multirace
Population - Females (%) - Other Race
Coronavirus confirmed cases (Apr 27, 2024)
Deaths caused by coronavirus (Apr 27, 2024)
Coronavirus confirmed cases (per 100k population) (Apr 27, 2024)
Deaths caused by coronavirus (per 100k population) (Apr 27, 2024)
Daily increase in number of cases (Apr 27, 2024)
Weekly increase in number of cases (Apr 27, 2024)
Cases doubled (in days) (Apr 27, 2024)
Hospitalized patients (Apr 18, 2022)
Negative test results (Apr 18, 2022)
Total test results (Apr 18, 2022)
COVID Vaccine doses distributed (per 100k population) (Sep 19, 2023)
COVID Vaccine doses administered (per 100k population) (Sep 19, 2023)
COVID Vaccine doses distributed (Sep 19, 2023)
COVID Vaccine doses administered (Sep 19, 2023)
Likely homosexual households (%)
Likely homosexual households (% change since 2000)
Likely homosexual households - Lesbian couples (%)
Likely homosexual households - Lesbian couples (% change since 2000)
Likely homosexual households - Gay men (%)
Likely homosexual households - Gay men (% change since 2000)
Cost of living index
Median gross rent ($)
Median contract rent ($)
Median monthly housing costs ($)
Median house or condo value ($)
Median house or condo value ($ change since 2000)
Mean house or condo value by units in structure - 1, detached ($)
Mean house or condo value by units in structure - 1, attached ($)
Mean house or condo value by units in structure - 2 ($)
Mean house or condo value by units in structure by units in structure - 3 or 4 ($)
Mean house or condo value by units in structure - 5 or more ($)
Mean house or condo value by units in structure - Boat, RV, van, etc. ($)
Mean house or condo value by units in structure - Mobile home ($)
Median house or condo value ($) - White
Median house or condo value ($) - Black or African American
Median house or condo value ($) - Asian
Median house or condo value ($) - Hispanic or Latino
Median house or condo value ($) - American Indian and Alaska Native
Median house or condo value ($) - Multirace
Median house or condo value ($) - Other Race
Median resident age
Resident age diversity
Median resident age - Males
Median resident age - Females
Median resident age - White
Median resident age - Black or African American
Median resident age - Asian
Median resident age - Hispanic or Latino
Median resident age - American Indian and Alaska Native
Median resident age - Multirace
Median resident age - Other Race
Median resident age - Males - White
Median resident age - Males - Black or African American
Median resident age - Males - Asian
Median resident age - Males - Hispanic or Latino
Median resident age - Males - American Indian and Alaska Native
Median resident age - Males - Multirace
Median resident age - Males - Other Race
Median resident age - Females - White
Median resident age - Females - Black or African American
Median resident age - Females - Asian
Median resident age - Females - Hispanic or Latino
Median resident age - Females - American Indian and Alaska Native
Median resident age - Females - Multirace
Median resident age - Females - Other Race
Commute - mean travel time to work (minutes)
Travel time to work - Less than 5 minutes (%)
Travel time to work - Less than 5 minutes (% change since 2000)
Travel time to work - 5 to 9 minutes (%)
Travel time to work - 5 to 9 minutes (% change since 2000)
Travel time to work - 10 to 19 minutes (%)
Travel time to work - 10 to 19 minutes (% change since 2000)
Travel time to work - 20 to 29 minutes (%)
Travel time to work - 20 to 29 minutes (% change since 2000)
Travel time to work - 30 to 39 minutes (%)
Travel time to work - 30 to 39 minutes (% change since 2000)
Travel time to work - 40 to 59 minutes (%)
Travel time to work - 40 to 59 minutes (% change since 2000)
Travel time to work - 60 to 89 minutes (%)
Travel time to work - 60 to 89 minutes (% change since 2000)
Travel time to work - 90 or more minutes (%)
Travel time to work - 90 or more minutes (% change since 2000)
Marital status - Never married (%)
Marital status - Now married (%)
Marital status - Separated (%)
Marital status - Widowed (%)
Marital status - Divorced (%)
Median family income ($)
Median family income (% change since 2000)
Median non-family income ($)
Median non-family income (% change since 2000)
Median per capita income ($)
Median per capita income (% change since 2000)
Median family income ($) - White
Median family income ($) - Black or African American
Median family income ($) - Asian
Median family income ($) - Hispanic or Latino
Median family income ($) - American Indian and Alaska Native
Median family income ($) - Multirace
Median family income ($) - Other Race
Median year house/condo built
Median year apartment built
Year house built - Built 2005 or later (%)
Year house built - Built 2000 to 2004 (%)
Year house built - Built 1990 to 1999 (%)
Year house built - Built 1980 to 1989 (%)
Year house built - Built 1970 to 1979 (%)
Year house built - Built 1960 to 1969 (%)
Year house built - Built 1950 to 1959 (%)
Year house built - Built 1940 to 1949 (%)
Year house built - Built 1939 or earlier (%)
Average household size
Household density (households per square mile)
Average household size - White
Average household size - Black or African American
Average household size - Asian
Average household size - Hispanic or Latino
Average household size - American Indian and Alaska Native
Average household size - Multirace
Average household size - Other Race
Occupied housing units (%)
Vacant housing units (%)
Owner occupied housing units (%)
Renter occupied housing units (%)
Vacancy status - For rent (%)
Vacancy status - For sale only (%)
Vacancy status - Rented or sold, not occupied (%)
Vacancy status - For seasonal, recreational, or occasional use (%)
Vacancy status - For migrant workers (%)
Vacancy status - Other vacant (%)
Residents with income below the poverty level (%)
Residents with income below 50% of the poverty level (%)
Children below poverty level (%)
Poor families by family type - Married-couple family (%)
Poor families by family type - Male, no wife present (%)
Poor families by family type - Female, no husband present (%)
Poverty status for native-born residents (%)
Poverty status for foreign-born residents (%)
Poverty among high school graduates not in families (%)
Poverty among people who did not graduate high school not in families (%)
Residents with income below the poverty level (%) - White
Residents with income below the poverty level (%) - Black or African American
Residents with income below the poverty level (%) - Asian
Residents with income below the poverty level (%) - Hispanic or Latino
Residents with income below the poverty level (%) - American Indian and Alaska Native
Residents with income below the poverty level (%) - Multirace
Residents with income below the poverty level (%) - Other Race
Air pollution - Air Quality Index (AQI)
Air pollution - CO
Air pollution - NO2
Air pollution - SO2
Air pollution - Ozone
Air pollution - PM10
Air pollution - PM25
Air pollution - Pb
Crime - Murders per 100,000 population
Crime - Rapes per 100,000 population
Crime - Robberies per 100,000 population
Crime - Assaults per 100,000 population
Crime - Burglaries per 100,000 population
Crime - Thefts per 100,000 population
Crime - Auto thefts per 100,000 population
Crime - Arson per 100,000 population
Crime - City-data.com crime index
Crime - Violent crime index
Crime - Property crime index
Crime - Murders per 100,000 population (5 year average)
Crime - Rapes per 100,000 population (5 year average)
Crime - Robberies per 100,000 population (5 year average)
Crime - Assaults per 100,000 population (5 year average)
Crime - Burglaries per 100,000 population (5 year average)
Crime - Thefts per 100,000 population (5 year average)
Crime - Auto thefts per 100,000 population (5 year average)
Crime - Arson per 100,000 population (5 year average)
Crime - City-data.com crime index (5 year average)
Crime - Violent crime index (5 year average)
Crime - Property crime index (5 year average)
1996 Presidential Elections Results (%) - Democratic Party (Clinton)
1996 Presidential Elections Results (%) - Republican Party (Dole)
1996 Presidential Elections Results (%) - Other
2000 Presidential Elections Results (%) - Democratic Party (Gore)
2000 Presidential Elections Results (%) - Republican Party (Bush)
2000 Presidential Elections Results (%) - Other
2004 Presidential Elections Results (%) - Democratic Party (Kerry)
2004 Presidential Elections Results (%) - Republican Party (Bush)
2004 Presidential Elections Results (%) - Other
2008 Presidential Elections Results (%) - Democratic Party (Obama)
2008 Presidential Elections Results (%) - Republican Party (McCain)
2008 Presidential Elections Results (%) - Other
2012 Presidential Elections Results (%) - Democratic Party (Obama)
2012 Presidential Elections Results (%) - Republican Party (Romney)
2012 Presidential Elections Results (%) - Other
2016 Presidential Elections Results (%) - Democratic Party (Clinton)
2016 Presidential Elections Results (%) - Republican Party (Trump)
2016 Presidential Elections Results (%) - Other
2020 Presidential Elections Results (%) - Democratic Party (Biden)
2020 Presidential Elections Results (%) - Republican Party (Trump)
2020 Presidential Elections Results (%) - Other
Ancestries Reported - Arab (%)
Ancestries Reported - Czech (%)
Ancestries Reported - Danish (%)
Ancestries Reported - Dutch (%)
Ancestries Reported - English (%)
Ancestries Reported - French (%)
Ancestries Reported - French Canadian (%)
Ancestries Reported - German (%)
Ancestries Reported - Greek (%)
Ancestries Reported - Hungarian (%)
Ancestries Reported - Irish (%)
Ancestries Reported - Italian (%)
Ancestries Reported - Lithuanian (%)
Ancestries Reported - Norwegian (%)
Ancestries Reported - Polish (%)
Ancestries Reported - Portuguese (%)
Ancestries Reported - Russian (%)
Ancestries Reported - Scotch-Irish (%)
Ancestries Reported - Scottish (%)
Ancestries Reported - Slovak (%)
Ancestries Reported - Subsaharan African (%)
Ancestries Reported - Swedish (%)
Ancestries Reported - Swiss (%)
Ancestries Reported - Ukrainian (%)
Ancestries Reported - United States (%)
Ancestries Reported - Welsh (%)
Ancestries Reported - West Indian (%)
Ancestries Reported - Other (%)
Educational Attainment - No schooling completed (%)
Educational Attainment - Less than high school (%)
Educational Attainment - High school or equivalent (%)
Educational Attainment - Less than 1 year of college (%)
Educational Attainment - 1 or more years of college (%)
Educational Attainment - Associate degree (%)
Educational Attainment - Bachelor's degree (%)
Educational Attainment - Master's degree (%)
Educational Attainment - Professional school degree (%)
Educational Attainment - Doctorate degree (%)
School Enrollment - Nursery, preschool (%)
School Enrollment - Kindergarten (%)
School Enrollment - Grade 1 to 4 (%)
School Enrollment - Grade 5 to 8 (%)
School Enrollment - Grade 9 to 12 (%)
School Enrollment - College undergrad (%)
School Enrollment - Graduate or professional (%)
School Enrollment - Not enrolled in school (%)
School enrollment - Public schools (%)
School enrollment - Private schools (%)
School enrollment - Not enrolled (%)
Median number of rooms in houses and condos
Median number of rooms in apartments
Housing units lacking complete plumbing facilities (%)
Housing units lacking complete kitchen facilities (%)
Density of houses
Urban houses (%)
Rural houses (%)
Households with people 60 years and over (%)
Households with people 65 years and over (%)
Households with people 75 years and over (%)
Households with one or more nonrelatives (%)
Households with no nonrelatives (%)
Population in households (%)
Family households (%)
Nonfamily households (%)
Population in families (%)
Family households with own children (%)
Median number of bedrooms in owner occupied houses
Mean number of bedrooms in owner occupied houses
Median number of bedrooms in renter occupied houses
Mean number of bedrooms in renter occupied houses
Median number of vehichles in owner occupied houses
Mean number of vehichles in owner occupied houses
Median number of vehichles in renter occupied houses
Mean number of vehichles in renter occupied houses
Mortgage status - with mortgage (%)
Mortgage status - with second mortgage (%)
Mortgage status - with home equity loan (%)
Mortgage status - with both second mortgage and home equity loan (%)
Mortgage status - without a mortgage (%)
Average family size
Average family size - White
Average family size - Black or African American
Average family size - Asian
Average family size - Hispanic or Latino
Average family size - American Indian and Alaska Native
Average family size - Multirace
Average family size - Other Race
Geographical mobility - Same house 1 year ago (%)
Geographical mobility - Moved within same county (%)
Geographical mobility - Moved from different county within same state (%)
Geographical mobility - Moved from different state (%)
Geographical mobility - Moved from abroad (%)
Place of birth - Born in state of residence (%)
Place of birth - Born in other state (%)
Place of birth - Native, outside of US (%)
Place of birth - Foreign born (%)
Housing units in structures - 1, detached (%)
Housing units in structures - 1, attached (%)
Housing units in structures - 2 (%)
Housing units in structures - 3 or 4 (%)
Housing units in structures - 5 to 9 (%)
Housing units in structures - 10 to 19 (%)
Housing units in structures - 20 to 49 (%)
Housing units in structures - 50 or more (%)
Housing units in structures - Mobile home (%)
Housing units in structures - Boat, RV, van, etc. (%)
House/condo owner moved in on average (years ago)
Renter moved in on average (years ago)
Year householder moved into unit - Moved in 1999 to March 2000 (%)
Year householder moved into unit - Moved in 1995 to 1998 (%)
Year householder moved into unit - Moved in 1990 to 1994 (%)
Year householder moved into unit - Moved in 1980 to 1989 (%)
Year householder moved into unit - Moved in 1970 to 1979 (%)
Year householder moved into unit - Moved in 1969 or earlier (%)
Means of transportation to work - Drove car alone (%)
Means of transportation to work - Carpooled (%)
Means of transportation to work - Public transportation (%)
Means of transportation to work - Bus or trolley bus (%)
Means of transportation to work - Streetcar or trolley car (%)
Means of transportation to work - Subway or elevated (%)
Means of transportation to work - Railroad (%)
Means of transportation to work - Ferryboat (%)
Means of transportation to work - Taxicab (%)
Means of transportation to work - Motorcycle (%)
Means of transportation to work - Bicycle (%)
Means of transportation to work - Walked (%)
Means of transportation to work - Other means (%)
Working at home (%)
Industry diversity
Most Common Industries - Agriculture, forestry, fishing and hunting, and mining (%)
Most Common Industries - Agriculture, forestry, fishing and hunting (%)
Most Common Industries - Mining, quarrying, and oil and gas extraction (%)
Most Common Industries - Construction (%)
Most Common Industries - Manufacturing (%)
Most Common Industries - Wholesale trade (%)
Most Common Industries - Retail trade (%)
Most Common Industries - Transportation and warehousing, and utilities (%)
Most Common Industries - Transportation and warehousing (%)
Most Common Industries - Utilities (%)
Most Common Industries - Information (%)
Most Common Industries - Finance and insurance, and real estate and rental and leasing (%)
Most Common Industries - Finance and insurance (%)
Most Common Industries - Real estate and rental and leasing (%)
Most Common Industries - Professional, scientific, and management, and administrative and waste management services (%)
Most Common Industries - Professional, scientific, and technical services (%)
Most Common Industries - Management of companies and enterprises (%)
Most Common Industries - Administrative and support and waste management services (%)
Most Common Industries - Educational services, and health care and social assistance (%)
Most Common Industries - Educational services (%)
Most Common Industries - Health care and social assistance (%)
Most Common Industries - Arts, entertainment, and recreation, and accommodation and food services (%)
Most Common Industries - Arts, entertainment, and recreation (%)
Most Common Industries - Accommodation and food services (%)
Most Common Industries - Other services, except public administration (%)
Most Common Industries - Public administration (%)
Occupation diversity
Most Common Occupations - Management, business, science, and arts occupations (%)
Most Common Occupations - Management, business, and financial occupations (%)
Most Common Occupations - Management occupations (%)
Most Common Occupations - Business and financial operations occupations (%)
Most Common Occupations - Computer, engineering, and science occupations (%)
Most Common Occupations - Computer and mathematical occupations (%)
Most Common Occupations - Architecture and engineering occupations (%)
Most Common Occupations - Life, physical, and social science occupations (%)
Most Common Occupations - Education, legal, community service, arts, and media occupations (%)
Most Common Occupations - Community and social service occupations (%)
Most Common Occupations - Legal occupations (%)
Most Common Occupations - Education, training, and library occupations (%)
Most Common Occupations - Arts, design, entertainment, sports, and media occupations (%)
Most Common Occupations - Healthcare practitioners and technical occupations (%)
Most Common Occupations - Health diagnosing and treating practitioners and other technical occupations (%)
Most Common Occupations - Health technologists and technicians (%)
Most Common Occupations - Service occupations (%)
Most Common Occupations - Healthcare support occupations (%)
Most Common Occupations - Protective service occupations (%)
Most Common Occupations - Fire fighting and prevention, and other protective service workers including supervisors (%)
Most Common Occupations - Law enforcement workers including supervisors (%)
Most Common Occupations - Food preparation and serving related occupations (%)
Most Common Occupations - Building and grounds cleaning and maintenance occupations (%)
Most Common Occupations - Personal care and service occupations (%)
Most Common Occupations - Sales and office occupations (%)
Most Common Occupations - Sales and related occupations (%)
Most Common Occupations - Office and administrative support occupations (%)
Most Common Occupations - Natural resources, construction, and maintenance occupations (%)
Most Common Occupations - Farming, fishing, and forestry occupations (%)
Most Common Occupations - Construction and extraction occupations (%)
Most Common Occupations - Installation, maintenance, and repair occupations (%)
Most Common Occupations - Production, transportation, and material moving occupations (%)
Most Common Occupations - Production occupations (%)
Most Common Occupations - Transportation occupations (%)
Most Common Occupations - Material moving occupations (%)
People in Group quarters - Institutionalized population (%)
People in Group quarters - Correctional institutions (%)
People in Group quarters - Federal prisons and detention centers (%)
People in Group quarters - Halfway houses (%)
People in Group quarters - Local jails and other confinement facilities (including police lockups) (%)
People in Group quarters - Military disciplinary barracks (%)
People in Group quarters - State prisons (%)
People in Group quarters - Other types of correctional institutions (%)
People in Group quarters - Nursing homes (%)
People in Group quarters - Hospitals/wards, hospices, and schools for the handicapped (%)
People in Group quarters - Hospitals/wards and hospices for chronically ill (%)
People in Group quarters - Hospices or homes for chronically ill (%)
People in Group quarters - Military hospitals or wards for chronically ill (%)
People in Group quarters - Other hospitals or wards for chronically ill (%)
People in Group quarters - Hospitals or wards for drug/alcohol abuse (%)
People in Group quarters - Mental (Psychiatric) hospitals or wards (%)
People in Group quarters - Schools, hospitals, or wards for the mentally retarded (%)
People in Group quarters - Schools, hospitals, or wards for the physically handicapped (%)
People in Group quarters - Institutions for the deaf (%)
People in Group quarters - Institutions for the blind (%)
People in Group quarters - Orthopedic wards and institutions for the physically handicapped (%)
People in Group quarters - Wards in general hospitals for patients who have no usual home elsewhere (%)
People in Group quarters - Wards in military hospitals for patients who have no usual home elsewhere (%)
People in Group quarters - Juvenile institutions (%)
People in Group quarters - Long-term care (%)
People in Group quarters - Homes for abused, dependent, and neglected children (%)
People in Group quarters - Residential treatment centers for emotionally disturbed children (%)
People in Group quarters - Training schools for juvenile delinquents (%)
People in Group quarters - Short-term care, detention or diagnostic centers for delinquent children (%)
People in Group quarters - Type of juvenile institution unknown (%)
People in Group quarters - Noninstitutionalized population (%)
People in Group quarters - College dormitories (includes college quarters off campus) (%)
People in Group quarters - Military quarters (%)
People in Group quarters - On base (%)
People in Group quarters - Barracks, unaccompanied personnel housing (UPH), (Enlisted/Officer), ;and similar group living quarters for military personnel (%)
People in Group quarters - Transient quarters for temporary residents (%)
People in Group quarters - Military ships (%)
People in Group quarters - Group homes (%)
People in Group quarters - Homes or halfway houses for drug/alcohol abuse (%)
People in Group quarters - Homes for the mentally ill (%)
People in Group quarters - Homes for the mentally retarded (%)
People in Group quarters - Homes for the physically handicapped (%)
People in Group quarters - Other group homes (%)
People in Group quarters - Religious group quarters (%)
People in Group quarters - Dormitories (%)
People in Group quarters - Agriculture workers' dormitories on farms (%)
People in Group quarters - Job Corps and vocational training facilities (%)
People in Group quarters - Other workers' dormitories (%)
People in Group quarters - Crews of maritime vessels (%)
People in Group quarters - Other nonhousehold living situations (%)
People in Group quarters - Other noninstitutional group quarters (%)
Residents speaking English at home (%)
Residents speaking English at home - Born in the United States (%)
Residents speaking English at home - Native, born elsewhere (%)
Residents speaking English at home - Foreign born (%)
Residents speaking Spanish at home (%)
Residents speaking Spanish at home - Born in the United States (%)
Residents speaking Spanish at home - Native, born elsewhere (%)
Residents speaking Spanish at home - Foreign born (%)
Residents speaking other language at home (%)
Residents speaking other language at home - Born in the United States (%)
Residents speaking other language at home - Native, born elsewhere (%)
Residents speaking other language at home - Foreign born (%)
Class of Workers - Employee of private company (%)
Class of Workers - Self-employed in own incorporated business (%)
Class of Workers - Private not-for-profit wage and salary workers (%)
Class of Workers - Local government workers (%)
Class of Workers - State government workers (%)
Class of Workers - Federal government workers (%)
Class of Workers - Self-employed workers in own not incorporated business and Unpaid family workers (%)
House heating fuel used in houses and condos - Utility gas (%)
House heating fuel used in houses and condos - Bottled, tank, or LP gas (%)
House heating fuel used in houses and condos - Electricity (%)
House heating fuel used in houses and condos - Fuel oil, kerosene, etc. (%)
House heating fuel used in houses and condos - Coal or coke (%)
House heating fuel used in houses and condos - Wood (%)
House heating fuel used in houses and condos - Solar energy (%)
House heating fuel used in houses and condos - Other fuel (%)
House heating fuel used in houses and condos - No fuel used (%)
House heating fuel used in apartments - Utility gas (%)
House heating fuel used in apartments - Bottled, tank, or LP gas (%)
House heating fuel used in apartments - Electricity (%)
House heating fuel used in apartments - Fuel oil, kerosene, etc. (%)
House heating fuel used in apartments - Coal or coke (%)
House heating fuel used in apartments - Wood (%)
House heating fuel used in apartments - Solar energy (%)
House heating fuel used in apartments - Other fuel (%)
House heating fuel used in apartments - No fuel used (%)
Armed forces status - In Armed Forces (%)
Armed forces status - Civilian (%)
Armed forces status - Civilian - Veteran (%)
Armed forces status - Civilian - Nonveteran (%)
Fatal accidents locations in years 2005-2021
Fatal accidents locations in 2005
Fatal accidents locations in 2006
Fatal accidents locations in 2007
Fatal accidents locations in 2008
Fatal accidents locations in 2009
Fatal accidents locations in 2010
Fatal accidents locations in 2011
Fatal accidents locations in 2012
Fatal accidents locations in 2013
Fatal accidents locations in 2014
Fatal accidents locations in 2015
Fatal accidents locations in 2016
Fatal accidents locations in 2017
Fatal accidents locations in 2018
Fatal accidents locations in 2019
Fatal accidents locations in 2020
Fatal accidents locations in 2021
Alcohol use - People drinking some alcohol every month (%)
Alcohol use - People not drinking at all (%)
Alcohol use - Average days/month drinking alcohol
Alcohol use - Average drinks/week
Alcohol use - Average days/year people drink much
Audiometry - Average condition of hearing (%)
Audiometry - People that can hear a whisper from across a quiet room (%)
Audiometry - People that can hear normal voice from across a quiet room (%)
Audiometry - Ears ringing, roaring, buzzing (%)
Audiometry - Had a job exposure to loud noise (%)
Audiometry - Had off-work exposure to loud noise (%)
Blood Pressure & Cholesterol - Has high blood pressure (%)
Blood Pressure & Cholesterol - Checking blood pressure at home (%)
Blood Pressure & Cholesterol - Frequently checking blood cholesterol (%)
Blood Pressure & Cholesterol - Has high cholesterol level (%)
Consumer Behavior - Money monthly spent on food at supermarket/grocery store
Consumer Behavior - Money monthly spent on food at other stores
Consumer Behavior - Money monthly spent on eating out
Consumer Behavior - Money monthly spent on carryout/delivered foods
Consumer Behavior - Income spent on food at supermarket/grocery store (%)
Consumer Behavior - Income spent on food at other stores (%)
Consumer Behavior - Income spent on eating out (%)
Consumer Behavior - Income spent on carryout/delivered foods (%)
Current Health Status - General health condition (%)
Current Health Status - Blood donors (%)
Current Health Status - Has blood ever tested for HIV virus (%)
Current Health Status - Left-handed people (%)
Dermatology - People using sunscreen (%)
Diabetes - Diabetics (%)
Diabetes - Had a blood test for high blood sugar (%)
Diabetes - People taking insulin (%)
Diet Behavior & Nutrition - Diet health (%)
Diet Behavior & Nutrition - Milk product consumption (# of products/month)
Diet Behavior & Nutrition - Meals not home prepared (#/week)
Diet Behavior & Nutrition - Meals from fast food or pizza place (#/week)
Diet Behavior & Nutrition - Ready-to-eat foods (#/month)
Diet Behavior & Nutrition - Frozen meals/pizza (#/month)
Drug Use - People that ever used marijuana or hashish (%)
Drug Use - Ever used hard drugs (%)
Drug Use - Ever used any form of cocaine (%)
Drug Use - Ever used heroin (%)
Drug Use - Ever used methamphetamine (%)
Health Insurance - People covered by health insurance (%)
Kidney Conditions-Urology - Avg. # of times urinating at night
Medical Conditions - People with asthma (%)
Medical Conditions - People with anemia (%)
Medical Conditions - People with psoriasis (%)
Medical Conditions - People with overweight (%)
Medical Conditions - Elderly people having difficulties in thinking or remembering (%)
Medical Conditions - People who ever received blood transfusion (%)
Medical Conditions - People having trouble seeing even with glass/contacts (%)
Medical Conditions - People with arthritis (%)
Medical Conditions - People with gout (%)
Medical Conditions - People with congestive heart failure (%)
Medical Conditions - People with coronary heart disease (%)
Medical Conditions - People with angina pectoris (%)
Medical Conditions - People who ever had heart attack (%)
Medical Conditions - People who ever had stroke (%)
Medical Conditions - People with emphysema (%)
Medical Conditions - People with thyroid problem (%)
Medical Conditions - People with chronic bronchitis (%)
Medical Conditions - People with any liver condition (%)
Medical Conditions - People who ever had cancer or malignancy (%)
Mental Health - People who have little interest in doing things (%)
Mental Health - People feeling down, depressed, or hopeless (%)
Mental Health - People who have trouble sleeping or sleeping too much (%)
Mental Health - People feeling tired or having little energy (%)
Mental Health - People with poor appetite or overeating (%)
Mental Health - People feeling bad about themself (%)
Mental Health - People who have trouble concentrating on things (%)
Mental Health - People moving or speaking slowly or too fast (%)
Mental Health - People having thoughts they would be better off dead (%)
Oral Health - Average years since last visit a dentist
Oral Health - People embarrassed because of mouth (%)
Oral Health - People with gum disease (%)
Oral Health - General health of teeth and gums (%)
Oral Health - Average days a week using dental floss/device
Oral Health - Average days a week using mouthwash for dental problem
Oral Health - Average number of teeth
Pesticide Use - Households using pesticides to control insects (%)
Pesticide Use - Households using pesticides to kill weeds (%)
Physical Activity - People doing vigorous-intensity work activities (%)
Physical Activity - People doing moderate-intensity work activities (%)
Physical Activity - People walking or bicycling (%)
Physical Activity - People doing vigorous-intensity recreational activities (%)
Physical Activity - People doing moderate-intensity recreational activities (%)
Physical Activity - Average hours a day doing sedentary activities
Physical Activity - Average hours a day watching TV or videos
Physical Activity - Average hours a day using computer
Physical Functioning - People having limitations keeping them from working (%)
Physical Functioning - People limited in amount of work they can do (%)
Physical Functioning - People that need special equipment to walk (%)
Physical Functioning - People experiencing confusion/memory problems (%)
Physical Functioning - People requiring special healthcare equipment (%)
Prescription Medications - Average number of prescription medicines taking
Preventive Aspirin Use - Adults 40+ taking low-dose aspirin (%)
Reproductive Health - Vaginal deliveries (%)
Reproductive Health - Cesarean deliveries (%)
Reproductive Health - Deliveries resulted in a live birth (%)
Reproductive Health - Pregnancies resulted in a delivery (%)
Reproductive Health - Women breastfeeding newborns (%)
Reproductive Health - Women that had a hysterectomy (%)
Reproductive Health - Women that had both ovaries removed (%)
Reproductive Health - Women that have ever taken birth control pills (%)
Reproductive Health - Women taking birth control pills (%)
Reproductive Health - Women that have ever used Depo-Provera or injectables (%)
Reproductive Health - Women that have ever used female hormones (%)
Sexual Behavior - People 18+ that ever had sex (vaginal, anal, or oral) (%)
Sexual Behavior - Males 18+ that ever had vaginal sex with a woman (%)
Sexual Behavior - Males 18+ that ever performed oral sex on a woman (%)
Sexual Behavior - Males 18+ that ever had anal sex with a woman (%)
Sexual Behavior - Males 18+ that ever had any sex with a man (%)
Sexual Behavior - Females 18+ that ever had vaginal sex with a man (%)
Sexual Behavior - Females 18+ that ever performed oral sex on a man (%)
Sexual Behavior - Females 18+ that ever had anal sex with a man (%)
Sexual Behavior - Females 18+ that ever had any kind of sex with a woman (%)
Sexual Behavior - Average age people first had sex
Sexual Behavior - Average number of female sex partners in lifetime (males 18+)
Sexual Behavior - Average number of female vaginal sex partners in lifetime (males 18+)
Sexual Behavior - Average age people first performed oral sex on a woman (18+)
Sexual Behavior - Average number of woman performed oral sex on in lifetime (18+)
Sexual Behavior - Average number of male sex partners in lifetime (males 18+)
Sexual Behavior - Average number of male anal sex partners in lifetime (males 18+)
Sexual Behavior - Average age people first performed oral sex on a man (18+)
Sexual Behavior - Average number of male oral sex partners in lifetime (18+)
Sexual Behavior - People using protection when performing oral sex (%)
Sexual Behavior - Average number of times people have vaginal or anal sex a year
Sexual Behavior - People having sex without condom (%)
Sexual Behavior - Average number of male sex partners in lifetime (females 18+)
Sexual Behavior - Average number of male vaginal sex partners in lifetime (females 18+)
Sexual Behavior - Average number of female sex partners in lifetime (females 18+)
Sexual Behavior - Circumcised males 18+ (%)
Sleep Disorders - Average hours sleeping at night
Sleep Disorders - People that has trouble sleeping (%)
Smoking-Cigarette Use - People smoking cigarettes (%)
Taste & Smell - People 40+ having problems with smell (%)
Taste & Smell - People 40+ having problems with taste (%)
Taste & Smell - People 40+ that ever had wisdom teeth removed (%)
Taste & Smell - People 40+ that ever had tonsils teeth removed (%)
Taste & Smell - People 40+ that ever had a loss of consciousness because of a head injury (%)
Taste & Smell - People 40+ that ever had a broken nose or other serious injury to face or skull (%)
Taste & Smell - People 40+ that ever had two or more sinus infections (%)
Weight - Average height (inches)
Weight - Average weight (pounds)
Weight - Average BMI
Weight - People that are obese (%)
Weight - People that ever were obese (%)
Weight - People trying to lose weight (%)
Urban population: 20,561
Rural population: 377
Estimated median house/condo value in 2022: $201,984
44053:
$201,984Ohio:
$204,100
According to our research of Ohio and other state lists, there were 37 registered sex offenders living in 44053 zip code as of April 27, 2024 . The ratio of all residents to sex offenders in zip code 44053 is 494 to 1.The ratio of registered sex offenders to all residents in this zip code is near the state average.
Median resident age: This zip code:
40.1 yearsOhio median age:
39.9 years
Average household size: This zip code:
2.3 peopleOhio:
2.4 people
Averages for the 2020 tax year for zip code 44053, filed in 2021:
Average Adjusted Gross Income (AGI) in 2020: $52,664 (Individual Income Tax Returns) Here:
$52,664State:
$67,288
Salary/wage: $46,864 (reported on 79.7% of returns )Here:
$46,864State:
$55,628
(% of AGI for various income ranges: 1080.3% for AGIs below $25k , 3311.7% for AGIs $25k-50k , 5866.1% for AGIs $50k-75k , 8671.4% for AGIs $75k-100k , 15395.8% for AGIs $100k-200k , 66490.0% for AGIs over 200k ) Taxable interest for individuals: $1,231 (reported on 23.1% of returns )This zip code:
$1,231Ohio:
$1,518
(% of AGI for various income ranges: 11.6% for AGIs below $25k , 15.8% for AGIs $25k-50k , 35.1% for AGIs $50k-75k , 49.7% for AGIs $75k-100k , 142.2% for AGIs $100k-200k , 872.5% for AGIs over 200k ) Ordinary dividends: $3,482 (reported on 14.2% of returns )(% of AGI for various income ranges: 18.0% for AGIs below $25k , 28.2% for AGIs $25k-50k , 59.3% for AGIs $50k-75k , 93.5% for AGIs $75k-100k , 191.1% for AGIs $100k-200k , 2677.5% for AGIs over 200k ) Net capital gain/loss in AGI: +$9,119 (reported on 12.7% of returns )Here:
+$9,119State:
+$18,919
(% of AGI for various income ranges: 4.5% for AGIs below $25k , 15.5% for AGIs $25k-50k , 33.1% for AGIs $50k-75k , 139.2% for AGIs $75k-100k , 417.0% for AGIs $100k-200k , 17182.5% for AGIs over 200k ) Profit/loss from business: +$6,824 (reported on 10.9% of returns )Here:
+$6,824State:
+$13,744
(% of AGI for various income ranges: 60.5% for AGIs below $25k , 56.4% for AGIs $25k-50k , 98.7% for AGIs $50k-75k , 97.3% for AGIs $75k-100k , 259.0% for AGIs $100k-200k , 2082.5% for AGIs over 200k ) Taxable individual retirement arrangement distribution: $13,873 (reported on 9.9% of returns )44053:
$13,873Ohio:
$18,876
(% of AGI for various income ranges: 51.2% for AGIs below $25k , 107.4% for AGIs $25k-50k , 196.2% for AGIs $50k-75k , 320.8% for AGIs $75k-100k , 597.4% for AGIs $100k-200k , 2240.0% for AGIs over 200k ) Total itemized deductions: $26,657 (reported on 4.0% of returns )Here:
$26,657State:
$33,869
(% of AGI for various income ranges: 27.4% for AGIs below $25k , 65.2% for AGIs $25k-50k , 165.4% for AGIs $50k-75k , 317.6% for AGIs $75k-100k , 423.5% for AGIs $100k-200k , 3037.5% for AGIs over 200k ) Charity contributions: $7,387 (reported on 3.0% of returns )(% of AGI for various income ranges: 15.0% for AGIs $25k-50k , 34.5% for AGIs $50k-75k , 55.4% for AGIs $75k-100k , 97.8% for AGIs $100k-200k , 832.5% for AGIs over 200k ) Taxes paid: $6,360 (reported on 4.0% of returns )(% of AGI for various income ranges: 2.8% for AGIs below $25k , 9.7% for AGIs $25k-50k , 37.0% for AGIs $50k-75k , 75.6% for AGIs $75k-100k , 125.8% for AGIs $100k-200k , 880.0% for AGIs over 200k ) Earned income credit: $2,326 (reported on 16.1% of returns )(% of AGI for various income ranges: 95.1% for AGIs below $25k , 58.5% for AGIs $25k-50k , 0.9% for AGIs $50k-75k ) Percentage of individuals using paid preparers for their 2020 taxes: 94.4%(% for various income ranges: 93.3% for AGIs below $25k , 94.7% for AGIs $25k-50k , 95.2% for AGIs $50k-75k , 94.9% for AGIs $75k-100k , 96.1% for AGIs $100k-200k , 93.3% for AGIs over 200k )
Averages for the 2012 tax year for zip code 44053, filed in 2013:
Average Adjusted Gross Income (AGI) in 2012: $44,803 (Individual Income Tax Returns) Here:
$44,803State:
$54,926
Salary/wage: $40,199 (reported on 83.6% of returns )Here:
$40,199State:
$45,869
(% of AGI for various income ranges: 70.9% for AGIs below $25k , 72.2% for AGIs $25k-50k , 77.5% for AGIs $50k-75k , 77.2% for AGIs $75k-100k , 78.4% for AGIs $100k-200k , 62.2% for AGIs over 200k ) Taxable interest for individuals: $967 (reported on 32.6% of returns )This zip code:
$967Ohio:
$1,297
(% of AGI for various income ranges: 1.2% for AGIs below $25k , 0.8% for AGIs $25k-50k , 0.7% for AGIs $50k-75k , 0.7% for AGIs $75k-100k , 0.5% for AGIs $100k-200k , 0.5% for AGIs over 200k ) Ordinary dividends: $2,523 (reported on 17.4% of returns )(% of AGI for various income ranges: 1.5% for AGIs below $25k , 0.8% for AGIs $25k-50k , 1.1% for AGIs $50k-75k , 0.8% for AGIs $75k-100k , 1.1% for AGIs $100k-200k , 0.4% for AGIs over 200k ) Net capital gain/loss in AGI: +$2,066 (reported on 11.7% of returns )Here:
+$2,066State:
+$11,232
(% of AGI for various income ranges: 0.4% for AGIs $75k-100k , 1.0% for AGIs $100k-200k , 4.7% for AGIs over 200k ) Profit/loss from business: +$7,812 (reported on 9.9% of returns )Here:
+$7,812State:
+$12,773
(% of AGI for various income ranges: 3.7% for AGIs below $25k , 1.4% for AGIs $25k-50k , 1.0% for AGIs $50k-75k , 1.5% for AGIs $75k-100k , 1.4% for AGIs $100k-200k , 3.7% for AGIs over 200k ) Taxable individual retirement arrangement distribution: $10,782 (reported on 11.1% of returns )44053:
$10,782Ohio:
$14,511
(% of AGI for various income ranges: 2.8% for AGIs below $25k , 3.1% for AGIs $25k-50k , 2.2% for AGIs $50k-75k , 2.4% for AGIs $75k-100k , 3.6% for AGIs $100k-200k ) Total itemized deductions: $17,312 (22% of AGI, reported on 30.3% of returns )Here:
$17,312State:
$21,278
Here:
21.7% of AGIState:
18.8% of AGI
(% of AGI for various income ranges: 6.3% for AGIs below $25k , 9.2% for AGIs $25k-50k , 12.6% for AGIs $50k-75k , 13.5% for AGIs $75k-100k , 13.7% for AGIs $100k-200k , 13.8% for AGIs over 200k ) Charity contributions: $2,600 (reported on 24.2% of returns )(% of AGI for various income ranges: 0.5% for AGIs below $25k , 1.0% for AGIs $25k-50k , 1.3% for AGIs $50k-75k , 1.7% for AGIs $75k-100k , 1.8% for AGIs $100k-200k , 2.2% for AGIs over 200k ) Taxes paid: $6,500 (reported on 30.0% of returns )(% of AGI for various income ranges: 1.1% for AGIs below $25k , 2.4% for AGIs $25k-50k , 4.3% for AGIs $50k-75k , 5.0% for AGIs $75k-100k , 6.4% for AGIs $100k-200k , 7.6% for AGIs over 200k ) Earned income credit: $2,271 (reported on 17.1% of returns )(% of AGI for various income ranges: 6.1% for AGIs below $25k , 0.8% for AGIs $25k-50k ) Percentage of individuals using paid preparers for their 2012 taxes: 50.8%(% for various income ranges: 44.9% for AGIs below $25k , 51.4% for AGIs $25k-50k , 57.1% for AGIs $50k-75k , 56.6% for AGIs $75k-100k , 57.5% for AGIs $100k-200k , 75.0% for AGIs over 200k )
Averages for the 2004 tax year for zip code 44053, filed in 2005:
Average Adjusted Gross Income (AGI) in 2004: $40,440 (Individual Income Tax Returns) Here:
$40,440State:
$44,480
Salary/wage: $36,049 (reported on 85.0% of returns )Here:
$36,049State:
$39,198
(% of AGI for various income ranges: 92.0% for AGIs below $10k , 68.6% for AGIs $10k-25k , 76.2% for AGIs $25k-50k , 80.6% for AGIs $50k-75k , 85.3% for AGIs $75k-100k , 64.7% for AGIs over 100k ) Taxable interest for individuals: $1,393 (reported on 46.3% of returns )This zip code:
$1,393Ohio:
$1,532
(% of AGI for various income ranges: 5.6% for AGIs below $10k , 2.8% for AGIs $10k-25k , 1.7% for AGIs $25k-50k , 1.3% for AGIs $50k-75k , 0.8% for AGIs $75k-100k , 1.5% for AGIs over 100k ) Taxable dividends: $2,185 (reported on 23.8% of returns )(% of AGI for various income ranges: 2.4% for AGIs below $10k , 1.5% for AGIs $10k-25k , 1.0% for AGIs $25k-50k , 1.1% for AGIs $50k-75k , 0.9% for AGIs $75k-100k , 1.9% for AGIs over 100k ) Net capital gain/loss: +$4,450 (reported on 15.9% of returns )Here:
+$4,450State:
+$8,582
(% of AGI for various income ranges: -0.7% for AGIs below $10k , 0.1% for AGIs $10k-25k , 0.7% for AGIs $25k-50k , 0.6% for AGIs $50k-75k , 1.5% for AGIs $75k-100k , 5.3% for AGIs over 100k ) Profit/loss from business: +$7,427 (reported on 9.3% of returns )Here:
+$7,427State:
+$10,813
(% of AGI for various income ranges: -3.0% for AGIs below $10k , 2.6% for AGIs $10k-25k , 1.1% for AGIs $25k-50k , 1.7% for AGIs $50k-75k , 1.3% for AGIs $75k-100k , 2.6% for AGIs over 100k ) IRA payment deduction: $2,731 (reported on 1.9% of returns )(% of AGI for various income ranges: 0.2% for AGIs $10k-25k , 0.2% for AGIs $25k-50k , 0.1% for AGIs $50k-75k , 0.1% for AGIs $75k-100k , 0.1% for AGIs over 100k ) Self-employed pension: $9,348 (reported on 0.3% of returns )Total itemized deductions: $15,865 (22% of AGI, reported on 34.9% of returns )Here:
$15,865State:
$17,503
Here:
22.4% of AGIState:
20.8% of AGI
(% of AGI for various income ranges: 6.1% for AGIs below $10k , 8.1% for AGIs $10k-25k , 12.2% for AGIs $25k-50k , 15.3% for AGIs $50k-75k , 16.1% for AGIs $75k-100k , 15.1% for AGIs over 100k ) Charity contributions deductions: $2,446 (3% of AGI, reported on 29.9% of returns )Here:
3.3% of AGIState:
3.4% of AGI
(% of AGI for various income ranges: 0.3% for AGIs below $10k , 0.6% for AGIs $10k-25k , 1.2% for AGIs $25k-50k , 1.7% for AGIs $50k-75k , 2.0% for AGIs $75k-100k , 3.1% for AGIs over 100k ) Total tax: $5,298 (reported on 76.3% of returns )(% of AGI for various income ranges: 1.9% for AGIs below $10k , 3.9% for AGIs $10k-25k , 7.3% for AGIs $25k-50k , 9.3% for AGIs $50k-75k , 10.5% for AGIs $75k-100k , 16.9% for AGIs over 100k ) Earned income credit: $1,604 (reported on 14.1% of returns )Percentage of individuals using paid preparers for their 2004 taxes: 57.7%(% for various income ranges: 49.2% for AGIs below $10k , 58.7% for AGIs $10k-25k , 60.0% for AGIs $25k-50k , 61.9% for AGIs $50k-75k , 59.1% for AGIs $75k-100k , 57.3% for AGIs over 100k )
Estimated median household income in 2022: This zip code:
$62,995Ohio:
$65,720
Nearest zip codes: 44052 ,
44001 ,
44055 ,
44035 ,
44074 ,
44054 .
Lorain Zip Code Map
Percentage of family households: This zip code:
41.4%Ohio:
43.3%
Percentage of households with unmarried partners: This zip code:
3.6%Ohio:
44.6%
No gay or lesbian households reported
Household received Food Stamps/SNAP in the past 12 months: 1,260Household did not receive Food Stamps/SNAP in the past 12 months: 7,676
Women who had a birth in the past 12 months: 299 (101 now married , 192 unmarried) Women who did not have a birth in the past 12 months: 4,348 (1,906 now married , 2,441 unmarried)
Housing units in zip code 44053 with a mortgage: 3,626 (371
second mortgage , 88
home equity loan , 263
both second mortgage and home equity loan )
Houses without a mortgage: 201
Median monthly owner costs for units with a mortgage: $1,358
Median monthly owner costs for units without a mortgage: $530
Residents with income below the poverty level in 2022:
This zip code:
16.9%Whole state:
13.4%
Residents with income below 50% of the poverty level in 2022:
This zip code:
11.0%Whole state:
7.0%
Median number of rooms in houses and condos: Median number of rooms in apartments: Notable locations in this zip code not listed on our city pages
Click to draw/clear zip code borders Notable locations in zip code 44053: (A) , West Park Industrial Park (B) , Copper Kettle Marina (C) , Beaver Park North Marina (D) , Beaver Park Marina (E) , Lorain Industrial Park (F) , Coppers Kettle Marina (G) , Beaver Creek Boat Club (H) , Beaver Park Yacht Club (I) , Lorain Country Club (J) , Lorain Fire Department Station 7 (K) . Display/hide their locations on the map
Shopping Center: (1) . Display/hide its location on the map
Churches in zip code 44053 include: (A) , Christ United Methodist Church (B) , New Morning Star Primitive Baptist Church (C) , Northminster Presbyterian Church (D) , First Baptist Church (E) , Zion Lutheran Church (F) , Lord of Life Lutheran Church (G) , Saint Nicholas Greek Orthodox Church (H) , First Church of Christ Scientist (I) . Display/hide their locations on the map
Cemetery: (1) . Display/hide its location on the map
Streams, rivers, and creeks: (A) , Martin Run (B) , Quarry Creek (C) . Display/hide their locations on the map
Parks in zip code 44053 include: (1) , Kennedy Park (2) , Kneirim Park (3) , Columbus Park (4) , Willow Park (5) . Display/hide their locations on the map
Year house built (houses)
34 2020 or later1,109 2010 to 20191,319 2000 to 2009701 1990 to 1999955 1980 to 19891,897 1970 to 19792,173 1960 to 19691,006 1950 to 1959136 1940 to 1949185 1939 or earlier
Zip code 44053 household income distribution in 2022 500 Less than $10,000612 $10,000 to $14,999401 $15,000 to $19,999296 $20,000 to $24,999270 $25,000 to $29,999244 $30,000 to $34,999447 $35,000 to $39,999259 $40,000 to $44,999414 $45,000 to $49,999618 $50,000 to $59,999915 $60,000 to $74,9991,587 $75,000 to $99,999705 $100,000 to $124,999544 $125,000 to $149,999881 $150,000 to $199,999211 $200,000 or moreEstimate of home value of owner-occupied houses/condos in 2022 in zip code 44053 16 Less than $10,00010 $10,000 to $14,99922 $15,000 to $19,99915 $20,000 to $24,99966 $25,000 to $29,99957 $40,000 to $49,99924 $50,000 to $59,99987 $60,000 to $69,99998 $70,000 to $79,999158 $80,000 to $89,999122 $90,000 to $99,999528 $100,000 to $124,999480 $125,000 to $149,999698 $150,000 to $174,999594 $175,000 to $199,999947 $200,000 to $249,999540 $250,000 to $299,999770 $300,000 to $399,999201 $400,000 to $499,999124 $500,000 to $749,99910 $1,000,000 to $1,499,999Rent paid by renters in 2022 in zip code 44053 186 $200 to $24956 $250 to $2998 $350 to $39943 $400 to $449107 $450 to $499365 $500 to $549149 $550 to $599584 $600 to $64998 $650 to $699279 $700 to $749354 $750 to $799209 $800 to $899287 $900 to $999296 $1,000 to $1,249114 $1,250 to $1,49912 $1,500 to $1,99912 $2,000 to $2,49959 No cash rent
Median gross rent in 2022: $825.
Median price asked for vacant for-sale houses and condos in 2022: $158,714.
Estimated median house (or condo) value in 2022 for: White Non-Hispanic householders: $205,242Black or African American householders: $167,863American Indian or Alaska Native householders: $278,628Asian householders: $192,896Some other race householders: $227,532Two or more races householders: $194,611Hispanic or Latino householders: $216,044Estimated median house or condo value in 2022: $201,984
44053:
$201,984Ohio:
$204,100
Lower value quartile - upper value quartile: $138,191 - $280,109
Mean price in 2022: Detached houses: $237,062Here:
$237,062State:
$254,366
Townhouses or other attached units: $698,917Here:
$698,917State:
$225,733
In 2-unit structures: $143,084Here:
$143,084State:
$144,384
In 5-or-more-unit structures: $82,774Here:
$82,774State:
$211,593
Housing units in structures:
One, detached: 5,942One, attached: 386Two: 2593 or 4: 2445 to 9: 65810 to 19: 97920 to 49: 50450 or more: 290Mobile homes: 163Unemployment : 2.1%
Means of transportation to work in zip code 44053 78.1% 7,747 Drove a car alone10.8% 1,068 Carpooled0.3% 34 Bus or trolley bus0.2% 21 Walked2.3% 226 Other means6.9% 685 Worked at homeTravel time to work (commute) in zip code 44053 252 Less than 5 minutes1,105 5 to 9 minutes900 10 to 14 minutes1,586 15 to 19 minutes1,451 20 to 24 minutes946 25 to 29 minutes1,142 30 to 34 minutes428 35 to 39 minutes245 40 to 44 minutes588 45 to 59 minutes283 60 to 89 minutes135 90 or more minutes
Neighborhoods in zip code 44053: Percentage of zip code residents living and working in this county: 72.3%
Household type by relationship:
Households: 20,939
Male householders: 3,770 (1,406 living alone ), Female householders: 5,173 (1,625 living alone )3,482 spouses (3,466 opposite-sex spouses ), 567 unmarried partners , (567 opposite-sex unmarried partners ), 6,090 children (5,891 natural , 47 adopted , 151 stepchildren ), 324 grandchildren , 243 brothers or sisters , 169 parents , 0 foster children , 228 other relatives , 544 non-relatives In group quarters: 338 (-1 institutionalized population )
Size of family households: 2,242 2-persons , 1,690 3-persons , 773 4-persons , 498 5-persons , 73 6-persons , 15 7-or-more-persons
Size of nonfamily households: 3,031 1-person , 557 2-persons , 35 3-persons , 10 5-persons
2,284 married couples with children. single-parent households (125 men , 1,696 women ).
90.7% of residents of 44053 zip code speak English at home. of residents speak Spanish at home (68% very well, 15% well, 11% not well, 6% not at all ).of residents speak other Indo-European language at home (50% very well, 50% well ).of residents speak Asian or Pacific Island language at home (20% very well, 50% well, 30% not well ).of residents speak other language at home (89% very well, 11% not well ).
Foreign born population: 294 (1.4%)
(78.6%
of them are naturalized citizens )
This zip code:
1.4%Whole state:
5.0%
14% Greece 12% Liberia 11% Ukraine 10% Guatemala 10% Sweden 8% Thailand 6% Bulgaria 13% German 9% American 4% English 4% Italian 3% Polish 3% Irish 3% Hungarian
Year of entry for the foreign-born population
595 2010 or later 78 2000 to 2009 90 1990 to 1999 350 Before 1990
There are
313 Other Medical Specialists in Zip Code 44053.
Facilities with environmental interests located in this zip code:
BEAVER PARK MARINA * (6101 W ERIE ST in LORAIN, OH)
STATE MASTER (Ohio general info) - -47-4493-1077-3, EPCRA, RCRA-OHR000036525, HAZARDOUS WASTE PROGRAM STATE MASTER (Ohio general info) - EPCRA Conditionally Exempt Small Quantity Generators, less than 100 kg/month of hazardous waste (Resource Conservation and Recovery Act (tracking hazardous waste)) USED OIL PROGRAM (Resource Conservation and Recovery Act (tracking hazardous waste)) Organizations: BILL SCHAEFFER (CONTACT/OWNER)
ATLAS TECHNICAL FINISHES INC (7469 INDUSTRIAL PKY. in LORAIN, OH)
STATE MASTER (Ohio general info) - AIR MAJOR, EPCRA, RCRA-OHD987040979, HAZARDOUS WASTE PROGRAM Conditionally Exempt Small Quantity Generators, less than 100 kg/month of hazardous waste (Resource Conservation and Recovery Act (tracking hazardous waste)) TRI REPORTER (Tracking of toxic chemicals releasing facilities) Business SIC classification: ELECTROPLATING, PLATING, POLISHING, ANODIZING, AND COLORINGOrganizations: SPRINGCO METAL COATING (CONTACT/OPERATOR)
, FRANK SUAREZ (CONTACT/OWNER)
Alternative names: ATLAS TECHNICAL FINISHES LORAIN
Housing units lacking complete plumbing facilities: 1.4%
Housing units lacking complete kitchen facilities: 2.1%
65.4% Utility gas 32.4% Electricity 0.7% No fuel used 0.6% Bottled, tank, or LP gas 0.6% Wood
Population in 1990: 16,141. Population change in the 1990s: +1,052 (+6.5%).
Place of birth for U.S.-born residents:
This state: 16,753Northeast: 1,073Midwest: 645South: 1,177West: 196
57% of the 44053 zip code residents lived in the same house 5 years ago.
Out of people who lived in different houses, 78% lived in this county.
Out of people who lived in different counties, 50% lived in Ohio.
92% of the 44053 zip code residents lived in the same house 1 year ago.
Out of people who lived in different houses, 74% moved from this county.
Out of people who lived in different houses, 13% moved from different county within same state.
Out of people who lived in different houses, 8% moved from different state.
Out of people who lived in different houses, 5% moved from abroad.
Private vs. public school enrollment:
Students in private schools in grades 1 to 8 (elementary and middle school): 381
Students in private schools in grades 9 to 12 (high school): 113
Students in private undergraduate colleges: 303
Occupation by median earnings in the past 12 months ($)
102,450 Fire fighting and prevention, and other protective service workers including supervisors 102,169 Architecture and engineering occupations 83,371 Law enforcement workers including supervisors 69,029 Health diagnosing and treating practitioners and other technical occupations 65,633 Transportation occupations 63,152 Business and financial operations occupations
Companies with federal contracts located in this zip code:
COMMUNITY HEALTH PARTNERS (3700 KOLBE ROAD in LORAIN, OH) in 2 contracts from 2004 to 2005
$306,395 with Department of Veterans Affairs for Lease or Rental of Facilities -- Laboratories and Clinics. Signed on 2005-10-01. Completion date: 2006-09-30.
, same as above. Signed on 2004-10-01. Completion date: 2005-09-30.
KATHLEEN ANN GREGUS (5445 BEAVERCREST DRIVE SUI in LORAIN, OH; small business) in 2 contracts in 2003
$6,720 with Army for Custodial Janitorial Services. Signed on 2003-10-30. Completion date: 2003-10-01.
, same as above. Signed on 2003-10-30. Completion date: 2003-10-01.
Top industries in this zip code by the number of employees in 2005:
Health Care and Social Assistance: General Medical and Surgical Hospitals (over 1000 employees: 1 establishment)Health Care and Social Assistance: Offices of Physicians (except Mental Health Specialists) (100-249: 1, 50-99: 2, 10-19: 4, 5-9: 12, 1-4: 20)Health Care and Social Assistance: Nursing Care Facilities (100-249: 2, 50-99: 1, 5-9: 1)Health Care and Social Assistance: Outpatient Mental Health and Substance Abuse Centers (250-499: 1)Accommodation and Food Services: Limited-Service Restaurants (50-99: 1, 20-49: 3, 10-19: 2, 5-9: 2, 1-4: 4)Wholesale Trade: Metal Service Centers and Other Metal Merchant Wholesalers (100-249: 1, 20-49: 1)Accommodation and Food Services: Full-Service Restaurants (50-99: 1, 20-49: 1, 10-19: 2, 5-9: 4, 1-4: 1)
People in group quarters in 2010:
325 people in nursing facilities/skilled-nursing facilities
55 people in group homes intended for adults
11 people in in-patient hospice facilities
People in group quarters in 2000:
328 people in nursing homes
23 people in homes for the mentally retarded
8 people in other noninstitutional group quarters
6 people in hospitals/wards and hospices for chronically ill
6 people in hospices or homes for chronically ill
5 people in other group homes
Fatal accident statistics in 2012:
Fatal accident count: 1Vehicles involved in fatal accidents: 1Fatal accidents caused by drunken drivers: 1Fatalities: 1Persons involved in fatal accidents: 1Pedestrians involved in fatal accidents: 0
Fatal accident statistics in 2010:
Fatal accident count: 1Vehicles involved in fatal accidents: 1Fatal accidents caused by drunken drivers: 0Fatalities: 1Persons involved in fatal accidents: 1Pedestrians involved in fatal accidents: 1
Home Mortgage Disclosure Act Aggregated Statistics For Year 2009(Based on 6 full and 12 partial tracts) A) FHA, FSA/RHS & VA B) Conventional C) Refinancings D) Home Improvement Loans E) Loans on Dwellings For 5+ Families F) Non-occupant Loans on G) Loans On Manufactured Number Average Value Number Average Value Number Average Value Number Average Value Number Average Value Number Average Value Number Average Value
LOANS ORIGINATED 207 $125,119 163 $108,471 500 $131,049 56 $36,397 2 $1,549,505 44 $101,203 0 $0 APPLICATIONS APPROVED, NOT ACCEPTED 6 $109,970 17 $68,831 42 $119,800 6 $49,558 0 $0 3 $83,953 0 $0 APPLICATIONS DENIED 25 $98,026 24 $100,714 228 $125,904 43 $35,633 2 $5,400 13 $80,836 2 $24,340 APPLICATIONS WITHDRAWN 13 $136,559 14 $190,069 143 $132,224 4 $79,040 0 $0 9 $177,214 0 $0 FILES CLOSED FOR INCOMPLETENESS 6 $78,298 5 $112,010 37 $136,586 4 $60,352 0 $0 0 $0 0 $0
Aggregated Statistics For Year 2008(Based on 6 full and 12 partial tracts) A) FHA, FSA/RHS & VA B) Conventional C) Refinancings D) Home Improvement Loans F) Non-occupant Loans on G) Loans On Manufactured Number Average Value Number Average Value Number Average Value Number Average Value Number Average Value Number Average Value
LOANS ORIGINATED 180 $134,061 252 $125,128 352 $121,553 69 $21,945 34 $95,710 4 $12,212 APPLICATIONS APPROVED, NOT ACCEPTED 11 $155,381 13 $151,457 35 $123,434 15 $18,504 5 $106,490 1 $34,500 APPLICATIONS DENIED 14 $179,121 51 $102,340 314 $133,213 92 $29,669 19 $88,119 14 $21,724 APPLICATIONS WITHDRAWN 6 $123,265 35 $135,159 78 $139,108 0 $0 7 $107,489 0 $0 FILES CLOSED FOR INCOMPLETENESS 0 $0 2 $142,905 30 $198,732 3 $6,577 2 $39,940 0 $0
Aggregated Statistics For Year 2007(Based on 6 full and 12 partial tracts) A) FHA, FSA/RHS & VA B) Conventional C) Refinancings D) Home Improvement Loans E) Loans on Dwellings For 5+ Families F) Non-occupant Loans on G) Loans On Manufactured Number Average Value Number Average Value Number Average Value Number Average Value Number Average Value Number Average Value Number Average Value
LOANS ORIGINATED 65 $134,536 411 $140,486 414 $115,844 85 $31,768 11 $1,370,379 68 $96,197 4 $30,175 APPLICATIONS APPROVED, NOT ACCEPTED 0 $0 33 $157,253 89 $148,177 21 $32,722 0 $0 13 $110,988 2 $42,875 APPLICATIONS DENIED 5 $98,186 75 $104,612 459 $133,204 96 $46,363 0 $0 33 $82,693 15 $35,836 APPLICATIONS WITHDRAWN 5 $136,346 38 $135,260 121 $123,528 19 $43,304 1 $2,216,540 13 $119,685 0 $0 FILES CLOSED FOR INCOMPLETENESS 0 $0 26 $125,800 49 $173,446 0 $0 0 $0 5 $119,060 0 $0
Aggregated Statistics For Year 2006(Based on 6 full and 12 partial tracts) A) FHA, FSA/RHS & VA B) Conventional C) Refinancings D) Home Improvement Loans E) Loans on Dwellings For 5+ Families F) Non-occupant Loans on G) Loans On Manufactured Number Average Value Number Average Value Number Average Value Number Average Value Number Average Value Number Average Value Number Average Value
LOANS ORIGINATED 66 $141,333 600 $120,951 532 $104,412 118 $27,775 6 $831,285 85 $90,677 4 $121,435 APPLICATIONS APPROVED, NOT ACCEPTED 0 $0 102 $109,981 122 $113,855 12 $15,342 5 $1,273,944 15 $73,294 0 $0 APPLICATIONS DENIED 13 $130,677 134 $114,175 494 $121,767 92 $31,635 2 $576,255 52 $105,665 3 $90,103 APPLICATIONS WITHDRAWN 9 $98,530 43 $134,287 212 $127,848 33 $39,922 2 $274,000 14 $80,496 1 $69,680 FILES CLOSED FOR INCOMPLETENESS 0 $0 19 $114,551 79 $127,863 0 $0 0 $0 5 $148,942 0 $0
Aggregated Statistics For Year 2005(Based on 6 full and 12 partial tracts) A) FHA, FSA/RHS & VA B) Conventional C) Refinancings D) Home Improvement Loans E) Loans on Dwellings For 5+ Families F) Non-occupant Loans on G) Loans On Manufactured Number Average Value Number Average Value Number Average Value Number Average Value Number Average Value Number Average Value Number Average Value
LOANS ORIGINATED 93 $141,610 718 $125,945 788 $121,493 123 $32,040 12 $2,001,947 93 $90,199 1 $42,000 APPLICATIONS APPROVED, NOT ACCEPTED 5 $102,552 74 $125,921 140 $113,724 22 $24,544 2 $408,000 19 $71,117 8 $32,228 APPLICATIONS DENIED 9 $178,386 129 $94,068 633 $126,327 128 $35,472 1 $145,820 57 $88,746 13 $27,035 APPLICATIONS WITHDRAWN 9 $158,670 58 $136,576 367 $136,583 60 $158,057 2 $1,345,680 29 $98,411 0 $0 FILES CLOSED FOR INCOMPLETENESS 4 $123,562 12 $176,178 87 $150,462 6 $24,813 0 $0 3 $133,973 0 $0
Aggregated Statistics For Year 2004(Based on 6 full and 12 partial tracts) A) FHA, FSA/RHS & VA B) Conventional C) Refinancings D) Home Improvement Loans E) Loans on Dwellings For 5+ Families F) Non-occupant Loans on G) Loans On Manufactured Number Average Value Number Average Value Number Average Value Number Average Value Number Average Value Number Average Value Number Average Value
LOANS ORIGINATED 139 $143,240 547 $121,910 730 $119,141 75 $28,408 17 $1,012,772 63 $92,831 3 $51,330 APPLICATIONS APPROVED, NOT ACCEPTED 4 $124,105 43 $107,788 176 $120,841 16 $26,204 2 $283,000 16 $99,776 3 $18,527 APPLICATIONS DENIED 5 $132,272 97 $104,379 571 $135,680 112 $30,099 0 $0 32 $92,700 7 $41,047 APPLICATIONS WITHDRAWN 2 $198,065 65 $145,041 293 $135,301 10 $60,000 0 $0 7 $63,700 0 $0 FILES CLOSED FOR INCOMPLETENESS 2 $167,880 18 $115,723 88 $141,951 3 $49,710 0 $0 2 $75,710 0 $0
Aggregated Statistics For Year 2003(Based on 6 full and 12 partial tracts) A) FHA, FSA/RHS & VA B) Conventional C) Refinancings D) Home Improvement Loans E) Loans on Dwellings For 5+ Families F) Non-occupant Loans on Number Average Value Number Average Value Number Average Value Number Average Value Number Average Value Number Average Value
LOANS ORIGINATED 135 $132,385 545 $126,760 1,460 $114,662 39 $16,640 14 $668,123 90 $94,701 APPLICATIONS APPROVED, NOT ACCEPTED 0 $0 47 $110,955 225 $111,525 19 $19,451 2 $853,580 16 $93,717 APPLICATIONS DENIED 8 $102,228 60 $104,880 591 $125,863 88 $15,396 0 $0 20 $113,929 APPLICATIONS WITHDRAWN 12 $147,452 69 $131,320 298 $117,948 8 $41,086 0 $0 15 $123,525 FILES CLOSED FOR INCOMPLETENESS 2 $153,040 21 $118,489 123 $126,981 5 $19,622 0 $0 5 $104,020
Aggregated Statistics For Year 2002(Based on 6 full and 12 partial tracts) A) FHA, FSA/RHS & VA B) Conventional C) Refinancings D) Home Improvement Loans E) Loans on Dwellings For 5+ Families F) Non-occupant Loans on Number Average Value Number Average Value Number Average Value Number Average Value Number Average Value Number Average Value
LOANS ORIGINATED 129 $128,186 471 $129,024 1,147 $109,247 71 $16,396 5 $1,132,404 52 $75,191 APPLICATIONS APPROVED, NOT ACCEPTED 8 $102,681 37 $121,216 194 $103,908 34 $14,574 0 $0 6 $82,330 APPLICATIONS DENIED 12 $120,794 68 $105,662 464 $111,764 66 $10,992 0 $0 12 $103,273 APPLICATIONS WITHDRAWN 11 $147,988 42 $122,309 263 $109,460 7 $27,469 0 $0 16 $69,457 FILES CLOSED FOR INCOMPLETENESS 0 $0 18 $120,130 96 $107,291 4 $45,455 0 $0 5 $89,832
Aggregated Statistics For Year 2001(Based on 6 full and 12 partial tracts) A) FHA, FSA/RHS & VA B) Conventional C) Refinancings D) Home Improvement Loans E) Loans on Dwellings For 5+ Families F) Non-occupant Loans on Number Average Value Number Average Value Number Average Value Number Average Value Number Average Value Number Average Value
LOANS ORIGINATED 187 $120,820 505 $114,627 1,011 $97,815 103 $19,818 5 $1,036,730 70 $68,430 APPLICATIONS APPROVED, NOT ACCEPTED 4 $161,295 45 $95,416 168 $95,943 26 $27,179 0 $0 9 $133,591 APPLICATIONS DENIED 13 $129,258 87 $101,118 513 $89,484 86 $12,582 2 $1,098,350 38 $104,559 APPLICATIONS WITHDRAWN 10 $148,123 44 $143,520 288 $97,948 11 $12,901 0 $0 22 $115,478 FILES CLOSED FOR INCOMPLETENESS 1 $81,920 17 $87,906 78 $100,864 0 $0 0 $0 5 $59,874
Aggregated Statistics For Year 2000(Based on 6 full and 12 partial tracts) A) FHA, FSA/RHS & VA B) Conventional C) Refinancings D) Home Improvement Loans E) Loans on Dwellings For 5+ Families F) Non-occupant Loans on Number Average Value Number Average Value Number Average Value Number Average Value Number Average Value Number Average Value
LOANS ORIGINATED 140 $115,706 385 $111,296 320 $83,357 129 $14,895 11 $277,735 58 $96,154 APPLICATIONS APPROVED, NOT ACCEPTED 8 $155,569 32 $86,121 115 $77,831 60 $16,351 0 $0 13 $85,484 APPLICATIONS DENIED 11 $149,435 94 $88,934 324 $83,291 89 $17,148 0 $0 16 $56,172 APPLICATIONS WITHDRAWN 11 $101,535 46 $108,344 165 $83,872 24 $29,979 0 $0 17 $109,915 FILES CLOSED FOR INCOMPLETENESS 0 $0 13 $98,082 51 $98,223 0 $0 0 $0 1 $55,460
Aggregated Statistics For Year 1999(Based on 3 full and 5 partial tracts) A) FHA, FSA/RHS & VA B) Conventional C) Refinancings D) Home Improvement Loans E) Loans on Dwellings For 5+ Families F) Non-occupant Loans on Number Average Value Number Average Value Number Average Value Number Average Value Number Average Value Number Average Value
LOANS ORIGINATED 83 $118,397 229 $118,163 300 $83,777 50 $13,558 11 $659,827 23 $74,769 APPLICATIONS APPROVED, NOT ACCEPTED 0 $0 19 $115,649 85 $88,771 24 $12,355 0 $0 4 $79,975 APPLICATIONS DENIED 1 $98,000 58 $70,131 148 $87,186 62 $20,405 0 $0 9 $40,243 APPLICATIONS WITHDRAWN 4 $102,555 20 $95,302 100 $88,432 11 $39,850 0 $0 3 $134,667 FILES CLOSED FOR INCOMPLETENESS 2 $63,510 8 $107,486 24 $103,688 1 $7,360 0 $0 1 $126,000
Private Mortgage Insurance Companies Aggregated Statistics For Year 2009(Based on 4 full and 10 partial tracts) A) Conventional B) Refinancings Number Average Value Number Average Value
LOANS ORIGINATED 8 $146,646 8 $142,205 APPLICATIONS APPROVED, NOT ACCEPTED 2 $87,065 4 $130,558 APPLICATIONS DENIED 8 $147,880 3 $123,983 APPLICATIONS WITHDRAWN 0 $0 1 $164,980 FILES CLOSED FOR INCOMPLETENESS 6 $96,512 0 $0
Aggregated Statistics For Year 2008(Based on 6 full and 12 partial tracts) A) Conventional B) Refinancings C) Non-occupant Loans on Number Average Value Number Average Value Number Average Value
LOANS ORIGINATED 92 $141,852 27 $158,960 6 $177,275 APPLICATIONS APPROVED, NOT ACCEPTED 23 $131,101 22 $128,787 5 $126,978 APPLICATIONS DENIED 3 $138,640 2 $116,150 3 $129,520 APPLICATIONS WITHDRAWN 10 $95,693 2 $229,925 0 $0 FILES CLOSED FOR INCOMPLETENESS 1 $279,560 1 $182,350 1 $279,560
Aggregated Statistics For Year 2007(Based on 6 full and 12 partial tracts) A) Conventional B) Refinancings C) Non-occupant Loans on Number Average Value Number Average Value Number Average Value
LOANS ORIGINATED 169 $137,858 57 $155,782 13 $99,664 APPLICATIONS APPROVED, NOT ACCEPTED 32 $176,383 16 $159,723 4 $120,732 APPLICATIONS DENIED 2 $191,675 0 $0 0 $0 APPLICATIONS WITHDRAWN 0 $0 4 $183,910 0 $0 FILES CLOSED FOR INCOMPLETENESS 0 $0 1 $205,320 0 $0
Aggregated Statistics For Year 2006(Based on 6 full and 12 partial tracts) A) Conventional B) Refinancings C) Non-occupant Loans on Number Average Value Number Average Value Number Average Value
LOANS ORIGINATED 126 $147,927 35 $153,439 6 $69,985 APPLICATIONS APPROVED, NOT ACCEPTED 18 $156,595 21 $145,406 0 $0 APPLICATIONS DENIED 0 $0 0 $0 0 $0 APPLICATIONS WITHDRAWN 11 $187,884 2 $323,950 0 $0 FILES CLOSED FOR INCOMPLETENESS 0 $0 3 $103,503 0 $0
Aggregated Statistics For Year 2005(Based on 6 full and 12 partial tracts) A) Conventional B) Refinancings C) Non-occupant Loans on D) Loans On Manufactured Number Average Value Number Average Value Number Average Value Number Average Value
LOANS ORIGINATED 108 $146,235 74 $142,910 8 $70,956 0 $0 APPLICATIONS APPROVED, NOT ACCEPTED 19 $143,819 25 $156,206 0 $0 2 $149,325 APPLICATIONS DENIED 1 $88,660 0 $0 1 $88,660 0 $0 APPLICATIONS WITHDRAWN 1 $241,260 4 $140,555 0 $0 0 $0 FILES CLOSED FOR INCOMPLETENESS 0 $0 0 $0 0 $0 0 $0
Aggregated Statistics For Year 2004(Based on 6 full and 12 partial tracts) A) Conventional B) Refinancings C) Non-occupant Loans on Number Average Value Number Average Value Number Average Value
LOANS ORIGINATED 112 $150,584 57 $126,232 11 $97,452 APPLICATIONS APPROVED, NOT ACCEPTED 21 $137,285 46 $137,990 5 $121,670 APPLICATIONS DENIED 0 $0 0 $0 0 $0 APPLICATIONS WITHDRAWN 4 $127,808 9 $157,344 0 $0 FILES CLOSED FOR INCOMPLETENESS 0 $0 2 $65,900 0 $0
Aggregated Statistics For Year 2003(Based on 6 full and 12 partial tracts) A) Conventional B) Refinancings C) Non-occupant Loans on Number Average Value Number Average Value Number Average Value
LOANS ORIGINATED 137 $140,841 153 $137,940 14 $85,746 APPLICATIONS APPROVED, NOT ACCEPTED 19 $132,975 82 $141,164 12 $117,062 APPLICATIONS DENIED 4 $229,675 0 $0 2 $167,380 APPLICATIONS WITHDRAWN 9 $205,249 19 $134,302 4 $133,955 FILES CLOSED FOR INCOMPLETENESS 0 $0 0 $0 0 $0
Aggregated Statistics For Year 2002(Based on 6 full and 12 partial tracts) A) Conventional B) Refinancings C) Non-occupant Loans on Number Average Value Number Average Value Number Average Value
LOANS ORIGINATED 148 $136,609 142 $138,224 12 $79,306 APPLICATIONS APPROVED, NOT ACCEPTED 32 $170,002 39 $129,689 2 $78,935 APPLICATIONS DENIED 0 $0 0 $0 0 $0 APPLICATIONS WITHDRAWN 5 $116,170 24 $130,999 2 $143,765 FILES CLOSED FOR INCOMPLETENESS 0 $0 2 $120,000 0 $0
Aggregated Statistics For Year 2001(Based on 6 full and 12 partial tracts) A) Conventional B) Refinancings C) Non-occupant Loans on Number Average Value Number Average Value Number Average Value
LOANS ORIGINATED 146 $123,175 115 $123,388 8 $72,359 APPLICATIONS APPROVED, NOT ACCEPTED 14 $106,621 24 $135,112 0 $0 APPLICATIONS DENIED 7 $112,051 5 $136,660 5 $126,634 APPLICATIONS WITHDRAWN 3 $90,173 10 $143,147 0 $0 FILES CLOSED FOR INCOMPLETENESS 0 $0 0 $0 0 $0
Aggregated Statistics For Year 2000(Based on 6 full and 12 partial tracts) A) Conventional B) Refinancings C) Non-occupant Loans on Number Average Value Number Average Value Number Average Value
LOANS ORIGINATED 104 $129,680 30 $121,039 10 $99,478 APPLICATIONS APPROVED, NOT ACCEPTED 6 $132,468 11 $116,935 2 $121,815 APPLICATIONS DENIED 6 $113,648 5 $139,712 2 $69,010 APPLICATIONS WITHDRAWN 2 $77,445 4 $76,602 0 $0 FILES CLOSED FOR INCOMPLETENESS 0 $0 0 $0 0 $0
Aggregated Statistics For Year 1999(Based on 3 full and 5 partial tracts) A) Conventional B) Refinancings C) Non-occupant Loans on Number Average Value Number Average Value Number Average Value
LOANS ORIGINATED 60 $132,510 23 $118,243 2 $69,430 APPLICATIONS APPROVED, NOT ACCEPTED 7 $105,150 3 $134,003 1 $122,000 APPLICATIONS DENIED 5 $145,828 3 $134,403 0 $0 APPLICATIONS WITHDRAWN 2 $142,665 1 $44,180 0 $0 FILES CLOSED FOR INCOMPLETENESS 0 $0 0 $0 0 $0
2002 - 2018 National Fire Incident Reporting System (NFIRS) incidents See full 2006 National Fire Incident Reporting System statistics for zip code 44053, Ohio
Most common first names in zip code 44053 among deceased individuals Name Count Lived (average)
Mary 197 80.3 years John 175 77.4 years William 91 73.7 years Joseph 90 77.2 years Helen 85 81.3 years Robert 78 71.6 years Anna 73 84.8 years James 71 73.3 years George 69 78.7 years Elizabeth 63 83.0 years
Most common last names in zip code 44053 among deceased individuals Last name Count Lived (average)
Smith 49 73.9 years Williams 23 74.6 years Miller 23 80.1 years Jones 20 78.9 years Johnson 17 78.0 years Toth 12 74.6 years Stewart 11 78.7 years Brown 11 69.5 years Harris 11 76.9 years Mitchell 10 72.7 years
Businesses in zip code 44053
Name Count Name Count
Applebee's 1 Little Caesars Pizza 1 Baskin-Robbins 1 Lowe's 1 Burger King 1 McDonald's 1 Curves 1 Pizza Hut 1 Dunkin Donuts 1 Quiznos 1 FedEx 4 RadioShack 1 H&R Block 1 Sears 2 Home Depot 1 U-Haul 2 Jones New York 1 UPS 3 Kmart 1 Walgreens 1 Kohl's 1 Walmart 1

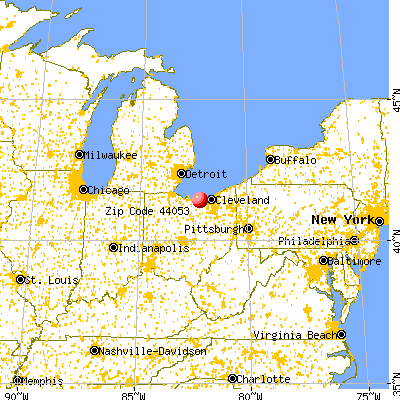


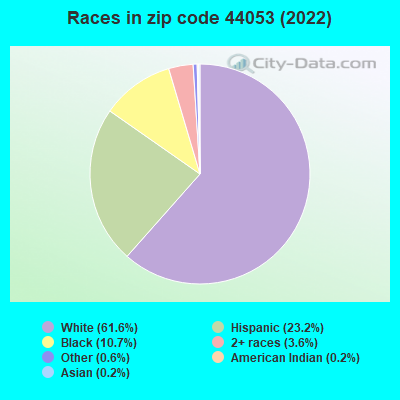


 Nearest zip codes: 44052, 44001, 44055, 44035, 44074, 44054.
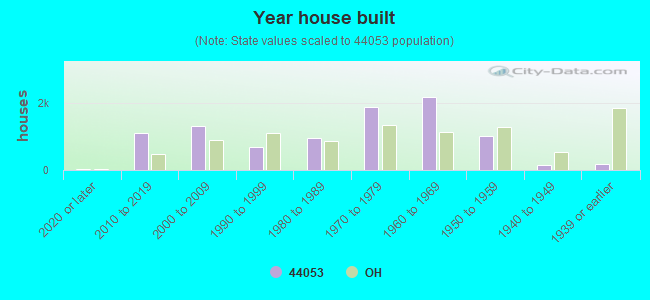

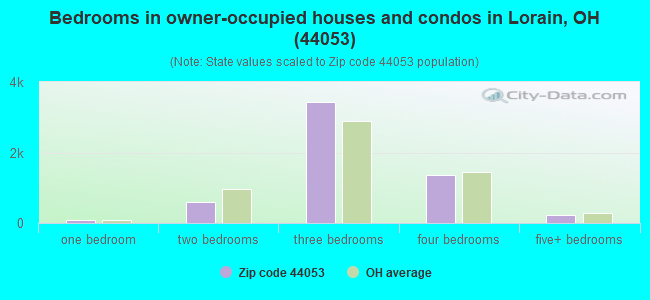


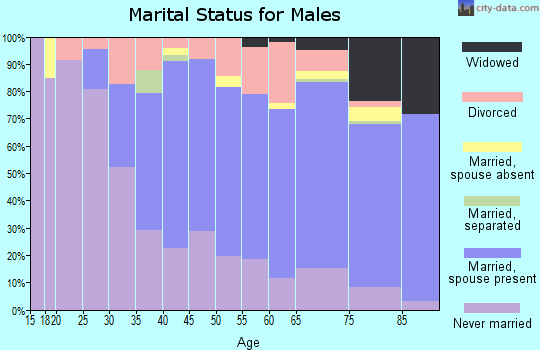
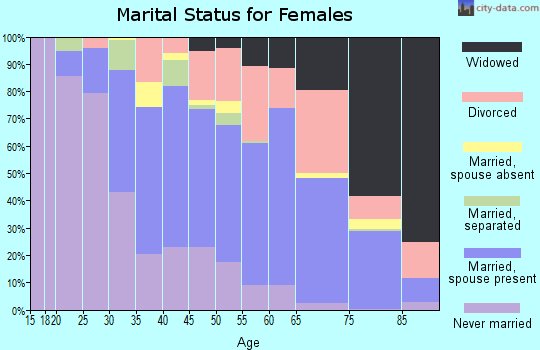
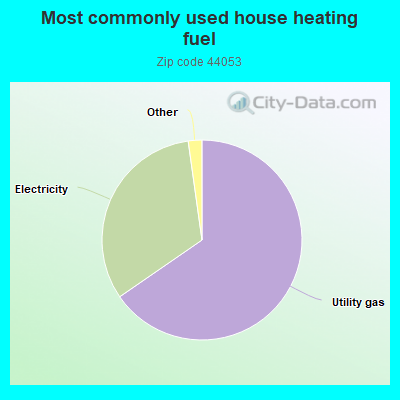
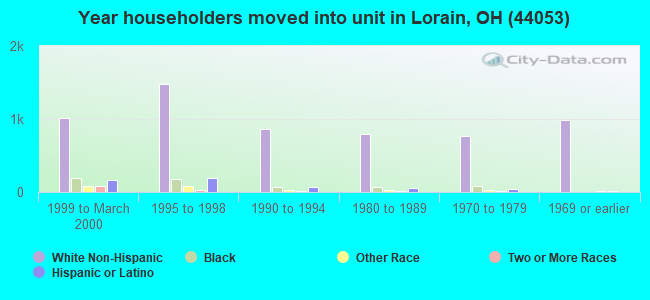
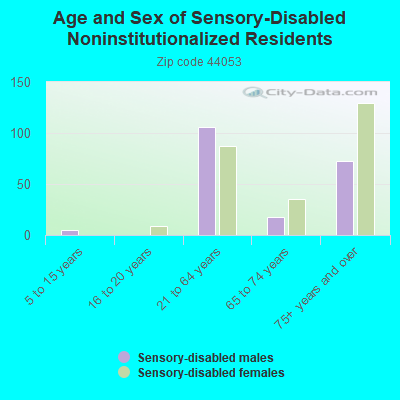
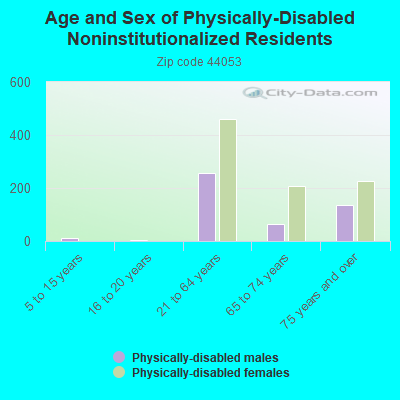
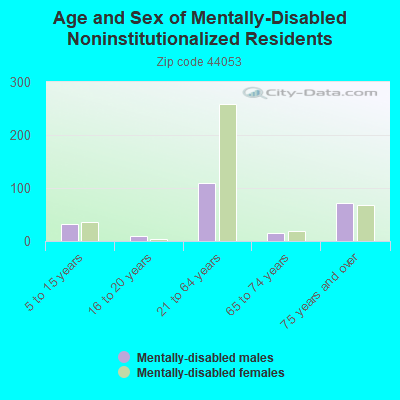
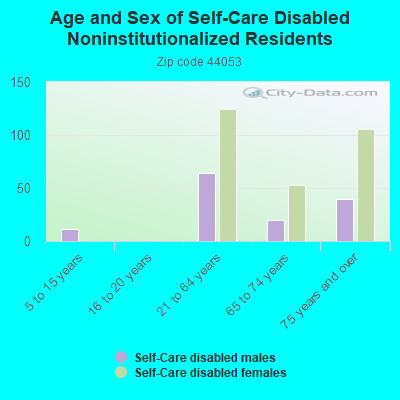
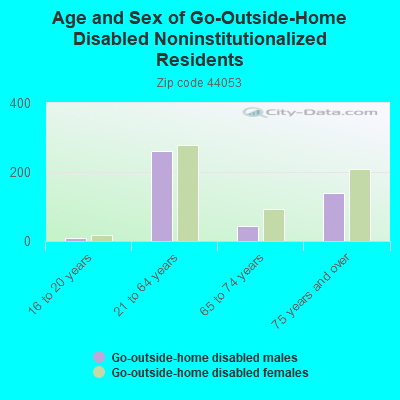
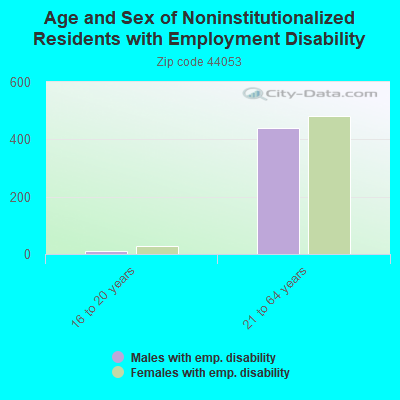
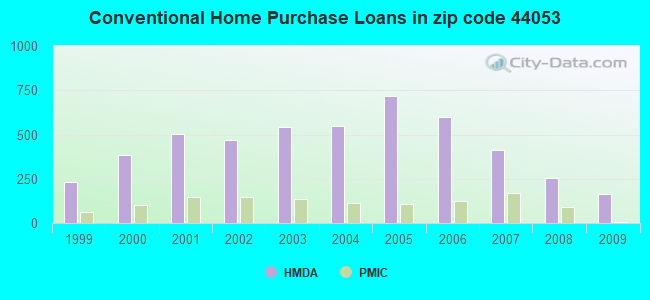
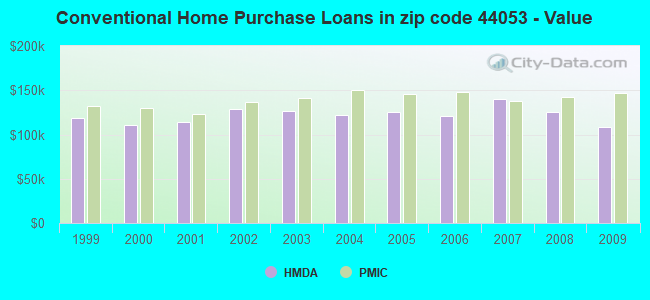
 Based on the data from the years 2002 - 2018 the average number of fires per year is 25. The highest number of reported fire incidents - 65 took place in 2018, and the least - 4 in 2002. The data has a growing trend.
 When looking into fire subcategories, the most reports belonged to: Structure Fires (51.3%), and Outside Fires (30.9%).