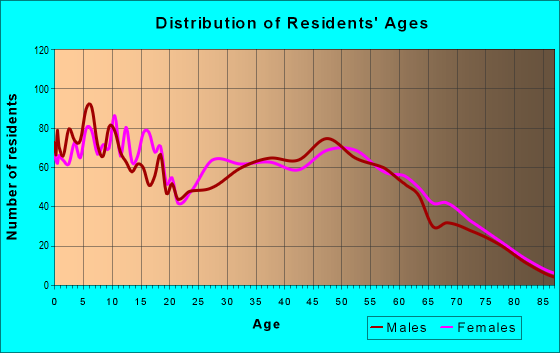
Estimated zip code population in 2022: 8,638 Zip code population in 2010: 9,172 Zip code population in 2000: 8,001
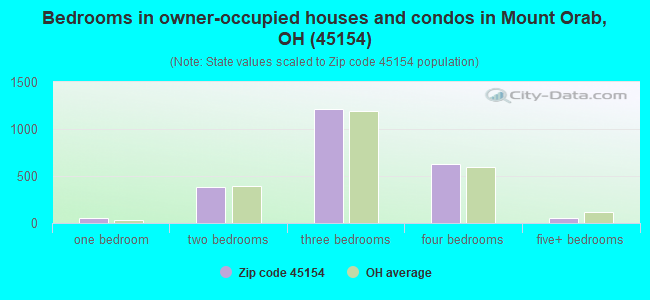
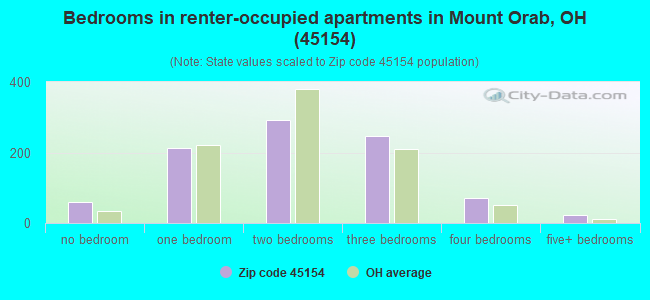
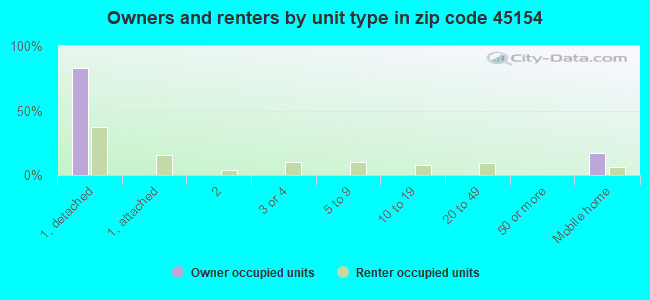
Houses and condos: 3,479 Renter-occupied apartments: 909
% of renters here:
28%
State:
33%
March 2022 cost of living index in zip code 45154: 84.0 (less than average, U.S. average is 100)
Land area: 66.4 sq. mi. Water area: 0.2 sq. mi.
Population density: 130 people per square mile
(very low).
OSM Map
General Map
Google Map
MSN Map
OSM Map
General Map
Google Map
MSN Map
OSM Map
General Map
Google Map
MSN Map
OSM Map
General Map
Google Map
MSN Map
Please wait while loading the map...
Real estate property taxes paid for housing units in 2022:
This zip code:
0.8% ($1,587)
Ohio:
1.3% ($2,639)
Median real estate property taxes paid for housing units with mortgages in 2022: $1,673 (0.8%) Median real estate property taxes paid for housing units with no mortgage in 2022: $1,434 (0.9%)
Averages for the 2020 tax year for zip code 45154, filed in 2021:
Average Adjusted Gross Income (AGI) in 2020: $49,927 (Individual Income Tax Returns)
Here:
$49,927
State:
$67,288
Salary/wage: $45,085 (reported on 83.7% of returns)
Here:
$45,085
State:
$55,628
(% of AGI for various income ranges: 1071.5% for AGIs below $25k, 3494.2% for AGIs $25k-50k, 6571.6% for AGIs $50k-75k, 9658.7% for AGIs $75k-100k, 13645.5% for AGIs $100k-200k)
Taxable interest for individuals: $915 (reported on 17.8% of returns)
This zip code:
$915
Ohio:
$1,518
(% of AGI for various income ranges: 6.7% for AGIs below $25k, 17.3% for AGIs $25k-50k, 21.7% for AGIs $50k-75k, 23.2% for AGIs $75k-100k, 74.5% for AGIs $100k-200k)
Ordinary dividends: $2,295 (reported on 9.4% of returns)
Here:
$2,295
State:
$7,167
(% of AGI for various income ranges: 6.4% for AGIs below $25k, 16.5% for AGIs $25k-50k, 37.1% for AGIs $50k-75k, 53.5% for AGIs $75k-100k, 101.8% for AGIs $100k-200k)
Net capital gain/loss in AGI: +$7,158 (reported on 8.5% of returns)
Here:
+$7,158
State:
+$18,919
(% of AGI for various income ranges: 8.5% for AGIs below $25k, 20.3% for AGIs $25k-50k, 47.1% for AGIs $50k-75k, 86.5% for AGIs $75k-100k, 340.6% for AGIs $100k-200k)
Profit/loss from business: +$12,449 (reported on 12.2% of returns)
Here:
+$12,449
State:
+$13,744
(% of AGI for various income ranges: 105.9% for AGIs below $25k, 138.7% for AGIs $25k-50k, 210.7% for AGIs $50k-75k, 311.0% for AGIs $75k-100k, 609.7% for AGIs $100k-200k)
Taxable individual retirement arrangement distribution: $15,457 (reported on 6.2% of returns)
45154:
$15,457
Ohio:
$18,876
(% of AGI for various income ranges: 31.6% for AGIs below $25k, 56.3% for AGIs $25k-50k, 95.9% for AGIs $50k-75k, 195.8% for AGIs $75k-100k, 671.2% for AGIs $100k-200k)
Total itemized deductions: $33,944 (reported on 2.0% of returns)
Here:
$33,944
State:
$33,869
(% of AGI for various income ranges: 87.4% for AGIs $25k-50k, 238.1% for AGIs $75k-100k, 418.8% for AGIs $100k-200k)
Charity contributions: $12,333 (reported on 1.3% of returns)
Here:
$12,333
State:
$14,577
(% of AGI for various income ranges: 42.2% for AGIs $50k-75k, 150.0% for AGIs $100k-200k)
Taxes paid: $5,856 (reported on 2.0% of returns)
45154:
$5,856
State:
$7,681
(% of AGI for various income ranges: 9.3% for AGIs $25k-50k, 36.1% for AGIs $75k-100k, 95.8% for AGIs $100k-200k)
Earned income credit: $2,296 (reported on 18.5% of returns)
Here:
$2,296
State:
$2,304
(% of AGI for various income ranges: 103.2% for AGIs below $25k, 72.1% for AGIs $25k-50k)
Percentage of individuals using paid preparers for their 2020 taxes: 95.8%
Here:
96%
State:
94%
(% for various income ranges: 94.5% for AGIs below $25k, 96.9% for AGIs $25k-50k, 97.4% for AGIs $50k-75k, 95.6% for AGIs $75k-100k, 95.7% for AGIs $100k-200k, 80.0% for AGIs over 200k)
Averages for the 2012 tax year for zip code 45154, filed in 2013:
Average Adjusted Gross Income (AGI) in 2012: $40,206 (Individual Income Tax Returns)
Here:
$40,206
State:
$54,926
Salary/wage: $36,667 (reported on 86.3% of returns)
Here:
$36,667
State:
$45,869
(% of AGI for various income ranges: 71.8% for AGIs below $25k, 81.9% for AGIs $25k-50k, 82.9% for AGIs $50k-75k, 81.4% for AGIs $75k-100k, 70.9% for AGIs $100k-200k)
Taxable interest for individuals: $825 (reported on 19.9% of returns)
This zip code:
$825
Ohio:
$1,297
(% of AGI for various income ranges: 0.9% for AGIs below $25k, 0.3% for AGIs $25k-50k, 0.3% for AGIs $50k-75k, 0.2% for AGIs $75k-100k, 0.5% for AGIs $100k-200k)
Ordinary dividends: $1,858 (reported on 9.0% of returns)
Here:
$1,858
State:
$5,821
(% of AGI for various income ranges: 0.7% for AGIs below $25k, 0.3% for AGIs $25k-50k, 0.5% for AGIs $50k-75k, 0.2% for AGIs $75k-100k, 0.5% for AGIs $100k-200k)
Net capital gain/loss in AGI: +$3,015 (reported on 6.7% of returns)
Here:
+$3,015
State:
+$11,232
(% of AGI for various income ranges: 0.3% for AGIs below $25k, 0.8% for AGIs $75k-100k, 1.7% for AGIs $100k-200k)
Profit/loss from business: +$8,613 (reported on 13.2% of returns)
Here:
+$8,613
State:
+$12,773
(% of AGI for various income ranges: 8.5% for AGIs below $25k, 2.1% for AGIs $25k-50k, 2.6% for AGIs $50k-75k, 1.3% for AGIs $75k-100k, 1.6% for AGIs $100k-200k)
Taxable individual retirement arrangement distribution: $9,440 (reported on 7.5% of returns)
45154:
$9,440
Ohio:
$14,511
(% of AGI for various income ranges: 2.4% for AGIs below $25k, 1.2% for AGIs $25k-50k, 1.5% for AGIs $50k-75k, 2.6% for AGIs $75k-100k, 1.6% for AGIs $100k-200k)
Total itemized deductions: $15,033 (21% of AGI, reported on 19.4% of returns)
Here:
$15,033
State:
$21,278
Here:
21.0% of AGI
State:
18.8% of AGI
(% of AGI for various income ranges: 3.7% for AGIs below $25k, 4.8% for AGIs $25k-50k, 7.4% for AGIs $50k-75k, 10.0% for AGIs $75k-100k, 10.8% for AGIs $100k-200k)
Charity contributions: $3,179 (reported on 11.7% of returns)
Here:
$3,179
State:
$3,943
(% of AGI for various income ranges: 0.4% for AGIs below $25k, 0.6% for AGIs $25k-50k, 0.8% for AGIs $50k-75k, 1.2% for AGIs $75k-100k, 1.8% for AGIs $100k-200k)
Taxes paid: $4,648 (reported on 19.2% of returns)
45154:
$4,648
State:
$9,568
(% of AGI for various income ranges: 0.4% for AGIs below $25k, 1.1% for AGIs $25k-50k, 2.2% for AGIs $50k-75k, 3.1% for AGIs $75k-100k, 4.3% for AGIs $100k-200k)
Earned income credit: $2,431 (reported on 22.6% of returns)
Here:
$2,431
State:
$2,285
(% of AGI for various income ranges: 8.0% for AGIs below $25k, 1.2% for AGIs $25k-50k)
Percentage of individuals using paid preparers for their 2012 taxes: 59.2%
Here:
59%
State:
51%
(% for various income ranges: 53.8% for AGIs below $25k, 61.6% for AGIs $25k-50k, 63.5% for AGIs $50k-75k, 65.6% for AGIs $75k-100k, 63.6% for AGIs $100k-200k)
Averages for the 2004 tax year for zip code 45154, filed in 2005:
Average Adjusted Gross Income (AGI) in 2004: $34,673 (Individual Income Tax Returns)
Here:
$34,673
State:
$44,480
Salary/wage: $32,055 (reported on 89.7% of returns)
Here:
$32,055
State:
$39,198
(% of AGI for various income ranges: 93.3% for AGIs below $10k, 80.2% for AGIs $10k-25k, 87.5% for AGIs $25k-50k, 84.6% for AGIs $50k-75k, 82.7% for AGIs $75k-100k, 65.4% for AGIs over 100k)
Taxable interest for individuals: $841 (reported on 29.7% of returns)
This zip code:
$841
Ohio:
$1,532
(% of AGI for various income ranges: 2.4% for AGIs below $10k, 1.2% for AGIs $10k-25k, 0.3% for AGIs $25k-50k, 0.7% for AGIs $50k-75k, 0.2% for AGIs $75k-100k, 1.7% for AGIs over 100k)
Taxable dividends: $1,588 (reported on 10.1% of returns)
Here:
$1,588
State:
$3,496
(% of AGI for various income ranges: 1.1% for AGIs below $10k, 0.6% for AGIs $10k-25k, 0.4% for AGIs $25k-50k, 0.2% for AGIs $50k-75k, 0.2% for AGIs $75k-100k, 1.4% for AGIs over 100k)
Net capital gain/loss: +$5,206 (reported on 7.8% of returns)
Here:
+$5,206
State:
+$8,582
(% of AGI for various income ranges: -0.7% for AGIs below $10k, 0.3% for AGIs $10k-25k, 0.3% for AGIs $25k-50k, 0.6% for AGIs $50k-75k, 0.8% for AGIs $75k-100k, 7.3% for AGIs over 100k)
Profit/loss from business: +$7,776 (reported on 12.8% of returns)
Here:
+$7,776
State:
+$10,813
(% of AGI for various income ranges: 10.6% for AGIs below $10k, 4.2% for AGIs $10k-25k, 2.7% for AGIs $25k-50k, 2.9% for AGIs $50k-75k, 2.2% for AGIs $75k-100k, 0.7% for AGIs over 100k)
IRA payment deduction: $2,712 (reported on 1.3% of returns)
45154:
$2,712
Ohio:
$2,794
Total itemized deductions: $12,440 (22% of AGI, reported on 27.1% of returns)
Here:
$12,440
State:
$17,503
Here:
22.2% of AGI
State:
20.8% of AGI
(% of AGI for various income ranges: 4.6% for AGIs below $10k, 5.9% for AGIs $10k-25k, 8.7% for AGIs $25k-50k, 11.5% for AGIs $50k-75k, 12.8% for AGIs $75k-100k, 11.1% for AGIs over 100k)
Charity contributions deductions: $2,244 (4% of AGI, reported on 17.0% of returns)
Here:
$2,244
State:
$3,087
Here:
3.7% of AGI
State:
3.4% of AGI
(% of AGI for various income ranges: 0.6% for AGIs below $10k, 0.6% for AGIs $10k-25k, 0.7% for AGIs $25k-50k, 1.2% for AGIs $50k-75k, 1.8% for AGIs $75k-100k, 2.0% for AGIs over 100k)
Total tax: $3,758 (reported on 76.3% of returns)
45154:
$3,758
State:
$6,781
(% of AGI for various income ranges: 2.7% for AGIs below $10k, 4.4% for AGIs $10k-25k, 6.9% for AGIs $25k-50k, 8.6% for AGIs $50k-75k, 10.4% for AGIs $75k-100k, 15.7% for AGIs over 100k)
Earned income credit: $1,792 (reported on 16.2% of returns)
Here:
$1,792
State:
$1,696
Percentage of individuals using paid preparers for their 2004 taxes: 64.4%
Here:
64%
State:
55%
(% for various income ranges: 49.4% for AGIs below $10k, 65.9% for AGIs $10k-25k, 70.0% for AGIs $25k-50k, 64.5% for AGIs $50k-75k, 65.0% for AGIs $75k-100k, 77.1% for AGIs over 100k)
Household received Food Stamps/SNAP in the past 12 months: 532 Household did not receive Food Stamps/SNAP in the past 12 months: 2,708
Women who had a birth in the past 12 months: 203 (171 now married, 34 unmarried) Women who did not have a birth in the past 12 months: 1,877 (864 now married, 1,012 unmarried)
Housing units in zip code 45154 with a mortgage: 1,284 (105 second mortgage, 67 both second mortgage and home equity loan) Houses without a mortgage: 93
Median monthly owner costs for units with a mortgage: $1,215 Median monthly owner costs for units without a mortgage: $440
Residents with income below the poverty level in 2022:
This zip code:
18.3%
Whole state:
13.4%
Residents with income below 50% of the poverty level in 2022:
This zip code:
11.3%
Whole state:
7.0%
Median number of rooms in houses and condos:
Here:
6.3
State:
6.7
Median number of rooms in apartments:
Here:
4.4
State:
4.4
Notable locations in this zip code not listed on our city pages
Churches in zip code 45154 include: Fivemile Church (A), Liberty Chapel (B), Salem Church (C), Union Plains United Methodist Church (D), First Baptist Church (E), Saint Michael Catholic Church (F), Mount Orab Church of Christ (G), Bible Baptist Church (H). Display/hide their locations on the map
Cemeteries: Bratton Cemetery (1), Brooks Cemetery (2), Buford Cemetery (3), Star Lake Cemetery (4), Taylors Chapel Cemetery (5), Vance Cemetery (6), Higgins Cemetery (7). Display/hide their locations on the map
Streams, rivers, and creeks: Indian Camp Run (A), East Fork Fivemile Creek (B), Plum Creek (C), Yellow Run (D), Ruble Run (E). Display/hide their locations on the map
1,405 married couples with children.
529 single-parent households (42 men, 487 women).
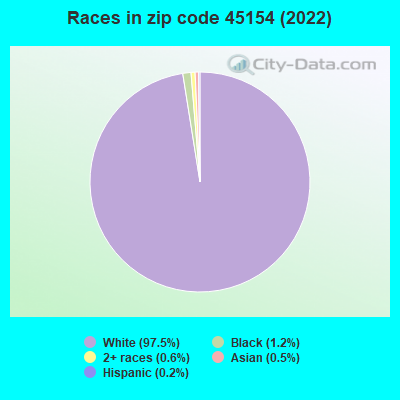
99.1% of residents of 45154 zip code speak English at home.
0.4% of residents speak other Indo-European language at home (28% very well, 72% well).
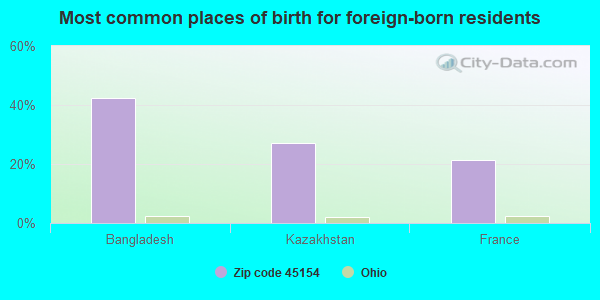
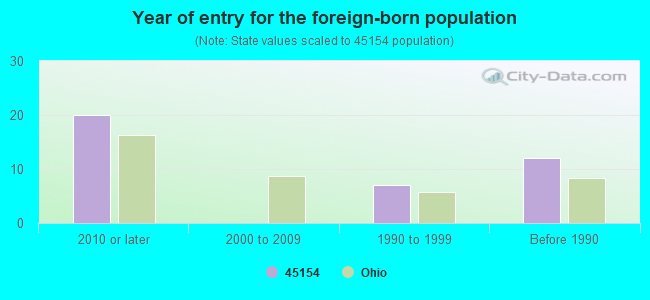
Foreign born population: 33 (0.4%) (61.0% of them are naturalized citizens)
This zip code:
0.4%
Whole state:
5.0%
42%Bangladesh
27%Kazakhstan
21%France
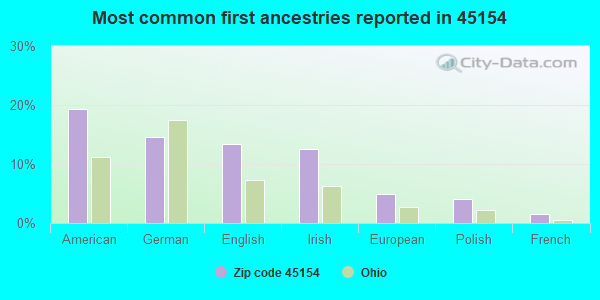
19%American
15%German
13%English
12%Irish
5%European
4%Polish
2%French
Year of entry for the foreign-born population
202010 or later
02000 to 2009
71990 to 1999
12Before 1990
Facilities with environmental interests located in this zip code:
BARBER'S AUTO SALVAGE (119 SOUTH HIGH STREET in MT. ORAB, OH)
National Pollutant Discharge Elimination System NON-MAJOR (Tracking pollutant discharge elimination systems) - permit - ICIS-05-2002-2000, ENFORCEMENT/COMPLIANCE ACTIVITY, ICIS-05-2005-0314, National Pollutant Discharge Elimination System NON-MAJOR (Tracking pollutant discharge elimination systems) - permit Alternative names: BARBER TRACKING, BARBER TRUCKING
Housing units lacking complete plumbing facilities: 1.5% Housing units lacking complete kitchen facilities: 1.4%
54.8%Electricity
22.9%Utility gas
11.8%Bottled, tank, or LP gas
6.5%Wood
2.1%Fuel oil, kerosene, etc.
1.1%Other fuel
1.0%No fuel used
Population in 1990: 8,247.
Place of birth for U.S.-born residents:
This state: 7,666
Northeast: 47
Midwest: 113
South: 681
West: 66
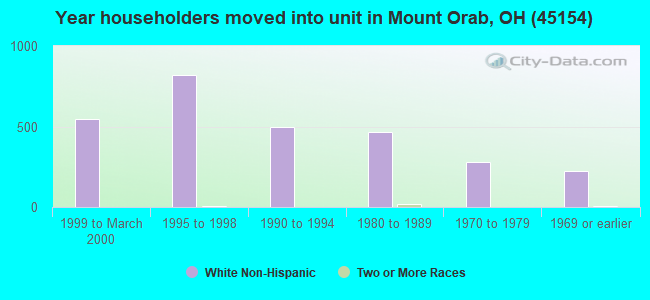
57% of the 45154 zip code residents lived in the same house 5 years ago. Out of people who lived in different houses, 41% lived in this county. Out of people who lived in different counties, 50% lived in Ohio.
89% of the 45154 zip code residents lived in the same house 1 year ago. Out of people who lived in different houses, 72% moved from this county. Out of people who lived in different houses, 18% moved from different county within same state. Out of people who lived in different houses, 5% moved from different state.
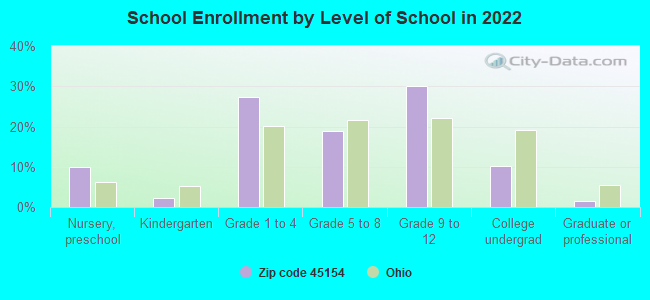
Private vs. public school enrollment:
Students in private schools in grades 1 to 8 (elementary and middle school): 84
Here:
9.5%
Ohio:
16.0%
Students in private schools in grades 9 to 12 (high school):
Here:
0.0%
Ohio:
13.1%
Students in private undergraduate colleges: 16
Here:
8.3%
Ohio:
22.3%
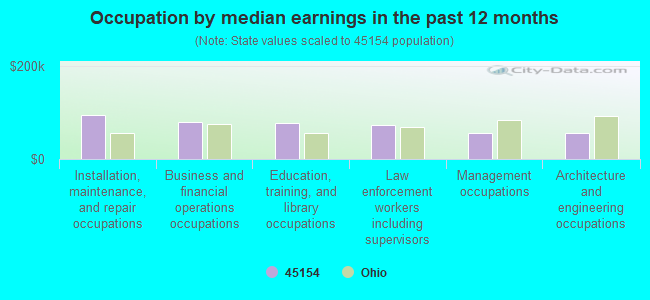
Occupation by median earnings in the past 12 months ($)
93,727Installation, maintenance, and repair occupations
80,239Business and financial operations occupations
77,168Education, training, and library occupations
72,229Law enforcement workers including supervisors
55,459Management occupations
55,091Architecture and engineering occupations
Top industries in this zip code by the number of employees in 2005:
Other Services (except Public Administration): Commercial and Industrial Machinery and Equipment (except Automotive and Electronic) Repair and Maintenance (20-49: 1, 1-4: 1)
People in group quarters in 2010:
13 people in group homes intended for adults
People in group quarters in 2000:
9 people in other group homes
Fatal accident statistics in 2014:
Fatal accident count: 1
Vehicles involved in fatal accidents: 1
Fatal accidents caused by drunken drivers: 1
Fatalities: 1
Persons involved in fatal accidents: 1
Pedestrians involved in fatal accidents: 0
Fatal accident statistics in 2013:
Fatal accident count: 3
Vehicles involved in fatal accidents: 6
Fatal accidents caused by drunken drivers: 0
Fatalities: 4
Persons involved in fatal accidents: 7
Pedestrians involved in fatal accidents: 0
Home Mortgage Disclosure Act Aggregated Statistics For Year 2009 (Based on 4 partial tracts)
A) FHA, FSA/RHS & VA Home Purchase Loans
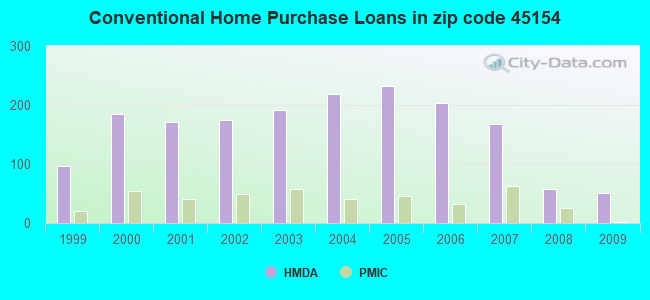
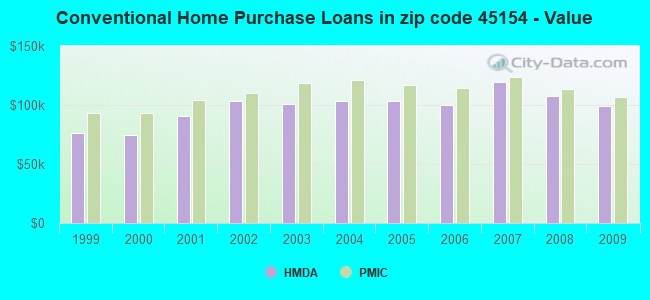
B) Conventional Home Purchase Loans
C) Refinancings
D) Home Improvement Loans
E) Loans on Dwellings For 5+ Families
F) Non-occupant Loans on < 5 Family Dwellings (A B C & D)
G) Loans On Manufactured Home Dwelling (A B C & D)
Number
Average Value
Number
Average Value
Number
Average Value
Number
Average Value
Number
Average Value
Number
Average Value
Number
Average Value
LOANS ORIGINATED
75
$98,924
51
$98,994
282
$128,219
7
$35,850
2
$313,175
29
$116,617
44
$71,008
APPLICATIONS APPROVED, NOT ACCEPTED
9
$94,883
3
$62,123
35
$125,843
0
$0
0
$0
0
$0
10
$88,277
APPLICATIONS DENIED
31
$111,193
17
$106,949
180
$126,232
21
$36,814
0
$0
11
$122,020
32
$77,766
APPLICATIONS WITHDRAWN
9
$138,237
7
$76,753
70
$132,553
2
$61,680
0
$0
3
$90,633
5
$96,738
FILES CLOSED FOR INCOMPLETENESS
0
$0
1
$123,020
25
$122,277
1
$33,430
0
$0
0
$0
3
$108,640
Aggregated Statistics For Year 2008 (Based on 4 partial tracts)
A) FHA, FSA/RHS & VA Home Purchase Loans
B) Conventional Home Purchase Loans
C) Refinancings
D) Home Improvement Loans
F) Non-occupant Loans on < 5 Family Dwellings (A B C & D)
G) Loans On Manufactured Home Dwelling (A B C & D)
Number
Average Value
Number
Average Value
Number
Average Value
Number
Average Value
Number
Average Value
Number
Average Value
LOANS ORIGINATED
83
$101,475
58
$107,761
196
$124,995
19
$62,548
31
$129,756
51
$81,067
APPLICATIONS APPROVED, NOT ACCEPTED
6
$82,095
8
$93,788
35
$107,019
4
$28,068
2
$79,930
8
$48,376
APPLICATIONS DENIED
20
$95,258
32
$82,438
173
$122,326
41
$50,688
4
$48,675
43
$68,845
APPLICATIONS WITHDRAWN
8
$100,405
15
$108,209
68
$118,769
5
$97,826
5
$86,760
12
$93,359
FILES CLOSED FOR INCOMPLETENESS
2
$113,670
3
$118,050
17
$146,819
1
$188,820
2
$101,095
0
$0
Aggregated Statistics For Year 2007 (Based on 4 partial tracts)
A) FHA, FSA/RHS & VA Home Purchase Loans
B) Conventional Home Purchase Loans
C) Refinancings
D) Home Improvement Loans
E) Loans on Dwellings For 5+ Families
F) Non-occupant Loans on < 5 Family Dwellings (A B C & D)
G) Loans On Manufactured Home Dwelling (A B C & D)
Number
Average Value
Number
Average Value
Number
Average Value
Number
Average Value
Number
Average Value
Number
Average Value
Number
Average Value
LOANS ORIGINATED
60
$112,564
167
$119,166
268
$115,725
40
$38,264
2
$1,772,015
40
$119,823
73
$84,827
APPLICATIONS APPROVED, NOT ACCEPTED
2
$99,760
12
$115,002
50
$98,586
10
$54,399
0
$0
3
$69,980
12
$77,352
APPLICATIONS DENIED
24
$105,643
55
$82,739
355
$111,474
64
$51,484
0
$0
18
$79,396
69
$78,947
APPLICATIONS WITHDRAWN
15
$103,191
27
$108,443
107
$111,825
3
$40,700
0
$0
6
$118,818
11
$96,845
FILES CLOSED FOR INCOMPLETENESS
1
$54,130
5
$74,814
34
$138,615
4
$92,935
0
$0
1
$89,590
2
$94,555
Aggregated Statistics For Year 2006 (Based on 4 partial tracts)
A) FHA, FSA/RHS & VA Home Purchase Loans
B) Conventional Home Purchase Loans
C) Refinancings
D) Home Improvement Loans
F) Non-occupant Loans on < 5 Family Dwellings (A B C & D)
G) Loans On Manufactured Home Dwelling (A B C & D)
Number
Average Value
Number
Average Value
Number
Average Value
Number
Average Value
Number
Average Value
Number
Average Value
LOANS ORIGINATED
58
$119,461
204
$100,001
288
$107,914
53
$43,999
42
$92,347
71
$79,354
APPLICATIONS APPROVED, NOT ACCEPTED
12
$87,359
28
$85,870
71
$97,632
13
$35,955
4
$76,482
25
$79,411
APPLICATIONS DENIED
10
$107,370
71
$100,901
351
$112,979
77
$44,603
12
$151,308
76
$75,956
APPLICATIONS WITHDRAWN
6
$134,338
29
$96,965
142
$122,196
11
$39,456
5
$70,042
19
$79,878
FILES CLOSED FOR INCOMPLETENESS
0
$0
5
$130,452
42
$133,072
3
$40,097
2
$171,890
1
$47,200
Aggregated Statistics For Year 2005 (Based on 4 partial tracts)
A) FHA, FSA/RHS & VA Home Purchase Loans
B) Conventional Home Purchase Loans
C) Refinancings
D) Home Improvement Loans
E) Loans on Dwellings For 5+ Families
F) Non-occupant Loans on < 5 Family Dwellings (A B C & D)
G) Loans On Manufactured Home Dwelling (A B C & D)
Number
Average Value
Number
Average Value
Number
Average Value
Number
Average Value
Number
Average Value
Number
Average Value
Number
Average Value
LOANS ORIGINATED
62
$114,488
233
$103,131
350
$105,708
46
$49,361
4
$571,652
44
$92,304
106
$82,707
APPLICATIONS APPROVED, NOT ACCEPTED
4
$109,465
33
$77,225
88
$105,219
11
$30,549
0
$0
4
$78,590
22
$77,570
APPLICATIONS DENIED
16
$86,879
123
$80,895
402
$102,204
78
$40,223
0
$0
23
$68,435
137
$71,610
APPLICATIONS WITHDRAWN
4
$122,852
39
$78,136
187
$115,267
12
$91,269
0
$0
13
$90,571
28
$81,715
FILES CLOSED FOR INCOMPLETENESS
2
$84,025
23
$73,771
26
$142,923
1
$50,350
0
$0
2
$72,335
2
$103,915
Aggregated Statistics For Year 2004 (Based on 4 partial tracts)
A) FHA, FSA/RHS & VA Home Purchase Loans
B) Conventional Home Purchase Loans
C) Refinancings
D) Home Improvement Loans
F) Non-occupant Loans on < 5 Family Dwellings (A B C & D)
G) Loans On Manufactured Home Dwelling (A B C & D)
Number
Average Value
Number
Average Value
Number
Average Value
Number
Average Value
Number
Average Value
Number
Average Value
LOANS ORIGINATED
65
$105,637
219
$103,540
441
$101,224
43
$32,982
40
$88,598
77
$88,366
APPLICATIONS APPROVED, NOT ACCEPTED
5
$85,066
27
$91,207
106
$93,936
7
$48,956
3
$69,023
29
$76,588
APPLICATIONS DENIED
24
$102,523
68
$74,374
358
$94,154
57
$35,733
6
$108,983
80
$78,057
APPLICATIONS WITHDRAWN
7
$116,036
28
$103,081
187
$108,146
10
$41,120
6
$66,133
23
$96,406
FILES CLOSED FOR INCOMPLETENESS
5
$111,116
8
$78,488
44
$108,659
5
$15,010
0
$0
1
$155,460
Aggregated Statistics For Year 2003 (Based on 4 partial tracts)
A) FHA, FSA/RHS & VA Home Purchase Loans
B) Conventional Home Purchase Loans
C) Refinancings
D) Home Improvement Loans
F) Non-occupant Loans on < 5 Family Dwellings (A B C & D)
Number
Average Value
Number
Average Value
Number
Average Value
Number
Average Value
Number
Average Value
LOANS ORIGINATED
63
$106,423
191
$100,728
860
$101,161
37
$33,662
46
$108,255
APPLICATIONS APPROVED, NOT ACCEPTED
4
$98,035
22
$67,857
155
$98,818
6
$18,120
4
$65,370
APPLICATIONS DENIED
25
$92,827
56
$61,361
367
$93,307
43
$25,363
9
$60,767
APPLICATIONS WITHDRAWN
5
$116,176
23
$116,849
187
$101,535
6
$27,050
7
$129,960
FILES CLOSED FOR INCOMPLETENESS
2
$99,445
6
$72,940
60
$95,966
1
$9,440
2
$77,565
Aggregated Statistics For Year 2002 (Based on 4 partial tracts)
A) FHA, FSA/RHS & VA Home Purchase Loans
B) Conventional Home Purchase Loans
C) Refinancings
D) Home Improvement Loans
F) Non-occupant Loans on < 5 Family Dwellings (A B C & D)
Number
Average Value
Number
Average Value
Number
Average Value
Number
Average Value
Number
Average Value
LOANS ORIGINATED
77
$102,201
174
$103,147
639
$95,833
66
$24,034
49
$89,320
APPLICATIONS APPROVED, NOT ACCEPTED
4
$85,350
34
$69,266
159
$95,053
6
$48,317
2
$24,190
APPLICATIONS DENIED
14
$90,242
81
$66,658
383
$93,681
45
$24,201
9
$61,976
APPLICATIONS WITHDRAWN
4
$91,582
18
$108,702
148
$96,615
6
$27,180
5
$81,860
FILES CLOSED FOR INCOMPLETENESS
3
$111,280
4
$56,245
46
$103,710
4
$36,895
0
$0
Aggregated Statistics For Year 2001 (Based on 4 partial tracts)
A) FHA, FSA/RHS & VA Home Purchase Loans
B) Conventional Home Purchase Loans
C) Refinancings
D) Home Improvement Loans
F) Non-occupant Loans on < 5 Family Dwellings (A B C & D)
Number
Average Value
Number
Average Value
Number
Average Value
Number
Average Value
Number
Average Value
LOANS ORIGINATED
100
$95,057
171
$90,599
556
$88,698
62
$18,311
32
$81,164
APPLICATIONS APPROVED, NOT ACCEPTED
7
$96,903
34
$70,633
133
$82,503
20
$21,625
6
$61,277
APPLICATIONS DENIED
9
$78,540
98
$53,078
366
$78,108
53
$13,932
15
$83,417
APPLICATIONS WITHDRAWN
8
$86,019
13
$105,409
195
$88,046
10
$23,215
3
$38,470
FILES CLOSED FOR INCOMPLETENESS
2
$94,410
1
$22,660
31
$85,031
1
$40,910
1
$22,660
Aggregated Statistics For Year 2000 (Based on 4 partial tracts)
A) FHA, FSA/RHS & VA Home Purchase Loans
B) Conventional Home Purchase Loans
C) Refinancings
D) Home Improvement Loans
F) Non-occupant Loans on < 5 Family Dwellings (A B C & D)
Number
Average Value
Number
Average Value
Number
Average Value
Number
Average Value
Number
Average Value
LOANS ORIGINATED
46
$99,672
184
$74,523
237
$72,470
66
$13,810
28
$69,914
APPLICATIONS APPROVED, NOT ACCEPTED
8
$67,782
59
$62,237
112
$75,832
15
$8,638
2
$48,780
APPLICATIONS DENIED
20
$77,016
169
$54,010
251
$70,135
83
$19,421
10
$49,754
APPLICATIONS WITHDRAWN
8
$70,851
19
$85,489
91
$66,106
8
$34,429
0
$0
FILES CLOSED FOR INCOMPLETENESS
1
$39,650
8
$75,072
25
$83,388
0
$0
0
$0
Aggregated Statistics For Year 1999 (Based on 2 partial tracts)
A) FHA, FSA/RHS & VA Home Purchase Loans
B) Conventional Home Purchase Loans
C) Refinancings
D) Home Improvement Loans
F) Non-occupant Loans on < 5 Family Dwellings (A B C & D)
Detailed PMIC statistics for the following Tracts:9512.00
, 9513.00
2002 - 2018 National Fire Incident Reporting System (NFIRS) incidents
According to the data from the years 2002 - 2018 the average number of fire incidents per year is 63. The highest number of fires - 99 took place in 2007, and the least - 31 in 2015. The data has a growing trend.
When looking into fire subcategories, the most incidents belonged to: Outside Fires (43.2%), and Structure Fires (41.1%).
Fire incident types reported to NFIRS in Zip Code 45154
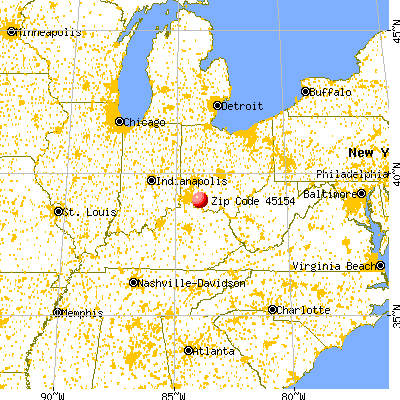


 Nearest zip codes: 45118, 45176, 45145, 45171, 45155, 45130.


 According to the data from the years 2002 - 2018 the average number of fire incidents per year is 63. The highest number of fires - 99 took place in 2007, and the least - 31 in 2015. The data has a growing trend.
 When looking into fire subcategories, the most incidents belonged to: Outside Fires (43.2%), and Structure Fires (41.1%).