Estimated zip code population in 2022: 5,278 Zip code population in 2010: 5,002 Zip code population in 2000: 5,309
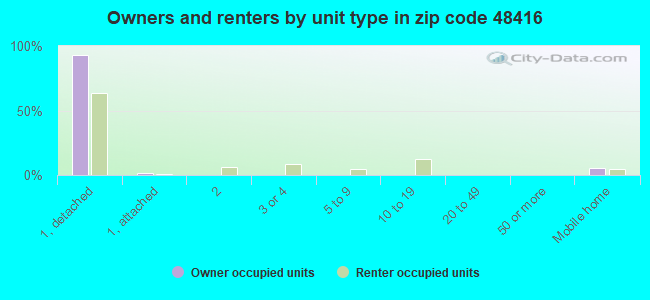
Houses and condos: 2,067 Renter-occupied apartments: 317
% of renters here:
16%
State:
27%
March 2022 cost of living index in zip code 48416: 81.2 (low, U.S. average is 100)
Land area: 112.1 sq. mi. Water area: 0.8 sq. mi.
Population density: 47 people per square mile
(very low).
OSM Map
General Map
Google Map
MSN Map
OSM Map
General Map
Google Map
MSN Map
OSM Map
General Map
Google Map
MSN Map
OSM Map
General Map
Google Map
MSN Map
Please wait while loading the map...
Real estate property taxes paid for housing units in 2022:
This zip code:
0.8% ($1,512)
Michigan:
1.2% ($2,746)
Median real estate property taxes paid for housing units with mortgages in 2022: $1,468 (0.7%) Median real estate property taxes paid for housing units with no mortgage in 2022: $1,619 (0.9%)
Business Search- 14 Million verified businesses
Males: 2,634
(49.9%)
Females: 2,644
(50.1%)
For population 25 years and over in 48416:
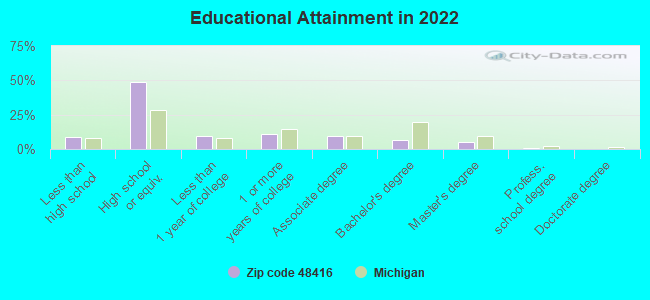
High school or higher: 89.9%
Bachelor's degree or higher: 12.6%
Graduate or professional degree: 5.9%
Unemployed: 5.4%
Mean travel time to work (commute): 31.0 minutes
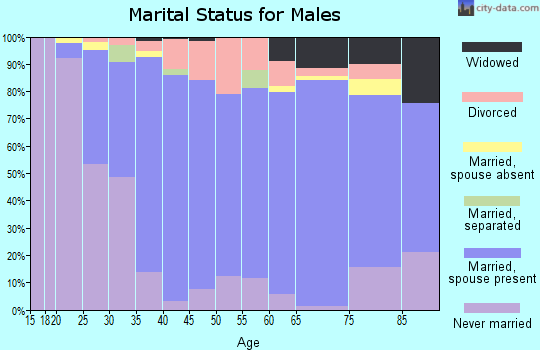
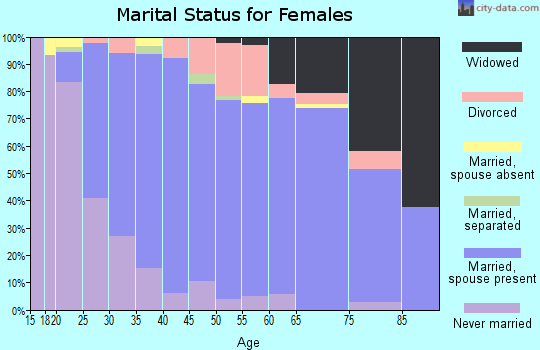
For population 15 years and over in 48416:
Never married: 27.0%
Now married: 55.5%
Separated: 1.1%
Widowed: 6.4%
Divorced: 10.1%
Zip code 48416 compared to state average:
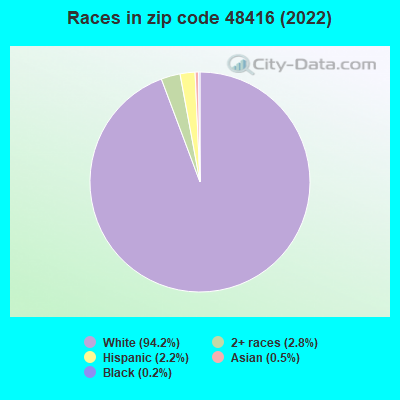
Black race population percentage significantly below state average.
Hispanic race population percentage below state average.
Foreign-born population percentage significantly below state average.
Renting percentage below state average.
Length of stay since moving in significantly above state average.
Percentage of population with a bachelor's degree or higher significantly below state average.
Averages for the 2020 tax year for zip code 48416, filed in 2021:
Average Adjusted Gross Income (AGI) in 2020: $50,255 (Individual Income Tax Returns)
Here:
$50,255
State:
$68,945
Salary/wage: $43,913 (reported on 76.0% of returns)
Here:
$43,913
State:
$57,142
(% of AGI for various income ranges: 1000.2% for AGIs below $25k, 3284.3% for AGIs $25k-50k, 6101.6% for AGIs $50k-75k, 9835.0% for AGIs $75k-100k, 16383.6% for AGIs $100k-200k)
Taxable interest for individuals: $1,100 (reported on 27.1% of returns)
This zip code:
$1,100
Michigan:
$1,630
(% of AGI for various income ranges: 22.4% for AGIs below $25k, 17.0% for AGIs $25k-50k, 44.4% for AGIs $50k-75k, 34.3% for AGIs $75k-100k, 70.7% for AGIs $100k-200k)
Ordinary dividends: $3,170 (reported on 13.3% of returns)
Here:
$3,170
State:
$6,972
(% of AGI for various income ranges: 13.7% for AGIs below $25k, 31.5% for AGIs $25k-50k, 73.2% for AGIs $50k-75k, 105.7% for AGIs $75k-100k, 286.4% for AGIs $100k-200k)
Net capital gain/loss in AGI: +$9,181 (reported on 13.8% of returns)
Here:
+$9,181
State:
+$20,064
(% of AGI for various income ranges: 4.4% for AGIs below $25k, 2.8% for AGIs $25k-50k, 26.8% for AGIs $50k-75k, 294.3% for AGIs $75k-100k, 1664.3% for AGIs $100k-200k)
Profit/loss from business: +$8,018 (reported on 17.3% of returns)
Here:
+$8,018
State:
+$11,172
(% of AGI for various income ranges: 126.1% for AGIs below $25k, 198.9% for AGIs $25k-50k, 180.4% for AGIs $50k-75k, 285.0% for AGIs $75k-100k, 486.4% for AGIs $100k-200k)
Taxable individual retirement arrangement distribution: $12,656 (reported on 8.0% of returns)
48416:
$12,656
Michigan:
$19,803
(% of AGI for various income ranges: 62.4% for AGIs below $25k, 86.7% for AGIs $25k-50k, 94.0% for AGIs $50k-75k, 145.7% for AGIs $75k-100k, 787.9% for AGIs $100k-200k)
Total itemized deductions: $34,725 (reported on 1.8% of returns)
Here:
$34,725
State:
$34,117
(% of AGI for various income ranges: 992.1% for AGIs $75k-100k)
Charity contributions: $5,600 (reported on 1.3% of returns)
Here:
$5,600
State:
$13,548
(% of AGI for various income ranges: 120.0% for AGIs $75k-100k)
Taxes paid: $6,175 (reported on 1.8% of returns)
48416:
$6,175
State:
$7,972
(% of AGI for various income ranges: 176.4% for AGIs $75k-100k)
Earned income credit: $2,126 (reported on 15.1% of returns)
Here:
$2,126
State:
$2,251
(% of AGI for various income ranges: 75.2% for AGIs below $25k, 68.9% for AGIs $25k-50k)
Percentage of individuals using paid preparers for their 2020 taxes: 94.2%
Here:
94%
State:
93%
(% for various income ranges: 93.8% for AGIs below $25k, 93.5% for AGIs $25k-50k, 94.1% for AGIs $50k-75k, 95.2% for AGIs $75k-100k, 95.8% for AGIs $100k-200k, 100.0% for AGIs over 200k)
Averages for the 2012 tax year for zip code 48416, filed in 2013:
Average Adjusted Gross Income (AGI) in 2012: $41,724 (Individual Income Tax Returns)
Here:
$41,724
State:
$55,609
Salary/wage: $35,608 (reported on 80.8% of returns)
Here:
$35,608
State:
$46,782
(% of AGI for various income ranges: 62.3% for AGIs below $25k, 71.7% for AGIs $25k-50k, 74.1% for AGIs $50k-75k, 77.6% for AGIs $75k-100k, 58.9% for AGIs $100k-200k)
Taxable interest for individuals: $1,291 (reported on 30.4% of returns)
This zip code:
$1,291
Michigan:
$1,491
(% of AGI for various income ranges: 1.9% for AGIs below $25k, 0.9% for AGIs $25k-50k, 0.8% for AGIs $50k-75k, 0.4% for AGIs $75k-100k, 1.0% for AGIs $100k-200k)
Ordinary dividends: $1,718 (reported on 13.1% of returns)
Here:
$1,718
State:
$6,225
(% of AGI for various income ranges: 0.8% for AGIs below $25k, 0.6% for AGIs $25k-50k, 0.6% for AGIs $50k-75k, 0.6% for AGIs $75k-100k, 0.3% for AGIs $100k-200k)
Net capital gain/loss in AGI: +$4,888 (reported on 11.7% of returns)
Here:
+$4,888
State:
+$9,326
(% of AGI for various income ranges: 0.5% for AGIs below $25k, 0.5% for AGIs $25k-50k, 0.4% for AGIs $50k-75k, 4.5% for AGIs $100k-200k)
Profit/loss from business: +$7,750 (reported on 16.8% of returns)
Here:
+$7,750
State:
+$11,523
(% of AGI for various income ranges: 9.4% for AGIs below $25k, 4.4% for AGIs $25k-50k, 2.5% for AGIs $50k-75k, 2.4% for AGIs $75k-100k)
Taxable individual retirement arrangement distribution: $9,095 (reported on 9.3% of returns)
48416:
$9,095
Michigan:
$15,298
(% of AGI for various income ranges: 3.2% for AGIs below $25k, 2.0% for AGIs $25k-50k, 1.7% for AGIs $50k-75k, 4.3% for AGIs $75k-100k)
Total itemized deductions: $17,195 (24% of AGI, reported on 20.1% of returns)
Here:
$17,195
State:
$21,628
Here:
23.8% of AGI
State:
18.4% of AGI
(% of AGI for various income ranges: 7.1% for AGIs below $25k, 5.6% for AGIs $25k-50k, 9.3% for AGIs $50k-75k, 10.9% for AGIs $75k-100k, 8.2% for AGIs $100k-200k)
Charity contributions: $2,912 (reported on 15.4% of returns)
Here:
$2,912
State:
$4,225
(% of AGI for various income ranges: 0.4% for AGIs below $25k, 1.1% for AGIs $25k-50k, 1.0% for AGIs $50k-75k, 1.3% for AGIs $75k-100k, 1.2% for AGIs $100k-200k)
Taxes paid: $4,837 (reported on 20.1% of returns)
48416:
$4,837
State:
$8,327
(% of AGI for various income ranges: 1.3% for AGIs below $25k, 1.3% for AGIs $25k-50k, 2.4% for AGIs $50k-75k, 3.0% for AGIs $75k-100k, 3.2% for AGIs $100k-200k)
Earned income credit: $2,234 (reported on 20.6% of returns)
Here:
$2,234
State:
$2,306
(% of AGI for various income ranges: 6.1% for AGIs below $25k, 1.6% for AGIs $25k-50k)
Percentage of individuals using paid preparers for their 2012 taxes: 69.2%
Here:
69%
State:
57%
(% for various income ranges: 65.3% for AGIs below $25k, 69.8% for AGIs $25k-50k, 73.3% for AGIs $50k-75k, 71.4% for AGIs $75k-100k, 80.0% for AGIs $100k-200k)
Averages for the 2004 tax year for zip code 48416, filed in 2005:
Average Adjusted Gross Income (AGI) in 2004: $36,250 (Individual Income Tax Returns)
Here:
$36,250
State:
$48,204
Salary/wage: $34,716 (reported on 84.5% of returns)
Here:
$34,716
State:
$42,791
(% of AGI for various income ranges: 94.6% for AGIs below $10k, 67.5% for AGIs $10k-25k, 80.2% for AGIs $25k-50k, 84.5% for AGIs $50k-75k, 86.3% for AGIs $75k-100k, 77.2% for AGIs over 100k)
Taxable interest for individuals: $1,192 (reported on 43.6% of returns)
This zip code:
$1,192
Michigan:
$1,725
(% of AGI for various income ranges: 8.4% for AGIs below $10k, 3.7% for AGIs $10k-25k, 1.4% for AGIs $25k-50k, 0.8% for AGIs $50k-75k, 1.1% for AGIs $75k-100k, 0.3% for AGIs over 100k)
Taxable dividends: $1,849 (reported on 17.7% of returns)
Here:
$1,849
State:
$3,420
(% of AGI for various income ranges: 4.8% for AGIs below $10k, 1.8% for AGIs $10k-25k, 0.8% for AGIs $25k-50k, 1.1% for AGIs $50k-75k, 0.4% for AGIs $75k-100k, 0.3% for AGIs over 100k)
Net capital gain/loss: +$5,600 (reported on 14.5% of returns)
Here:
+$5,600
State:
+$8,532
(% of AGI for various income ranges: -0.3% for AGIs below $10k, 1.4% for AGIs $10k-25k, 2.2% for AGIs $25k-50k, 1.1% for AGIs $50k-75k, 2.4% for AGIs $75k-100k, 5.0% for AGIs over 100k)
Profit/loss from business: +$3,952 (reported on 14.8% of returns)
Here:
+$3,952
State:
+$9,547
(% of AGI for various income ranges: -8.8% for AGIs below $10k, 5.7% for AGIs $10k-25k, 2.0% for AGIs $25k-50k, 1.6% for AGIs $50k-75k, 1.3% for AGIs $75k-100k, -0.0% for AGIs over 100k)
IRA payment deduction: $3,123 (reported on 3.3% of returns)
48416:
$3,123
Michigan:
$2,875
(% of AGI for various income ranges: 0.5% for AGIs $10k-25k, 0.4% for AGIs $25k-50k, 0.3% for AGIs $50k-75k, 0.2% for AGIs $75k-100k)
Total itemized deductions: $14,767 (24% of AGI, reported on 28.7% of returns)
Here:
$14,767
State:
$18,509
Here:
23.8% of AGI
State:
20.7% of AGI
(% of AGI for various income ranges: 7.3% for AGIs below $10k, 9.0% for AGIs $10k-25k, 10.3% for AGIs $25k-50k, 13.1% for AGIs $50k-75k, 14.3% for AGIs $75k-100k, 11.1% for AGIs over 100k)
Charity contributions deductions: $2,309 (4% of AGI, reported on 24.2% of returns)
Here:
$2,309
State:
$3,365
Here:
3.6% of AGI
State:
3.6% of AGI
(% of AGI for various income ranges: 1.3% for AGIs $10k-25k, 1.2% for AGIs $25k-50k, 1.4% for AGIs $50k-75k, 2.1% for AGIs $75k-100k, 2.0% for AGIs over 100k)
Total tax: $4,383 (reported on 70.6% of returns)
48416:
$4,383
State:
$7,691
(% of AGI for various income ranges: 3.8% for AGIs below $10k, 4.4% for AGIs $10k-25k, 5.9% for AGIs $25k-50k, 7.7% for AGIs $50k-75k, 9.9% for AGIs $75k-100k, 15.7% for AGIs over 100k)
Earned income credit: $1,812 (reported on 15.0% of returns)
Here:
$1,812
State:
$1,737
Percentage of individuals using paid preparers for their 2004 taxes: 72.0%
Here:
72%
State:
60%
(% for various income ranges: 64.9% for AGIs below $10k, 72.1% for AGIs $10k-25k, 75.2% for AGIs $25k-50k, 72.8% for AGIs $50k-75k, 75.0% for AGIs $75k-100k, 83.3% for AGIs over 100k)
Likely homosexual households (counted as self-reported same-sex unmarried-partner households)
Lesbian couples: 0.2% of all households
Gay men: 0.0% of all households
Household received Food Stamps/SNAP in the past 12 months: 287 Household did not receive Food Stamps/SNAP in the past 12 months: 1,679
Women who had a birth in the past 12 months: 66 (41 now married, 25 unmarried) Women who did not have a birth in the past 12 months: 1,020 (457 now married, 561 unmarried)
Housing units in zip code 48416 with a mortgage: 906 (68 second mortgage, 8 home equity loan, 50 both second mortgage and home equity loan) Houses without a mortgage: 3
Median monthly owner costs for units with a mortgage: $1,325 Median monthly owner costs for units without a mortgage: $483
Residents with income below the poverty level in 2022:
This zip code:
13.5%
Whole state:
13.4%
Residents with income below 50% of the poverty level in 2022:
This zip code:
6.9%
Whole state:
6.9%
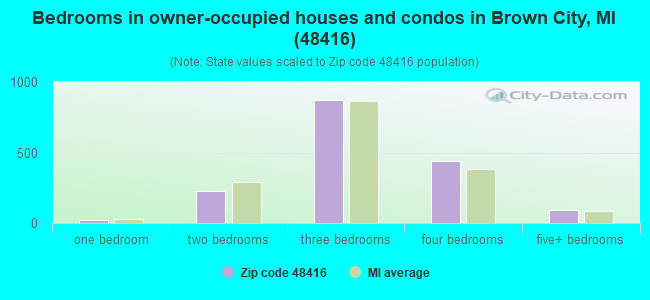
Median number of rooms in houses and condos:
Here:
6.5
State:
6.5
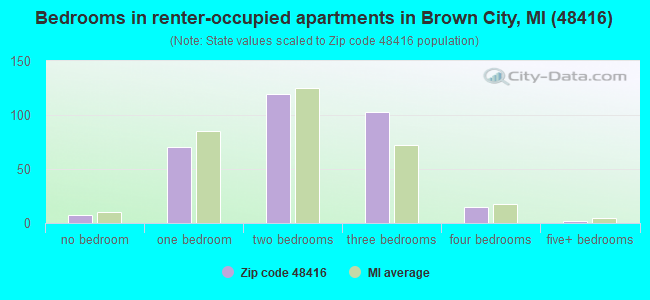
Median number of rooms in apartments:
Here:
4.8
State:
4.3
Notable locations in this zip code not listed on our city pages
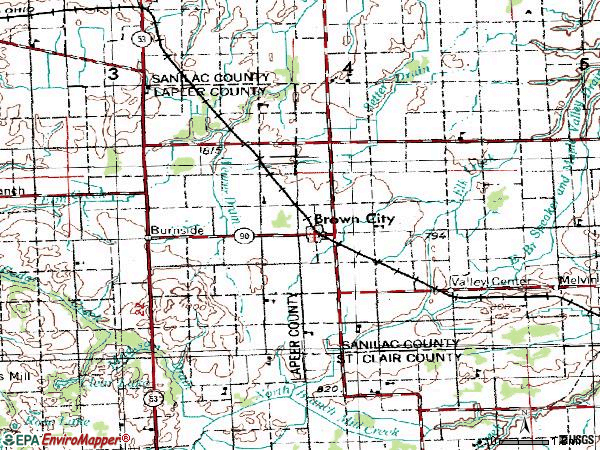
Notable locations in zip code 48416: Murray Farms (A), Muxlow Dairy Farm (B), R D R Dairy Farms (C), Brown City Station (D), Brown City Hall (E), Brown City Fire Department (F), Brown City Public Library (G). Display/hide their locations on the map
Churches in zip code 48416 include: Fellowship Bible Church (A), Immanuel Revival Church (B), Brown City United Methodist Church (C), Missionary Church (D), Faith Baptist Church (E), Trinity Lutheran Church (F), Sacred Heart Catholic Church (G), Mennonite Church (H), Elk Church (I). Display/hide their locations on the map
Cemeteries: Deanville Cemetery (1), Evergreen Cemetery (2), Fox Cemetery (3), Omard Cemetery (4), Saint Marys Cemetery (5), South Burnside Cemetery (6). Display/hide their locations on the map
Parks in zip code 48416 include: Brown City Community Schools Historical Marker (1), Brown City Banner Historical Marker (2). Display/hide their locations on the map
In group quarters: 13 (-1 institutionalized population)
Size of family households: 603 2-persons, 354 3-persons, 226 4-persons, 97 5-persons, 67 6-persons, 73 7-or-more-persons
Size of nonfamily households: 470 1-person, 60 2-persons, 5 4-persons
830 married couples with children.
286 single-parent households (89 men, 197 women).
89.6% of residents of 48416 zip code speak English at home.
1.0% of residents speak Spanish at home (40% very well, 60% well).
8.0% of residents speak other Indo-European language at home (42% very well, 48% well, 10% not well).
0.9% of residents speak Asian or Pacific Island language at home (100% very well).
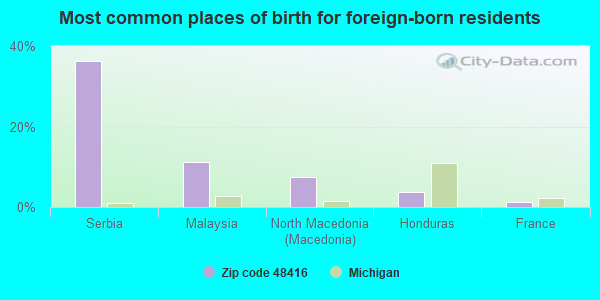
Foreign born population: 81 (1.5%) (89.3% of them are naturalized citizens)
This zip code:
1.5%
Whole state:
6.9%
36%Serbia
11%Malaysia
8%North Macedonia (Macedonia)
4%Honduras
1%France
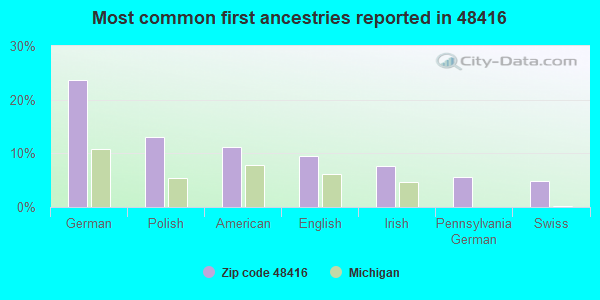
24%German
13%Polish
11%American
9%English
8%Irish
6%Pennsylvania German
5%Swiss
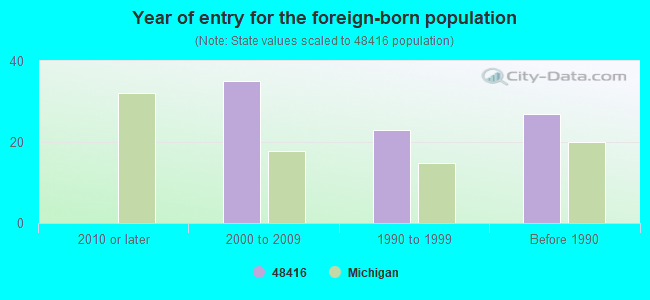
Year of entry for the foreign-born population
02010 or later
352000 to 2009
231990 to 1999
27Before 1990
Facilities with environmental interests located in this zip code:
A G DAVIS (6894 MAPLE VALLEY RD in BROWN CITY, MI)
Conditionally Exempt Small Quantity Generators, less than 100 kg/month of hazardous waste (Resource Conservation and Recovery Act (tracking hazardous waste)) Business NAICS classification: HAND AND EDGE TOOL MANUFACTURING.; SPECIAL DIE AND TOOL, DIE SET, JIG, AND FIXTURE MANUFACTURING.; CUTTING TOOL AND MACHINE TOOL ACCESSORY MANUFACTURING.; ALL OTHER MISCELLANEOUS GENERAL PURPOSE MACHINERY MANUFACTURING. Organizations: EDWIN CHAPMAN (CONTACT/OPERATOR)
, A G DAVIS GAGE & ENGINEERING (CONTACT/OPERATOR)
AQUA SYSTEMS INC (7070 ENTERPRISE DR in BROWN CITY, MI)
Conditionally Exempt Small Quantity Generators, less than 100 kg/month of hazardous waste (Resource Conservation and Recovery Act (tracking hazardous waste)) Business NAICS classification: GLASS PRODUCT MANUFACTURING MADE OF PURCHASED GLASS. Organizations: ERNEST M CHERRY JR (CONTACT/OPERATOR)
, C P ENTERPRISES (CONTACT/OWNER)
GREAT REFLECTIONS (6968 ST MARYS PO BOX 127 in BROWN CITY, MI)
Conditionally Exempt Small Quantity Generators, less than 100 kg/month of hazardous waste (Resource Conservation and Recovery Act (tracking hazardous waste)) - notification Organizations: SWOISH RICK (CONTACT/OWNER)
Housing units lacking complete plumbing facilities: 3.8% Housing units lacking complete kitchen facilities: 4.2%
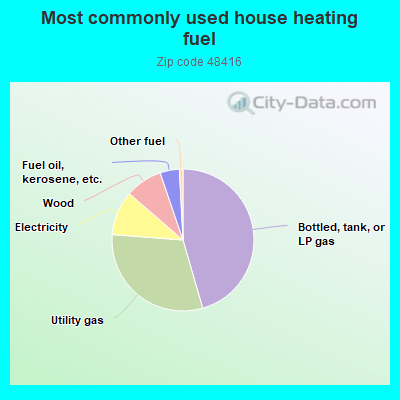
45.4%Bottled, tank, or LP gas
30.6%Utility gas
10.1%Electricity
8.4%Wood
4.4%Fuel oil, kerosene, etc.
0.8%Other fuel
Population in 1990: 4,646. Population change in the 1990s: +663 (+14.3%).
Place of birth for U.S.-born residents:
This state: 4,747
Northeast: 26
Midwest: 166
South: 187
West: 43
62% of the 48416 zip code residents lived in the same house 5 years ago. Out of people who lived in different houses, 39% lived in this county. Out of people who lived in different counties, 50% lived in Michigan.
94% of the 48416 zip code residents lived in the same house 1 year ago. Out of people who lived in different houses, 67% moved from this county. Out of people who lived in different houses, 32% moved from different county within same state.
Private vs. public school enrollment:
Students in private schools in grades 1 to 8 (elementary and middle school): 176
Here:
31.3%
Michigan:
12.4%
Students in private schools in grades 9 to 12 (high school): 49
Here:
20.0%
Michigan:
9.8%
Students in private undergraduate colleges: 48
Here:
33.3%
Michigan:
14.9%
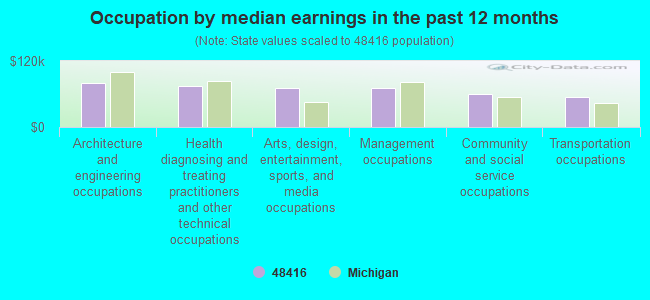
Occupation by median earnings in the past 12 months ($)
79,373Architecture and engineering occupations
74,359Health diagnosing and treating practitioners and other technical occupations
71,659Arts, design, entertainment, sports, and media occupations
70,833Management occupations
60,424Community and social service occupations
55,251Transportation occupations
Companies with federal contracts located in this zip code:
QUALITY INSPECTION SERVICE (8796 STILES RD in BROWN CITY, MI; small business) : $381,451 in 54 contractsfrom 2004 to 2006
Contracts for Miscellaneous Battery Retaining Fixtures and Liners, Hardware, Weapon System, Miscellaneous Vehicular Components, Vehicular Furniture and Accessories, and moreby Defense Logistics Agency Signed by year:2000: $0; 2001: $0; 2002: $0; 2003: $0; 2004: $22,341; 2005: $279,916; 2006: $79,194.
Biggest contracts:
$46,544 with Defense Logistics Agency for Miscellaneous Battery Retaining Fixtures and Liners. Signed on 2005-09-30. Completion date: 2006-01-28.
$42,959 with Defense Logistics Agency for Hardware, Weapon System. Signed on 2005-07-27. Completion date: 2005-10-25.
$27,657, same as above.Signed on 2006-02-25. Completion date: 2006-05-25.
$15,860, same as above.Signed on 2005-11-28. Completion date: 2006-02-26.
Top industries in this zip code by the number of employees in 2005:
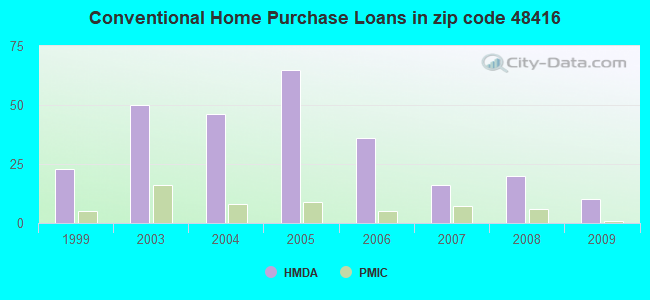
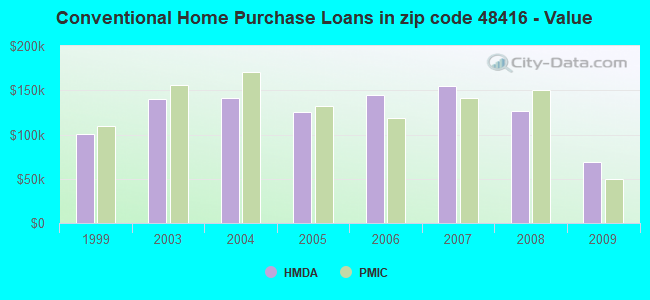
Detailed PMIC statistics for the following Tracts:3300.00
2002 - 2018 National Fire Incident Reporting System (NFIRS) incidents
According to the data from the years 2002 - 2018 the average number of fires per year is 22. The highest number of fires - 37 took place in 2017, and the least - 1 in 2014. The data has a growing trend.
When looking into fire subcategories, the most reports belonged to: Structure Fires (54.7%), and Outside Fires (30.2%).
Fire incident types reported to NFIRS in Zip Code 48416

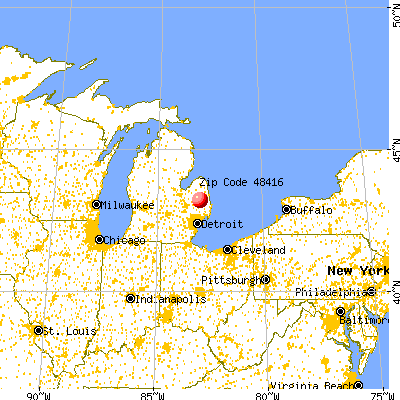


 Nearest zip codes: 48453, 48444, 48454, 48097, 48466, 48014.
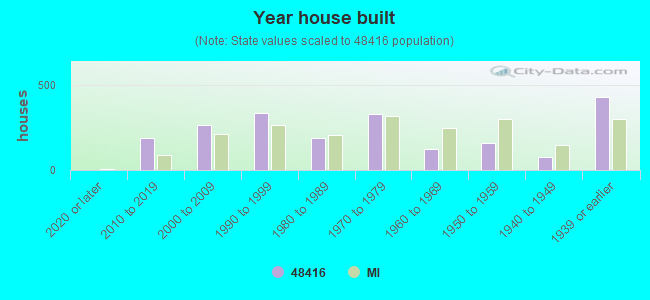


 According to the data from the years 2002 - 2018 the average number of fires per year is 22. The highest number of fires - 37 took place in 2017, and the least - 1 in 2014. The data has a growing trend.
 When looking into fire subcategories, the most reports belonged to: Structure Fires (54.7%), and Outside Fires (30.2%).