Estimated zip code population in 2022: 15,062 Zip code population in 2010: 13,993 Zip code population in 2000: 12,444
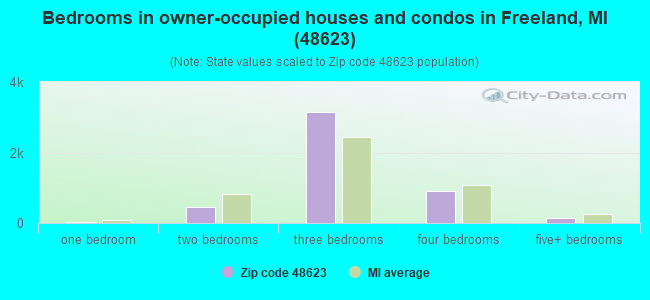
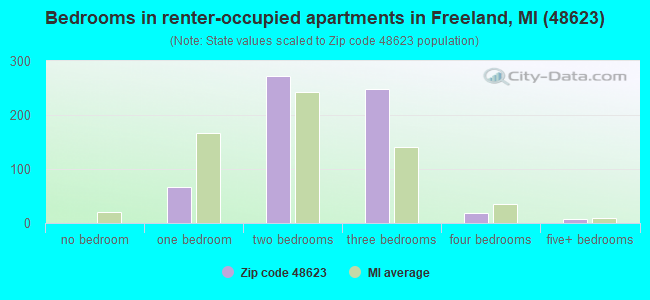
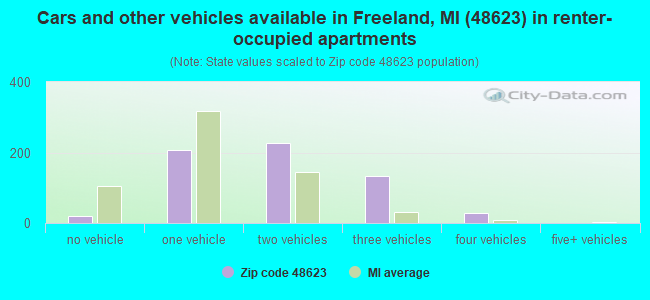
Houses and condos: 5,456 Renter-occupied apartments: 619
% of renters here:
12%
State:
27%
March 2022 cost of living index in zip code 48623: 83.1 (low, U.S. average is 100)
Land area: 73.6 sq. mi. Water area: 1.0 sq. mi.
Population density: 205 people per square mile
(very low).
OSM Map
General Map
Google Map
MSN Map
OSM Map
General Map
Google Map
MSN Map
OSM Map
General Map
Google Map
MSN Map
OSM Map
General Map
Google Map
MSN Map
Please wait while loading the map...
Real estate property taxes paid for housing units in 2022:
This zip code:
1.2% ($2,966)
Michigan:
1.2% ($2,746)
Median real estate property taxes paid for housing units with mortgages in 2022: $3,002 (1.2%) Median real estate property taxes paid for housing units with no mortgage in 2022: $2,933 (1.4%)
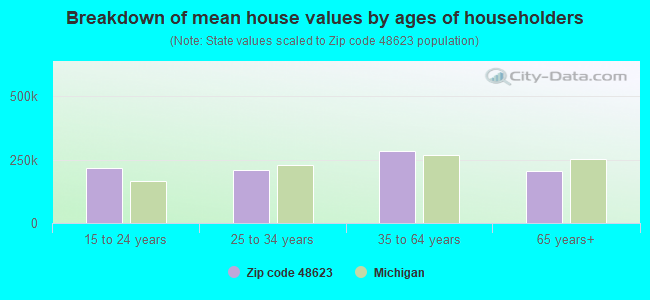
Estimated median house/condo value in 2022: $241,807
48623:
$241,807
Michigan:
$224,400
According to our research of Michigan and other state lists, there were 17 registered sex offenders living in 48623 zip code as of April 27, 2024. The ratio of all residents to sex offenders in zip code 48623 is 839 to 1. The ratio of registered sex offenders to all residents in this zip code is much lower than the state average.
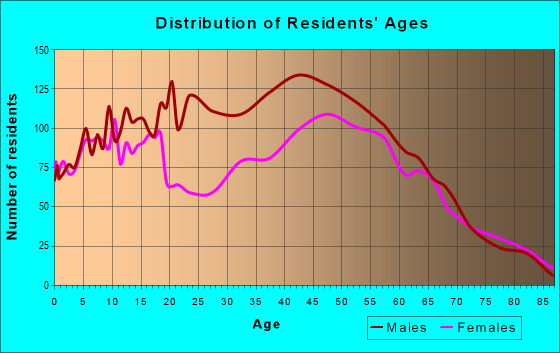
Median resident age:
This zip code:
41.9 years
Michigan median age:
40.3 years
Average household size:
This zip code:
2.5 people
Michigan:
2.4 people
Averages for the 2020 tax year for zip code 48623, filed in 2021:
Average Adjusted Gross Income (AGI) in 2020: $79,471 (Individual Income Tax Returns)
Here:
$79,471
State:
$68,945
Salary/wage: $70,155 (reported on 77.3% of returns)
Here:
$70,155
State:
$57,142
(% of AGI for various income ranges: 978.0% for AGIs below $25k, 2957.1% for AGIs $25k-50k, 5801.5% for AGIs $50k-75k, 8304.9% for AGIs $75k-100k, 16594.1% for AGIs $100k-200k, 58956.9% for AGIs over 200k)
Taxable interest for individuals: $1,115 (reported on 46.0% of returns)
This zip code:
$1,115
Michigan:
$1,630
(% of AGI for various income ranges: 23.8% for AGIs below $25k, 34.0% for AGIs $25k-50k, 55.3% for AGIs $50k-75k, 70.0% for AGIs $75k-100k, 107.0% for AGIs $100k-200k, 721.9% for AGIs over 200k)
Ordinary dividends: $4,193 (reported on 23.3% of returns)
Here:
$4,193
State:
$6,972
(% of AGI for various income ranges: 41.8% for AGIs below $25k, 45.0% for AGIs $25k-50k, 82.8% for AGIs $50k-75k, 99.1% for AGIs $75k-100k, 198.7% for AGIs $100k-200k, 1773.8% for AGIs over 200k)
Net capital gain/loss in AGI: +$11,781 (reported on 20.3% of returns)
Here:
+$11,781
State:
+$20,064
(% of AGI for various income ranges: 12.7% for AGIs below $25k, 38.7% for AGIs $25k-50k, 76.9% for AGIs $50k-75k, 157.5% for AGIs $75k-100k, 323.5% for AGIs $100k-200k, 7289.4% for AGIs over 200k)
Profit/loss from business: +$15,417 (reported on 13.2% of returns)
Here:
+$15,417
State:
+$11,172
(% of AGI for various income ranges: 36.4% for AGIs below $25k, 129.1% for AGIs $25k-50k, 106.2% for AGIs $50k-75k, 185.1% for AGIs $75k-100k, 396.7% for AGIs $100k-200k, 4365.6% for AGIs over 200k)
Taxable individual retirement arrangement distribution: $18,010 (reported on 11.9% of returns)
48623:
$18,010
Michigan:
$19,803
(% of AGI for various income ranges: 70.4% for AGIs below $25k, 173.6% for AGIs $25k-50k, 225.1% for AGIs $50k-75k, 440.4% for AGIs $75k-100k, 578.0% for AGIs $100k-200k, 1837.5% for AGIs over 200k)
Self-employed (Keogh) retirement plans: $30,933 (reported on 0.4% of returns)
48623:
$30,933
Michigan:
$25,132
(% of AGI for various income ranges: 100.9% for AGIs $100k-200k)
Total itemized deductions: $34,676 (reported on 5.5% of returns)
Here:
$34,676
State:
$34,117
(% of AGI for various income ranges: 60.6% for AGIs below $25k, 74.7% for AGIs $25k-50k, 80.3% for AGIs $50k-75k, 234.0% for AGIs $75k-100k, 439.9% for AGIs $100k-200k, 3588.8% for AGIs over 200k)
Charity contributions: $12,511 (reported on 4.0% of returns)
Here:
$12,511
State:
$13,548
(% of AGI for various income ranges: 11.1% for AGIs below $25k, 15.1% for AGIs $50k-75k, 48.2% for AGIs $75k-100k, 97.6% for AGIs $100k-200k, 1306.2% for AGIs over 200k)
Taxes paid: $7,619 (reported on 5.3% of returns)
48623:
$7,619
State:
$7,972
(% of AGI for various income ranges: 7.0% for AGIs below $25k, 10.7% for AGIs $25k-50k, 22.5% for AGIs $50k-75k, 54.4% for AGIs $75k-100k, 111.7% for AGIs $100k-200k, 708.1% for AGIs over 200k)
Earned income credit: $1,969 (reported on 7.3% of returns)
Here:
$1,969
State:
$2,251
(% of AGI for various income ranges: 41.8% for AGIs below $25k, 46.8% for AGIs $25k-50k)
Percentage of individuals using paid preparers for their 2020 taxes: 93.1%
Here:
93%
State:
93%
(% for various income ranges: 87.6% for AGIs below $25k, 95.4% for AGIs $25k-50k, 94.8% for AGIs $50k-75k, 94.7% for AGIs $75k-100k, 96.5% for AGIs $100k-200k, 94.9% for AGIs over 200k)
Averages for the 2012 tax year for zip code 48623, filed in 2013:
Average Adjusted Gross Income (AGI) in 2012: $65,794 (Individual Income Tax Returns)
Here:
$65,794
State:
$55,609
Salary/wage: $55,921 (reported on 84.0% of returns)
Here:
$55,921
State:
$46,782
(% of AGI for various income ranges: 67.3% for AGIs below $25k, 67.7% for AGIs $25k-50k, 71.8% for AGIs $50k-75k, 77.5% for AGIs $75k-100k, 79.7% for AGIs $100k-200k, 57.0% for AGIs over 200k)
Taxable interest for individuals: $1,259 (reported on 51.6% of returns)
This zip code:
$1,259
Michigan:
$1,491
(% of AGI for various income ranges: 1.5% for AGIs below $25k, 0.9% for AGIs $25k-50k, 0.8% for AGIs $50k-75k, 0.5% for AGIs $75k-100k, 0.6% for AGIs $100k-200k, 1.9% for AGIs over 200k)
Ordinary dividends: $4,513 (reported on 25.4% of returns)
Here:
$4,513
State:
$6,225
(% of AGI for various income ranges: 1.5% for AGIs below $25k, 1.0% for AGIs $25k-50k, 1.0% for AGIs $50k-75k, 0.7% for AGIs $75k-100k, 0.9% for AGIs $100k-200k, 4.7% for AGIs over 200k)
Net capital gain/loss in AGI: +$4,312 (reported on 19.3% of returns)
Here:
+$4,312
State:
+$9,326
(% of AGI for various income ranges: 0.7% for AGIs $25k-50k, 0.4% for AGIs $50k-75k, 0.4% for AGIs $75k-100k, 0.6% for AGIs $100k-200k, 4.3% for AGIs over 200k)
Profit/loss from business: +$13,956 (reported on 12.9% of returns)
Here:
+$13,956
State:
+$11,523
(% of AGI for various income ranges: 3.8% for AGIs below $25k, 1.9% for AGIs $25k-50k, 1.6% for AGIs $50k-75k, 2.5% for AGIs $75k-100k, 2.1% for AGIs $100k-200k, 4.9% for AGIs over 200k)
Taxable individual retirement arrangement distribution: $13,481 (reported on 11.5% of returns)
48623:
$13,481
Michigan:
$15,298
(% of AGI for various income ranges: 3.3% for AGIs below $25k, 2.9% for AGIs $25k-50k, 2.7% for AGIs $50k-75k, 2.4% for AGIs $75k-100k, 2.5% for AGIs $100k-200k, 1.4% for AGIs over 200k)
Self-employment retirement plans: $23,400 (reported on 0.5% of returns)
48623:
$23,400
Michigan:
$20,834
(% of AGI for various income ranges: 0.6% for AGIs $100k-200k)
Total itemized deductions: $20,794 (18% of AGI, reported on 36.2% of returns)
Here:
$20,794
State:
$21,628
Here:
17.7% of AGI
State:
18.4% of AGI
(% of AGI for various income ranges: 8.6% for AGIs below $25k, 9.8% for AGIs $25k-50k, 10.3% for AGIs $50k-75k, 11.1% for AGIs $75k-100k, 12.8% for AGIs $100k-200k, 12.1% for AGIs over 200k)
Charity contributions: $3,406 (reported on 30.4% of returns)
Here:
$3,406
State:
$4,225
(% of AGI for various income ranges: 0.7% for AGIs below $25k, 1.1% for AGIs $25k-50k, 1.2% for AGIs $50k-75k, 1.4% for AGIs $75k-100k, 1.8% for AGIs $100k-200k, 2.1% for AGIs over 200k)
Taxes paid: $8,209 (reported on 36.2% of returns)
48623:
$8,209
State:
$8,327
(% of AGI for various income ranges: 1.5% for AGIs below $25k, 2.3% for AGIs $25k-50k, 3.4% for AGIs $50k-75k, 4.0% for AGIs $75k-100k, 5.6% for AGIs $100k-200k, 6.1% for AGIs over 200k)
Earned income credit: $2,005 (reported on 9.8% of returns)
Here:
$2,005
State:
$2,306
(% of AGI for various income ranges: 3.8% for AGIs below $25k, 0.8% for AGIs $25k-50k)
Percentage of individuals using paid preparers for their 2012 taxes: 59.6%
Here:
60%
State:
57%
(% for various income ranges: 51.9% for AGIs below $25k, 62.1% for AGIs $25k-50k, 64.0% for AGIs $50k-75k, 61.3% for AGIs $75k-100k, 62.8% for AGIs $100k-200k, 80.0% for AGIs over 200k)
Averages for the 2004 tax year for zip code 48623, filed in 2005:
Average Adjusted Gross Income (AGI) in 2004: $53,900 (Individual Income Tax Returns)
Here:
$53,900
State:
$48,204
Salary/wage: $48,726 (reported on 86.3% of returns)
Here:
$48,726
State:
$42,791
(% of AGI for various income ranges: 122.8% for AGIs below $10k, 64.0% for AGIs $10k-25k, 72.3% for AGIs $25k-50k, 81.1% for AGIs $50k-75k, 86.9% for AGIs $75k-100k, 74.5% for AGIs over 100k)
Taxable interest for individuals: $1,146 (reported on 63.8% of returns)
This zip code:
$1,146
Michigan:
$1,725
(% of AGI for various income ranges: 8.8% for AGIs below $10k, 3.4% for AGIs $10k-25k, 1.4% for AGIs $25k-50k, 1.0% for AGIs $50k-75k, 0.7% for AGIs $75k-100k, 1.3% for AGIs over 100k)
Taxable dividends: $2,216 (reported on 31.2% of returns)
Here:
$2,216
State:
$3,420
(% of AGI for various income ranges: 3.5% for AGIs below $10k, 1.7% for AGIs $10k-25k, 1.1% for AGIs $25k-50k, 0.8% for AGIs $50k-75k, 0.7% for AGIs $75k-100k, 1.8% for AGIs over 100k)
Net capital gain/loss: +$3,536 (reported on 22.7% of returns)
Here:
+$3,536
State:
+$8,532
(% of AGI for various income ranges: -1.7% for AGIs below $10k, 0.4% for AGIs $10k-25k, 0.1% for AGIs $25k-50k, 0.7% for AGIs $50k-75k, 0.6% for AGIs $75k-100k, 3.1% for AGIs over 100k)
Profit/loss from business: +$10,806 (reported on 15.1% of returns)
Here:
+$10,806
State:
+$9,547
(% of AGI for various income ranges: 7.6% for AGIs below $10k, 4.6% for AGIs $10k-25k, 2.5% for AGIs $25k-50k, 2.0% for AGIs $50k-75k, 1.6% for AGIs $75k-100k, 4.2% for AGIs over 100k)
IRA payment deduction: $3,069 (reported on 2.3% of returns)
48623:
$3,069
Michigan:
$2,875
(% of AGI for various income ranges: 0.2% for AGIs $10k-25k, 0.3% for AGIs $25k-50k, 0.1% for AGIs $50k-75k, 0.1% for AGIs $75k-100k, 0.1% for AGIs over 100k)
Self-employed pension: $19,400 (reported on 0.5% of returns)
Here:
$19,400
Michigan:
$13,826
Total itemized deductions: $17,233 (19% of AGI, reported on 43.1% of returns)
Here:
$17,233
State:
$18,509
Here:
19.2% of AGI
State:
20.7% of AGI
(% of AGI for various income ranges: 16.1% for AGIs below $10k, 10.7% for AGIs $10k-25k, 13.2% for AGIs $25k-50k, 13.9% for AGIs $50k-75k, 15.1% for AGIs $75k-100k, 13.6% for AGIs over 100k)
Charity contributions deductions: $2,668 (3% of AGI, reported on 39.7% of returns)
Here:
$2,668
State:
$3,365
Here:
2.9% of AGI
State:
3.6% of AGI
(% of AGI for various income ranges: 1.0% for AGIs below $10k, 1.4% for AGIs $10k-25k, 1.6% for AGIs $25k-50k, 1.8% for AGIs $50k-75k, 2.0% for AGIs $75k-100k, 2.2% for AGIs over 100k)
Total tax: $7,953 (reported on 80.0% of returns)
48623:
$7,953
State:
$7,691
(% of AGI for various income ranges: 4.3% for AGIs below $10k, 4.2% for AGIs $10k-25k, 6.4% for AGIs $25k-50k, 8.5% for AGIs $50k-75k, 9.9% for AGIs $75k-100k, 17.6% for AGIs over 100k)
Earned income credit: $1,519 (reported on 9.1% of returns)
Here:
$1,519
State:
$1,737
Percentage of individuals using paid preparers for their 2004 taxes: 61.4%
Here:
61%
State:
60%
(% for various income ranges: 53.4% for AGIs below $10k, 60.2% for AGIs $10k-25k, 66.2% for AGIs $25k-50k, 63.9% for AGIs $50k-75k, 59.1% for AGIs $75k-100k, 67.2% for AGIs over 100k)
Household received Food Stamps/SNAP in the past 12 months: 523 Household did not receive Food Stamps/SNAP in the past 12 months: 4,739
Women who had a birth in the past 12 months: 81 (83 now married, 0 unmarried) Women who did not have a birth in the past 12 months: 2,765 (1,500 now married, 1,256 unmarried)
Housing units in zip code 48623 with a mortgage: 2,837 (293 second mortgage, 306 both second mortgage and home equity loan) Houses without a mortgage: 64
Median monthly owner costs for units with a mortgage: $1,564 Median monthly owner costs for units without a mortgage: $589
Residents with income below the poverty level in 2022:
This zip code:
5.1%
Whole state:
13.4%
Residents with income below 50% of the poverty level in 2022:
This zip code:
2.8%
Whole state:
6.9%
Median number of rooms in houses and condos:
Here:
6.6
State:
6.5
Median number of rooms in apartments:
Here:
4.7
State:
4.3
Notable locations in this zip code not listed on our city pages
Notable locations in zip code 48623: Twin Oaks Golf Course (A), Apple Mountain Ski Area (B), Apple Mountain Golf Course (C), Bayou Golf Course (D), Beech Hollow Golf Course (E), Freeland Station (F), Thomas Township Fire Department Station 2 (G), Midland Bay Saginaw International Airport Fire Department (H), Freeland Township Hall (I), Tittabawassee Township Fire Department (J), Tittabawassee Township Police Department (K), Saginaw Correctional Facility (L). Display/hide their locations on the map
Churches in zip code 48623 include: La Porte United Methodist Church (A), Saint Matthews Church (B), Dice Wesleyan Church (C), Saint Dominic Savio Church (D), Radiant Life Church (E), New Heart Church of the Nazarene (F), Saint Agnes Catholic Church (G), Freeland Assembly of God Church (H), Freeland United Methodist Church (I). Display/hide their locations on the map
Cemeteries: German Lutheran Church Cemetery (1), Jacquith Cemetery (2), Chapel Hill Cemetery (3), Laporte Cemetery (4), Vasold Cemetery (5), Pine Grove Cemetery (6), West Side Cemetery (7). Display/hide their locations on the map
Streams, rivers, and creeks: West Branch Squaconning Creek (A), Hatch Run (B), Jo Drain (C), Branch Number Three Squaconning Creek (D), Fleming Drain (E), South Branch Kochville and Frankenlust Drain (F), Labozinski Drain (G), Armon Drain (H), Shaffner and Major Drain (I). Display/hide their locations on the map
Parks in zip code 48623 include: Little League Field (1), Memorial Park (2), Village Park (3), Tittabawassee Township Park (4), Festival Park (5), Beechwood Nature Trails (6), Freeland United Methodist Church Historical Marker (7). Display/hide their locations on the map
In group quarters: 1,610 (-1 institutionalized population)
Size of family households: 1,655 2-persons, 903 3-persons, 604 4-persons, 521 5-persons, 38 6-persons, 75 7-or-more-persons
Size of nonfamily households: 1,033 1-person, 355 2-persons, 64 3-persons
2,536 married couples with children.
492 single-parent households (186 men, 306 women).
95.8% of residents of 48623 zip code speak English at home.
1.8% of residents speak Spanish at home (92% very well, 5% well, 3% not well).
0.7% of residents speak other Indo-European language at home (92% very well, 8% well).
0.7% of residents speak Asian or Pacific Island language at home (100% very well).
0.5% of residents speak other language at home (100% very well).
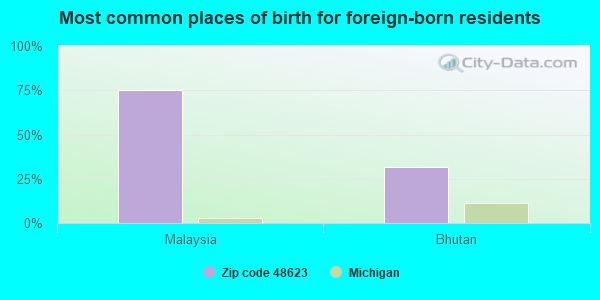
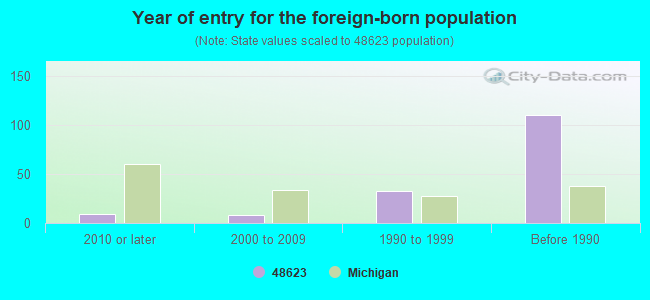
Foreign born population: 110 (0.7%) (100.0% of them are naturalized citizens)
This zip code:
0.7%
Whole state:
6.9%
75%Malaysia
31%Bhutan
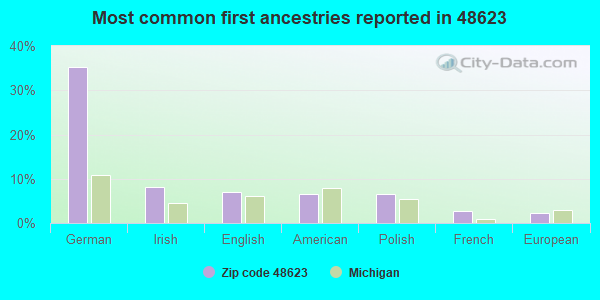
35%German
8%Irish
7%English
7%American
7%Polish
3%French
2%European
Year of entry for the foreign-born population
92010 or later
82000 to 2009
331990 to 1999
110Before 1990
Major facilities with environmental interests located in this zip code:
FREELAND ELEMENTARY SCHOOL (710 POWLEY DRIVE in FREELAND, MI)
(National Center for Education Statistics) - STATE ID-04861 Organizations: FREELAND COMMUNITY SCHOOL DISTRICT (SCHOOL DISTRICT)
FREELAND LEARNING CENTER (307 S. THIRD STREET in FREELAND, MI)
(National Center for Education Statistics) - STATE ID-01318 Organizations: FREELAND COMMUNITY SCHOOL DISTRICT (SCHOOL DISTRICT)
FREELAND MIDDLE SCHOOL/HIGH SCHOOL (8250 WEBSTER ROAD in FREELAND, MI)
(National Center for Education Statistics) - STATE ID-01319 Organizations: FREELAND COMMUNITY SCHOOL DISTRICT (SCHOOL DISTRICT)
AREA PAINTING CO (2666 W SALZBURG DR in FREELAND, MI)
(Resource Conservation and Recovery Act (tracking hazardous waste)) Conditionally Exempt Small Quantity Generators, less than 100 kg/month of hazardous waste (Resource Conservation and Recovery Act (tracking hazardous waste)) Organizations: RODNEY J PRIOR (CONTACT/OPERATOR)
AVFUEL CORP (8370 GARFIELD RD in FREELAND, MI)
AIR MINOR (AIRS/AFS) CRITERIA AND HAZARDOUS AIR POLLUTANT INVENTORY (Inventory of air pollution sources) Business SIC classification: AIRPORTS, FLYING FIELDS, AND AIRPORT TERMINAL SERVICES; PETROLEUM BULK STATIONS AND TERMINALS Alternative names: AERO SERVICES INTERNATIONAL
GARB KO INC (8976 TITTABAWASEE in FREELAND, MI)
(Resource Conservation and Recovery Act (tracking hazardous waste)) Organizations: DALE & BRIDGET BRANDIMORE (CONTACT/OPERATOR)
, GARB-KO INC (CONTACT/OWNER)
Alternative names: 7-ELEVEN STORE #151-A
DOW CHEMICAL COMPANY ROCKWELL LANDFILL (ROCKWELL DRIVE & MILNER ROAD in FREELAND, MI)
HAZARDOUS WASTE BIENNIAL REPORTER (Resource Conservation and Recovery Act (tracking hazardous waste)) Large Quantity Generators, more that 1000 kg of hazardous waste/month (Resource Conservation and Recovery Act (tracking hazardous waste)) Business NAICS classification: SOLID WASTE LANDFILL. Organizations: DOW CHEMICAL CO., THE (CONTACT/OPERATOR)
Alternative names: THE DOW CHEMICAL CO
BERGER AND CO (215 N 5TH ST in FREELAND, MI)
(Resource Conservation and Recovery Act (tracking hazardous waste)) Organizations: CONAGRA CO (CONTACT/OWNER)
BORDEN CHEMICAL SMITH-DOUGLASS DIV (4535 LAPORTE RD in FREELAND, MI)
(Resource Conservation and Recovery Act (tracking hazardous waste))
FREELAND MHP (10340 MIDLAND RD in FREELAND, MI)
National Pollutant Discharge Elimination System NON-MAJOR (Tracking pollutant discharge elimination systems) - permit Business SIC classification: OPERATORS OF RESIDENTIAL MOBILE HOME SITES
METRO FABRICATING (1100 E WASHINGTON in FREELAND, MI)
(Resource Conservation and Recovery Act (tracking hazardous waste)) Business NAICS classification: METAL STAMPING.
MI DEPT/AGRICULTURE (215 N 5TH in FREELAND, MI)
(Resource Conservation and Recovery Act (tracking hazardous waste))
MI DEPT/ENVIRONMENTAL QUALITY (160 NORTH MAIN STREET in FREELAND, MI)
(Resource Conservation and Recovery Act (tracking hazardous waste)) Alternative names: MDEQ FORMER STANLEY HILL
Housing units lacking complete plumbing facilities: 1.4% Housing units lacking complete kitchen facilities: 2.7%
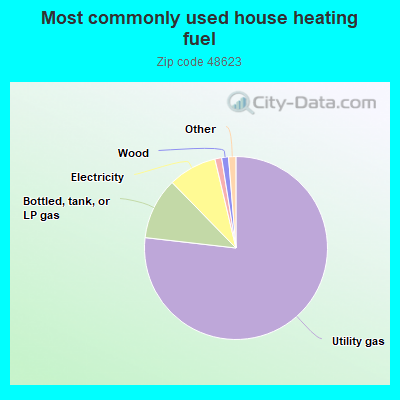
76.9%Utility gas
10.9%Bottled, tank, or LP gas
8.6%Electricity
1.2%Fuel oil, kerosene, etc.
1.2%Wood
0.8%No fuel used
0.5%Other fuel
Population in 1990: 10,892. Population change in the 1990s: +1,552 (+14.2%).
Place of birth for U.S.-born residents:
This state: 13,053
Northeast: 294
Midwest: 640
South: 434
West: 467
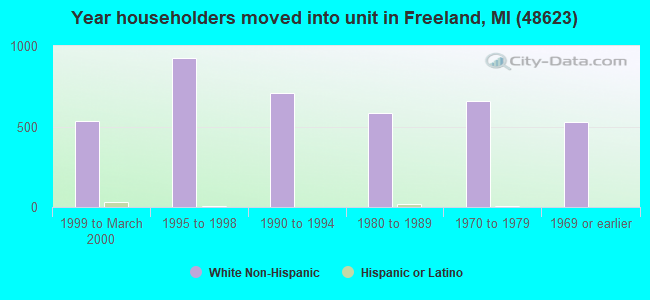
63% of the 48623 zip code residents lived in the same house 5 years ago. Out of people who lived in different houses, 46% lived in this county. Out of people who lived in different counties, 50% lived in Michigan.
93% of the 48623 zip code residents lived in the same house 1 year ago. Out of people who lived in different houses, 35% moved from this county. Out of people who lived in different houses, 60% moved from different county within same state. Out of people who lived in different houses, 3% moved from different state. Out of people who lived in different houses, 1% moved from abroad.
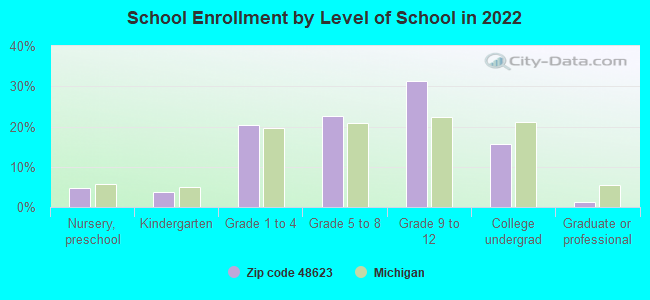
Private vs. public school enrollment:
Students in private schools in grades 1 to 8 (elementary and middle school): 283
Here:
19.6%
Michigan:
12.4%
Students in private schools in grades 9 to 12 (high school): 35
Here:
3.4%
Michigan:
9.8%
Students in private undergraduate colleges: 46
Here:
8.9%
Michigan:
14.9%
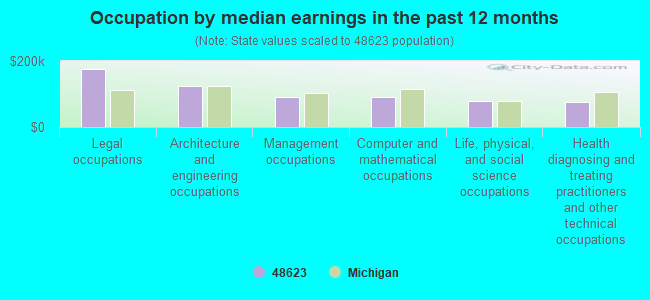
Occupation by median earnings in the past 12 months ($)
175,087Legal occupations
125,396Architecture and engineering occupations
92,295Management occupations
90,358Computer and mathematical occupations
77,395Life, physical, and social science occupations
75,410Health diagnosing and treating practitioners and other technical occupations
Companies with federal contracts located in this zip code:
FRONT LINE SERVICES, INC (8588 CARTER RD in FREELAND, MI; small business)
$7,018 with Army for Maintenance, Repair and Rebuilding of Equipment -- Fire Fighting, Rescue, and Safety Equipment; and Environmental Protection Equipment and Materials. Signed on 2006-04-05. Completion date: 2006-05-05.
Top industries in this zip code by the number of employees in 2005:
Health Care and Social Assistance: Diagnostic Imaging Centers (500-999 employees: 1 establishment)
2002 - 2018 National Fire Incident Reporting System (NFIRS) incidents
Based on the data from the years 2002 - 2018 the average number of fires per year is 25. The highest number of fires - 32 took place in 2007, and the least - 10 in 2005. The data has a growing trend.
When looking into fire subcategories, the most reports belonged to: Structure Fires (40.4%), and Outside Fires (32.5%).
Fire incident types reported to NFIRS in Zip Code 48623
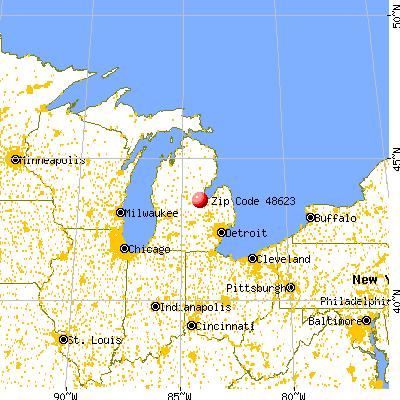


 Nearest zip codes: 48611, 48603, 48667, 48626, 48609, 48710.


 Based on the data from the years 2002 - 2018 the average number of fires per year is 25. The highest number of fires - 32 took place in 2007, and the least - 10 in 2005. The data has a growing trend.
 When looking into fire subcategories, the most reports belonged to: Structure Fires (40.4%), and Outside Fires (32.5%).