Estimated zip code population in 2022: 15,175 Zip code population in 2010: 11,192 Zip code population in 2000: 9,007
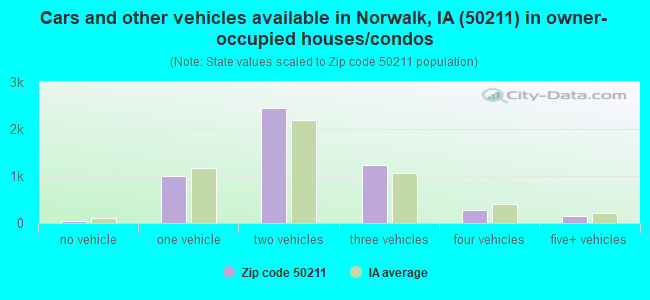
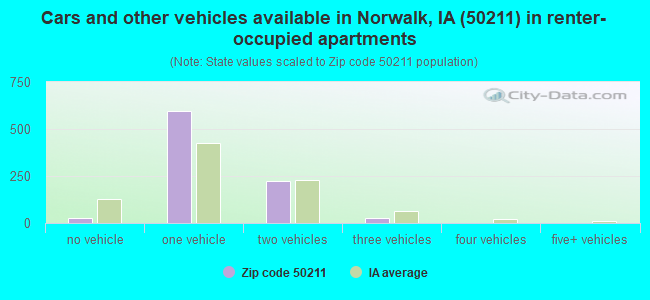
Houses and condos: 6,134 Renter-occupied apartments: 866
% of renters here:
14%
State:
28%
March 2022 cost of living index in zip code 50211: 89.6 (less than average, U.S. average is 100)
Land area: 56.2 sq. mi. Water area: 0.6 sq. mi.
Population density: 270 people per square mile
(very low).
OSM Map
General Map
Google Map
MSN Map
OSM Map
General Map
Google Map
MSN Map
OSM Map
General Map
Google Map
MSN Map
OSM Map
General Map
Google Map
MSN Map
Please wait while loading the map...
Real estate property taxes paid for housing units in 2022:
This zip code:
1.6% ($4,703)
Iowa:
1.4% ($2,724)
Median real estate property taxes paid for housing units with mortgages in 2022: $4,890 (1.5%) Median real estate property taxes paid for housing units with no mortgage in 2022: $4,270 (1.6%)
Business Search- 14 Million verified businesses
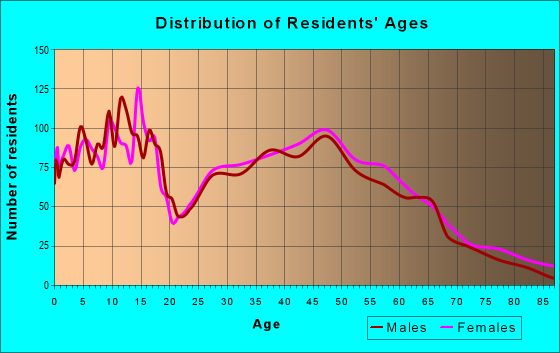
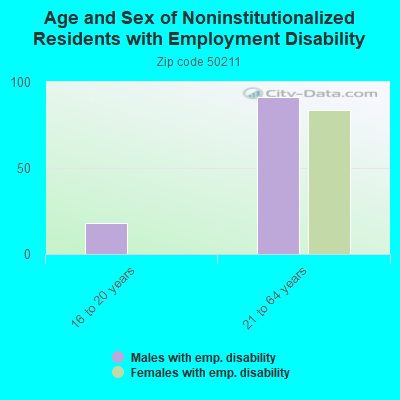
Males: 7,403
(48.8%)
Females: 7,770
(51.2%)
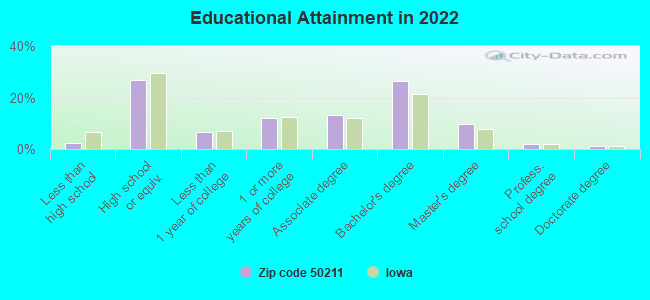
For population 25 years and over in 50211:
High school or higher: 99.0%
Bachelor's degree or higher: 39.7%
Graduate or professional degree: 12.9%
Unemployed: 2.3%
Mean travel time to work (commute): 24.2 minutes
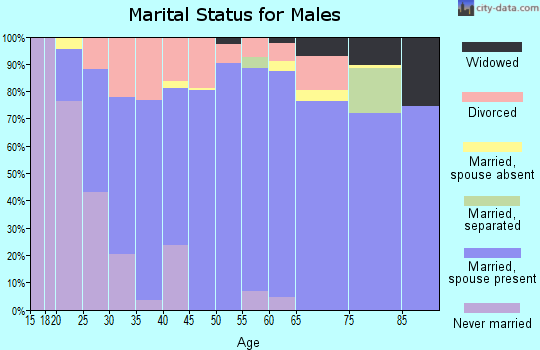
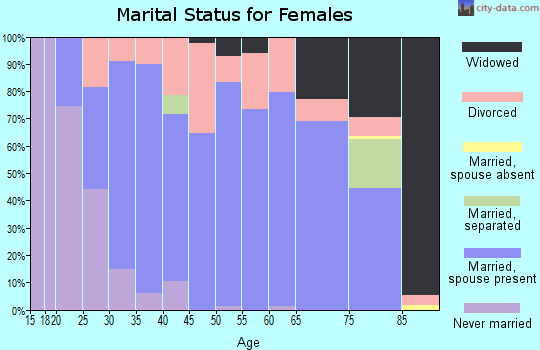
For population 15 years and over in 50211:
Never married: 24.2%
Now married: 58.2%
Separated: 1.5%
Widowed: 5.0%
Divorced: 11.1%
Zip code 50211 compared to state average:
Median house value above state average.
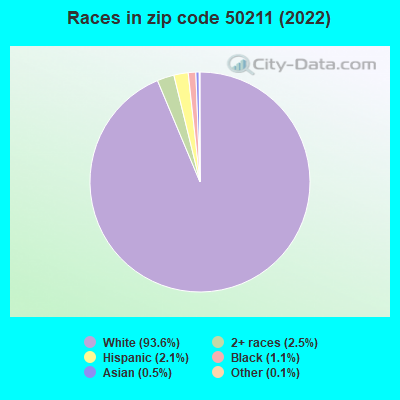
Black race population percentage significantly below state average.
Hispanic race population percentage significantly below state average.
Foreign-born population percentage significantly below state average.
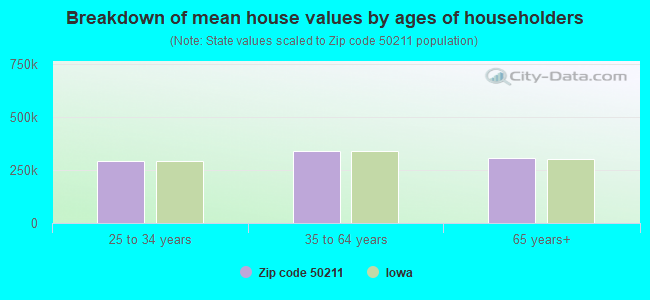
Estimated median house/condo value in 2022: $295,865
50211:
$295,865
Iowa:
$194,600
According to our research of Iowa and other state lists, there were 10 registered sex offenders living in 50211 zip code as of April 26, 2024. The ratio of all residents to sex offenders in zip code 50211 is 1,246 to 1. The ratio of registered sex offenders to all residents in this zip code is much lower than the state average.
Median resident age:
This zip code:
38.5 years
Iowa median age:
38.9 years
Average household size:
This zip code:
2.5 people
Iowa:
2.3 people
Averages for the 2020 tax year for zip code 50211, filed in 2021:
Average Adjusted Gross Income (AGI) in 2020: $91,612 (Individual Income Tax Returns)
Here:
$91,612
State:
$71,087
Salary/wage: $81,216 (reported on 87.0% of returns)
Here:
$81,216
State:
$57,361
(% of AGI for various income ranges: 1106.5% for AGIs below $25k, 3551.8% for AGIs $25k-50k, 6297.1% for AGIs $50k-75k, 9339.0% for AGIs $75k-100k, 18585.6% for AGIs $100k-200k, 66492.2% for AGIs over 200k)
Taxable interest for individuals: $1,131 (reported on 37.9% of returns)
This zip code:
$1,131
Iowa:
$1,633
(% of AGI for various income ranges: 12.8% for AGIs below $25k, 28.2% for AGIs $25k-50k, 34.1% for AGIs $50k-75k, 64.7% for AGIs $75k-100k, 85.4% for AGIs $100k-200k, 465.7% for AGIs over 200k)
Ordinary dividends: $3,782 (reported on 25.6% of returns)
Here:
$3,782
State:
$5,432
(% of AGI for various income ranges: 25.5% for AGIs below $25k, 44.6% for AGIs $25k-50k, 67.1% for AGIs $50k-75k, 116.8% for AGIs $75k-100k, 190.1% for AGIs $100k-200k, 1301.7% for AGIs over 200k)
Net capital gain/loss in AGI: +$12,552 (reported on 21.9% of returns)
Here:
+$12,552
State:
+$15,243
(% of AGI for various income ranges: 8.0% for AGIs below $25k, 42.4% for AGIs $25k-50k, 72.5% for AGIs $50k-75k, 111.7% for AGIs $75k-100k, 379.9% for AGIs $100k-200k, 6231.3% for AGIs over 200k)
Profit/loss from business: +$13,185 (reported on 13.8% of returns)
Here:
+$13,185
State:
+$11,763
(% of AGI for various income ranges: 73.2% for AGIs below $25k, 139.5% for AGIs $25k-50k, 142.6% for AGIs $50k-75k, 293.0% for AGIs $75k-100k, 432.1% for AGIs $100k-200k, 1427.4% for AGIs over 200k)
Taxable individual retirement arrangement distribution: $21,103 (reported on 10.5% of returns)
50211:
$21,103
Iowa:
$17,324
(% of AGI for various income ranges: 62.8% for AGIs below $25k, 130.3% for AGIs $25k-50k, 182.1% for AGIs $50k-75k, 407.8% for AGIs $75k-100k, 572.5% for AGIs $100k-200k, 1641.7% for AGIs over 200k)
Self-employed (Keogh) retirement plans: $17,225 (reported on 0.5% of returns)
50211:
$17,225
Iowa:
$22,144
(% of AGI for various income ranges: 62.1% for AGIs $100k-200k)
Total itemized deductions: $28,586 (reported on 12.2% of returns)
Here:
$28,586
State:
$33,775
(% of AGI for various income ranges: 71.8% for AGIs below $25k, 125.8% for AGIs $25k-50k, 356.5% for AGIs $50k-75k, 453.3% for AGIs $75k-100k, 733.4% for AGIs $100k-200k, 4178.7% for AGIs over 200k)
Charity contributions: $8,293 (reported on 9.3% of returns)
Here:
$8,293
State:
$13,075
(% of AGI for various income ranges: 4.4% for AGIs below $25k, 8.8% for AGIs $25k-50k, 30.5% for AGIs $50k-75k, 77.5% for AGIs $75k-100k, 149.5% for AGIs $100k-200k, 1376.1% for AGIs over 200k)
Taxes paid: $8,477 (reported on 12.1% of returns)
50211:
$8,477
State:
$7,704
(% of AGI for various income ranges: 12.1% for AGIs below $25k, 29.1% for AGIs $25k-50k, 109.1% for AGIs $50k-75k, 141.2% for AGIs $75k-100k, 256.6% for AGIs $100k-200k, 1069.1% for AGIs over 200k)
Earned income credit: $2,050 (reported on 7.5% of returns)
Here:
$2,050
State:
$2,195
(% of AGI for various income ranges: 52.7% for AGIs below $25k, 47.0% for AGIs $25k-50k)
Percentage of individuals using paid preparers for their 2020 taxes: 96.0%
Here:
96%
State:
95%
(% for various income ranges: 94.2% for AGIs below $25k, 95.7% for AGIs $25k-50k, 95.8% for AGIs $50k-75k, 97.7% for AGIs $75k-100k, 96.8% for AGIs $100k-200k, 96.7% for AGIs over 200k)
Averages for the 2012 tax year for zip code 50211, filed in 2013:
Average Adjusted Gross Income (AGI) in 2012: $69,137 (Individual Income Tax Returns)
Here:
$69,137
State:
$58,860
Salary/wage: $60,632 (reported on 89.4% of returns)
Here:
$60,632
State:
$46,659
(% of AGI for various income ranges: 78.8% for AGIs below $25k, 82.3% for AGIs $25k-50k, 80.3% for AGIs $50k-75k, 79.8% for AGIs $75k-100k, 85.8% for AGIs $100k-200k, 59.6% for AGIs over 200k)
Taxable interest for individuals: $1,193 (reported on 37.6% of returns)
This zip code:
$1,193
Iowa:
$1,537
(% of AGI for various income ranges: 1.4% for AGIs below $25k, 0.7% for AGIs $25k-50k, 0.4% for AGIs $50k-75k, 0.9% for AGIs $75k-100k, 0.4% for AGIs $100k-200k, 0.9% for AGIs over 200k)
Ordinary dividends: $2,516 (reported on 23.4% of returns)
Here:
$2,516
State:
$4,542
(% of AGI for various income ranges: 1.5% for AGIs below $25k, 0.8% for AGIs $25k-50k, 0.5% for AGIs $50k-75k, 0.6% for AGIs $75k-100k, 0.7% for AGIs $100k-200k, 1.6% for AGIs over 200k)
Net capital gain/loss in AGI: +$11,704 (reported on 17.9% of returns)
Here:
+$11,704
State:
+$11,802
(% of AGI for various income ranges: 0.6% for AGIs $25k-50k, 0.3% for AGIs $50k-75k, 0.8% for AGIs $75k-100k, 1.2% for AGIs $100k-200k, 12.8% for AGIs over 200k)
Profit/loss from business: +$11,249 (reported on 15.3% of returns)
Here:
+$11,249
State:
+$10,509
(% of AGI for various income ranges: 3.5% for AGIs below $25k, 2.5% for AGIs $25k-50k, 2.9% for AGIs $50k-75k, 2.3% for AGIs $75k-100k, 1.5% for AGIs $100k-200k, 3.9% for AGIs over 200k)
Taxable individual retirement arrangement distribution: $12,591 (reported on 10.2% of returns)
50211:
$12,591
Iowa:
$11,773
(% of AGI for various income ranges: 3.2% for AGIs below $25k, 1.8% for AGIs $25k-50k, 2.5% for AGIs $50k-75k, 2.3% for AGIs $75k-100k, 1.8% for AGIs $100k-200k, 0.7% for AGIs over 200k)
Self-employment retirement plans: $13,433 (reported on 0.5% of returns)
50211:
$13,433
Iowa:
$18,614
Total itemized deductions: $20,605 (20% of AGI, reported on 48.4% of returns)
Here:
$20,605
State:
$21,278
Here:
19.5% of AGI
State:
18.9% of AGI
(% of AGI for various income ranges: 13.8% for AGIs below $25k, 11.6% for AGIs $25k-50k, 15.0% for AGIs $50k-75k, 15.1% for AGIs $75k-100k, 15.9% for AGIs $100k-200k, 12.4% for AGIs over 200k)
Charity contributions: $2,824 (reported on 40.7% of returns)
Here:
$2,824
State:
$4,044
(% of AGI for various income ranges: 0.8% for AGIs below $25k, 1.0% for AGIs $25k-50k, 1.4% for AGIs $50k-75k, 1.7% for AGIs $75k-100k, 2.0% for AGIs $100k-200k, 1.9% for AGIs over 200k)
Taxes paid: $9,092 (reported on 48.4% of returns)
50211:
$9,092
State:
$8,846
(% of AGI for various income ranges: 3.1% for AGIs below $25k, 3.5% for AGIs $25k-50k, 5.5% for AGIs $50k-75k, 6.3% for AGIs $75k-100k, 7.8% for AGIs $100k-200k, 7.1% for AGIs over 200k)
Earned income credit: $2,058 (reported on 9.5% of returns)
Here:
$2,058
State:
$2,098
(% of AGI for various income ranges: 4.1% for AGIs below $25k, 0.9% for AGIs $25k-50k)
Percentage of individuals using paid preparers for their 2012 taxes: 56.2%
Here:
56%
State:
65%
(% for various income ranges: 46.0% for AGIs below $25k, 54.8% for AGIs $25k-50k, 60.6% for AGIs $50k-75k, 61.6% for AGIs $75k-100k, 61.9% for AGIs $100k-200k, 73.7% for AGIs over 200k)
Averages for the 2004 tax year for zip code 50211, filed in 2005:
Average Adjusted Gross Income (AGI) in 2004: $51,665 (Individual Income Tax Returns)
Here:
$51,665
State:
$43,875
Salary/wage: $47,950 (reported on 91.2% of returns)
Here:
$47,950
State:
$38,265
(% of AGI for various income ranges: 108.9% for AGIs below $10k, 77.5% for AGIs $10k-25k, 84.2% for AGIs $25k-50k, 86.7% for AGIs $50k-75k, 88.2% for AGIs $75k-100k, 81.2% for AGIs over 100k)
Taxable interest for individuals: $936 (reported on 50.7% of returns)
This zip code:
$936
Iowa:
$1,768
(% of AGI for various income ranges: 5.2% for AGIs below $10k, 2.3% for AGIs $10k-25k, 1.1% for AGIs $25k-50k, 0.8% for AGIs $50k-75k, 0.5% for AGIs $75k-100k, 0.8% for AGIs over 100k)
Taxable dividends: $1,092 (reported on 28.5% of returns)
Here:
$1,092
State:
$2,510
(% of AGI for various income ranges: 1.9% for AGIs below $10k, 1.0% for AGIs $10k-25k, 0.6% for AGIs $25k-50k, 0.6% for AGIs $50k-75k, 0.3% for AGIs $75k-100k, 0.7% for AGIs over 100k)
Net capital gain/loss: +$2,979 (reported on 20.9% of returns)
Here:
+$2,979
State:
+$6,139
(% of AGI for various income ranges: 4.0% for AGIs below $10k, -0.1% for AGIs $10k-25k, 0.5% for AGIs $25k-50k, 0.9% for AGIs $50k-75k, 1.2% for AGIs $75k-100k, 2.0% for AGIs over 100k)
Profit/loss from business: +$9,780 (reported on 16.6% of returns)
Here:
+$9,780
State:
+$8,574
(% of AGI for various income ranges: 0.4% for AGIs below $10k, 5.1% for AGIs $10k-25k, 2.8% for AGIs $25k-50k, 3.0% for AGIs $50k-75k, 2.1% for AGIs $75k-100k, 4.0% for AGIs over 100k)
IRA payment deduction: $3,010 (reported on 2.3% of returns)
50211:
$3,010
Iowa:
$2,970
(% of AGI for various income ranges: 0.3% for AGIs $10k-25k, 0.3% for AGIs $25k-50k, 0.1% for AGIs $50k-75k, 0.1% for AGIs $75k-100k, 0.1% for AGIs over 100k)
Self-employed pension: $11,219 (reported on 0.7% of returns)
Here:
$11,219
Iowa:
$11,928
Total itemized deductions: $16,717 (21% of AGI, reported on 49.6% of returns)
Here:
$16,717
State:
$16,976
Here:
21.4% of AGI
State:
20.8% of AGI
(% of AGI for various income ranges: 7.6% for AGIs below $10k, 13.1% for AGIs $10k-25k, 14.5% for AGIs $25k-50k, 17.1% for AGIs $50k-75k, 16.9% for AGIs $75k-100k, 16.5% for AGIs over 100k)
Charity contributions deductions: $2,161 (3% of AGI, reported on 44.1% of returns)
Here:
$2,161
State:
$3,089
Here:
2.7% of AGI
State:
3.6% of AGI
(% of AGI for various income ranges: 0.5% for AGIs below $10k, 1.0% for AGIs $10k-25k, 1.4% for AGIs $25k-50k, 1.8% for AGIs $50k-75k, 1.8% for AGIs $75k-100k, 2.3% for AGIs over 100k)
Total tax: $6,457 (reported on 81.7% of returns)
50211:
$6,457
State:
$6,177
(% of AGI for various income ranges: 2.8% for AGIs below $10k, 4.7% for AGIs $10k-25k, 6.9% for AGIs $25k-50k, 7.7% for AGIs $50k-75k, 9.2% for AGIs $75k-100k, 15.8% for AGIs over 100k)
Earned income credit: $1,437 (reported on 7.4% of returns)
Here:
$1,437
State:
$1,540
Percentage of individuals using paid preparers for their 2004 taxes: 60.8%
Here:
61%
State:
70%
(% for various income ranges: 46.1% for AGIs below $10k, 61.2% for AGIs $10k-25k, 62.8% for AGIs $25k-50k, 66.1% for AGIs $50k-75k, 64.0% for AGIs $75k-100k, 64.7% for AGIs over 100k)
Household received Food Stamps/SNAP in the past 12 months: 293 Household did not receive Food Stamps/SNAP in the past 12 months: 5,723
Women who had a birth in the past 12 months: 288 (234 now married, 56 unmarried) Women who did not have a birth in the past 12 months: 3,290 (1,770 now married, 1,517 unmarried)
Housing units in zip code 50211 with a mortgage: 3,540 (362 second mortgage, 277 both second mortgage and home equity loan) Houses without a mortgage: 11
Median monthly owner costs for units with a mortgage: $1,694 Median monthly owner costs for units without a mortgage: $755
Residents with income below the poverty level in 2022:
This zip code:
5.0%
Whole state:
11.0%
Residents with income below 50% of the poverty level in 2022:
This zip code:
2.4%
Whole state:
5.5%
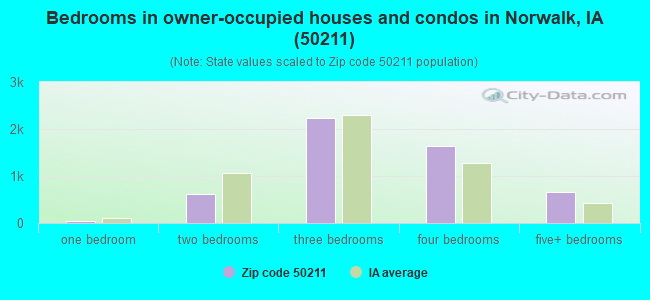
Median number of rooms in houses and condos:
Here:
7.0
State:
6.8
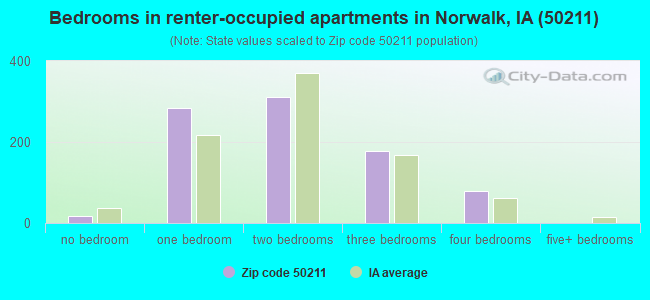
Median number of rooms in apartments:
Here:
3.3
State:
4.2
Notable locations in this zip code not listed on our city pages
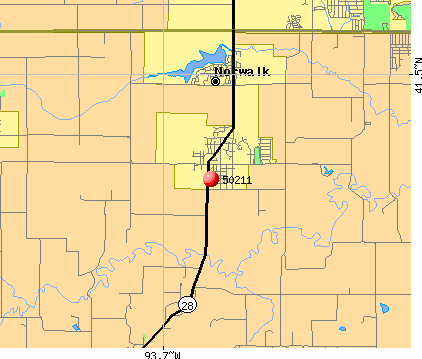
Notable locations in zip code 50211: Norwalk Aquatic Center (A), Countryside Golf Course (B), Rolling Hills Golf Course (C), Echo Valley Country Club (D), The Legacy Golf Course (E), Norwalk Fire and Rescue Department (F), Norwalk Easter Public Library (G), Norwalk City Hall (H), Norwalk City Police Department (I). Display/hide their locations on the map
Churches in zip code 50211 include: North River Church (A), Norwalk United Methodist Church (B), First Baptist Church (C), Norwalk Christian Church (D), Christ Our Savior Lutheran Church (E), Norwalk Foursquare Church (F), Fellowship Community Church (G), Assumption Church (H), New Life Lutheran Church (I). Display/hide their locations on the map
Parks in zip code 50211 include: McDonald Woods Park (1), Brownie Park (2), Norwalk City Park (3), Windflower Park (4), Wilson Woods (5). Display/hide their locations on the map
In group quarters: 129 (-1 institutionalized population)
Size of family households: 1,706 2-persons, 730 3-persons, 762 4-persons, 557 5-persons, 62 6-persons, 135 7-or-more-persons
Size of nonfamily households: 1,710 1-person, 283 2-persons, 31 3-persons
2,928 married couples with children.
895 single-parent households (605 men, 290 women).
98.2% of residents of 50211 zip code speak English at home.
1.1% of residents speak Spanish at home (23% very well, 42% well, 27% not well, 7% not at all).
0.1% of residents speak other Indo-European language at home (100% very well).
0.2% of residents speak Asian or Pacific Island language at home (100% very well).
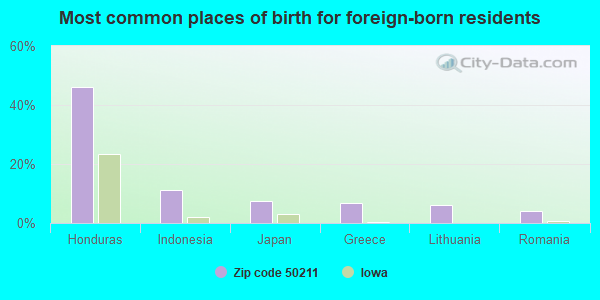
Foreign born population: 239 (1.6%) (69.2% of them are naturalized citizens)
This zip code:
1.6%
Whole state:
6.0%
46%Honduras
11%Indonesia
8%Japan
7%Greece
6%Lithuania
4%Romania
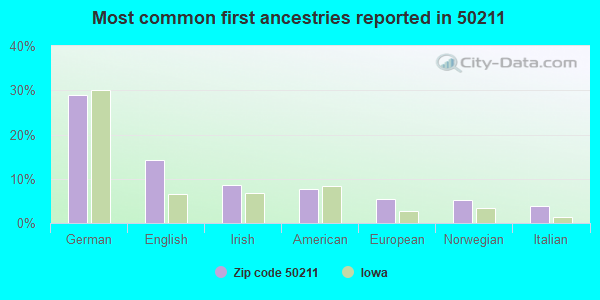
29%German
14%English
9%Irish
8%American
5%European
5%Norwegian
4%Italian
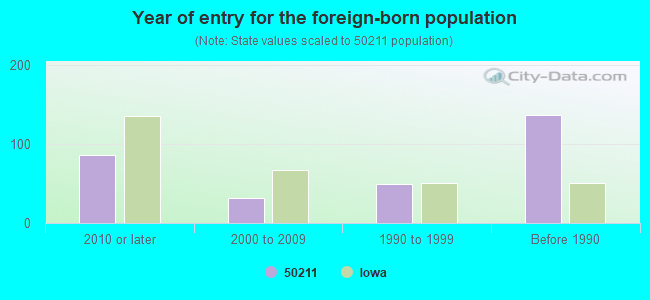
Year of entry for the foreign-born population
862010 or later
322000 to 2009
501990 to 1999
137Before 1990
Facilities with environmental interests located in this zip code:
NORWALK SENIOR HIGH SCHOOL (1201 NORTH AVE in NORWALK, IA)
(Integrated Compliance Information System) - ICIS-07-1985-0204, FORMAL ENFORCEMENT ACTION COMPLIANCE ACTIVITY (Tracking inspections of insecticide, fungicide, and rodenticide, and toxic substances) (National Center for Education Statistics) - STATE ID-914797 109 Conditionally Exempt Small Quantity Generators, less than 100 kg/month of hazardous waste (Resource Conservation and Recovery Act (tracking hazardous waste)) - ICIS-, ENFORCEMENT/COMPLIANCE ACTIVITY Business SIC classification: ELEMENTARY AND SECONDARY SCHOOLS Organizations: NORWALK COMMUNITY SCHOOL DISTRICT (CONTACT/OPERATOR)
, NORWALK COMM SCHOOL DISTRICT (SCHOOL DISTRICT)
Alternative names: NORWALK C S D, NORWALK COMMUNITY SCHOOL DISTRICT, NORWALK HIGH SCHOOL
NORWALK WATER SUPPLY (705 NORTH AVE. in NORWALK, IA)
STATE MASTER (Iowa emission factors information) - SDWIS-IA9164078, DRINKING WATER SYSTEM National Pollutant Discharge Elimination System NON-MAJOR (Tracking pollutant discharge elimination systems) - permit COMMUNITY WATER SYSTEM (SDWIS) Organizations: NORWALK, CITY OF MS4 (CONTACT/OWNER)
, NORWALK, CITY OF (LEGALLY RESPONSIBLE ENTITY)
Alternative names: NORWALK, CITY OF MS4, NORWALK WATER DEPARTMENT
OVIATT ELEMENTARY SCHOOL (713 SCHOOL AVE in NORWALK, IA)
(Geographic Names Information System) (National Center for Education Statistics) - STATE ID-914797 418 Organizations: NORWALK COMM SCHOOL DISTRICT (SCHOOL DISTRICT)
EAST ELEMENTARY (906 SCHOOL AVE in NORWALK, IA)
(National Center for Education Statistics) - STATE ID-914797 405 Organizations: NORWALK COMM SCHOOL DISTRICT (SCHOOL DISTRICT)
NORWALK MIDDLE SCHOOL (200 CHERRY STREET in NORWALK, IA)
(National Center for Education Statistics) - STATE ID-914797 209 Organizations: NORWALK COMM SCHOOL DISTRICT (SCHOOL DISTRICT)
DASO ELECTRO-COATINGS (429 R 57 HWY in NORWALK, IA)
(Resource Conservation and Recovery Act (tracking hazardous waste))
DAVID W EILTS (872 BLUE ST in NORWALK, IA)
(Resource Conservation and Recovery Act (tracking hazardous waste))
NORWALK READY MIX CONCRETE INC (1535 NORTH AVE in NORWALK, IA)
AIR MINOR (AIRS/AFS) Business SIC classification: READY-MIXED CONCRETE
NORWALK CITY OF STP (6999 DUBUQUE TRAIL in NORWALK, IA)
National Pollutant Discharge Elimination System MAJOR (Tracking pollutant discharge elimination systems) - permit Business SIC classification: SEWERAGE SYSTEMS
NORWALK CSD (906 SCHOOL AVENUE in NORWALK, IA)
COMPLIANCE ACTIVITY (Tracking inspections of insecticide, fungicide, and rodenticide, and toxic substances)
Housing units lacking complete plumbing facilities: 0.6% Housing units lacking complete kitchen facilities: 0.7%
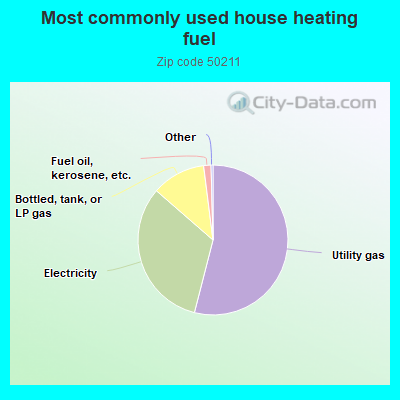
54.0%Utility gas
32.4%Electricity
11.6%Bottled, tank, or LP gas
1.6%Fuel oil, kerosene, etc.
Population in 1990: 9,512.
Place of birth for U.S.-born residents:
This state: 12,186
Northeast: 112
Midwest: 1,507
South: 426
West: 616
63% of the 50211 zip code residents lived in the same house 5 years ago. Out of people who lived in different houses, 38% lived in this county. Out of people who lived in different counties, 50% lived in Iowa.
88% of the 50211 zip code residents lived in the same house 1 year ago. Out of people who lived in different houses, 22% moved from this county. Out of people who lived in different houses, 63% moved from different county within same state. Out of people who lived in different houses, 15% moved from different state. Out of people who lived in different houses, 2% moved from abroad.
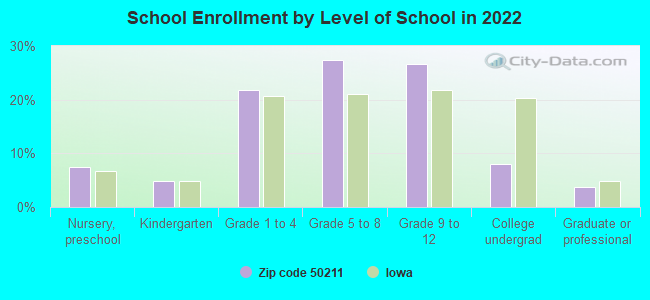
Private vs. public school enrollment:
Students in private schools in grades 1 to 8 (elementary and middle school): 77
Here:
4.0%
Iowa:
10.6%
Students in private schools in grades 9 to 12 (high school): 31
Here:
3.0%
Iowa:
7.9%
Students in private undergraduate colleges: 101
Here:
32.9%
Iowa:
23.9%
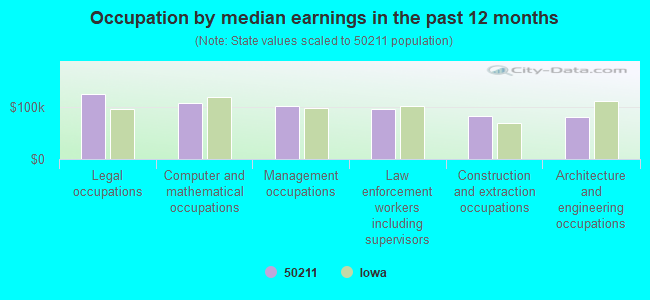
Occupation by median earnings in the past 12 months ($)
124,628Legal occupations
107,103Computer and mathematical occupations
101,930Management occupations
95,883Law enforcement workers including supervisors
81,298Construction and extraction occupations
80,768Architecture and engineering occupations
Companies with federal contracts located in this zip code:
UNIQUE COURTESY SERVICES (627 WRIGHT RD in NORWALK, IA; small business) : $303,800 in 18 contractsfrom 2002 to 2006
Contracts for Motor Passenger Services by Army Signed by year:2000: $0; 2001: $0; 2002: $24,760; 2003: $118,790; 2004: $6,535; 2005: $84,384; 2006: $69,331.
Biggest contracts:
$72,550 with Army for Motor Passenger Services. Signed on 2003-11-14. Completion date: 2004-09-30.
$69,331, same as above.Signed on 2006-02-01. Completion date: 2006-09-30.
$68,515, same as above.Signed on 2005-02-03. Completion date: 2004-09-30.
$47,050, same as above.Signed on 2003-02-14. Completion date: 2003-09-30.
Top industries in this zip code by the number of employees in 2005:
Wholesale Trade: Fresh Fruit and Vegetable Merchant Wholesalers (50-99 employees: 1 establishment, 5-9 employees: 1 establishment)
Health Care and Social Assistance: Nursing Care Facilities (50-99: 1)
Health Care and Social Assistance: Child Day Care Services (10-19: 2, 5-9: 1, 1-4: 2)
Other Services (except Public Administration): Religious Organizations (10-19: 2, 5-9: 1, 1-4: 2)
Finance and Insurance: Real Estate Credit (20-49: 1)
Wholesale Trade: Meat and Meat Product Merchant Wholesalers (20-49: 1)
People in group quarters in 2010:
134 people in nursing facilities/skilled-nursing facilities
People in group quarters in 2000:
132 people in nursing homes
6 people in college dormitories (includes college quarters off campus)
Fatal accident statistics in 2014:
Fatal accident count: 2
Vehicles involved in fatal accidents: 3
Fatal accidents caused by drunken drivers: 0
Fatalities: 2
Persons involved in fatal accidents: 3
Pedestrians involved in fatal accidents: 0
Fatal accident statistics in 2011:
Fatal accident count: 1
Vehicles involved in fatal accidents: 1
Fatal accidents caused by drunken drivers: 0
Fatalities: 1
Persons involved in fatal accidents: 1
Pedestrians involved in fatal accidents: 0
Home Mortgage Disclosure Act Aggregated Statistics For Year 2009 (Based on 2 full and 4 partial tracts)
A) FHA, FSA/RHS & VA Home Purchase Loans
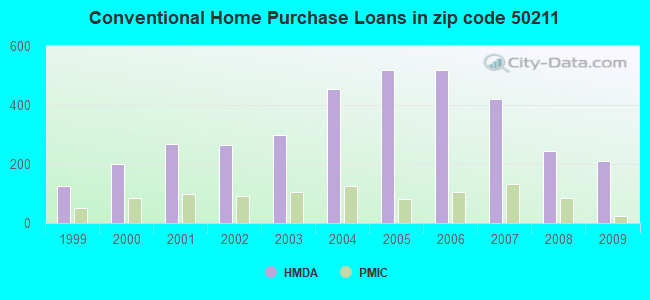
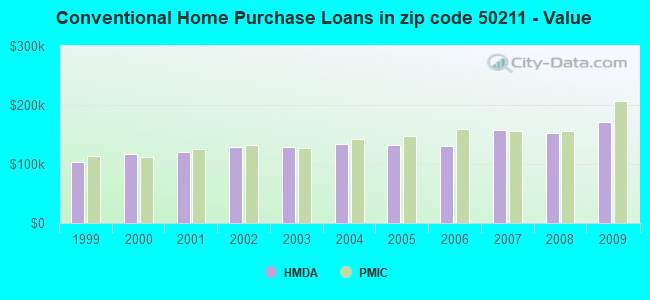
B) Conventional Home Purchase Loans
C) Refinancings
D) Home Improvement Loans
F) Non-occupant Loans on < 5 Family Dwellings (A B C & D)
G) Loans On Manufactured Home Dwelling (A B C & D)
Number
Average Value
Number
Average Value
Number
Average Value
Number
Average Value
Number
Average Value
Number
Average Value
LOANS ORIGINATED
233
$143,142
210
$171,172
880
$173,556
57
$46,118
42
$98,599
8
$99,718
APPLICATIONS APPROVED, NOT ACCEPTED
8
$173,762
11
$224,147
69
$177,313
5
$23,898
2
$68,980
0
$0
APPLICATIONS DENIED
17
$152,322
12
$205,128
176
$175,425
33
$48,297
4
$77,765
7
$40,717
APPLICATIONS WITHDRAWN
10
$141,313
15
$185,962
129
$156,515
5
$34,804
2
$11,995
1
$136,980
FILES CLOSED FOR INCOMPLETENESS
5
$120,702
6
$166,842
27
$184,380
1
$21,570
1
$95,350
0
$0
Aggregated Statistics For Year 2008 (Based on 2 full and 4 partial tracts)
A) FHA, FSA/RHS & VA Home Purchase Loans
B) Conventional Home Purchase Loans
C) Refinancings
D) Home Improvement Loans
E) Loans on Dwellings For 5+ Families
F) Non-occupant Loans on < 5 Family Dwellings (A B C & D)
G) Loans On Manufactured Home Dwelling (A B C & D)
Number
Average Value
Number
Average Value
Number
Average Value
Number
Average Value
Number
Average Value
Number
Average Value
Number
Average Value
LOANS ORIGINATED
165
$150,127
243
$152,814
362
$171,865
69
$45,475
4
$6,030,690
37
$128,728
7
$104,084
APPLICATIONS APPROVED, NOT ACCEPTED
1
$218,960
30
$169,034
81
$134,767
6
$15,312
0
$0
11
$88,564
0
$0
APPLICATIONS DENIED
20
$164,196
25
$207,880
218
$162,677
42
$76,615
0
$0
11
$100,702
5
$26,200
APPLICATIONS WITHDRAWN
12
$142,842
20
$170,090
96
$178,527
12
$113,350
0
$0
3
$120,227
0
$0
FILES CLOSED FOR INCOMPLETENESS
8
$122,214
10
$212,415
40
$154,652
0
$0
0
$0
0
$0
0
$0
Aggregated Statistics For Year 2007 (Based on 2 full and 4 partial tracts)
A) FHA, FSA/RHS & VA Home Purchase Loans
B) Conventional Home Purchase Loans
C) Refinancings
D) Home Improvement Loans
F) Non-occupant Loans on < 5 Family Dwellings (A B C & D)
G) Loans On Manufactured Home Dwelling (A B C & D)
Number
Average Value
Number
Average Value
Number
Average Value
Number
Average Value
Number
Average Value
Number
Average Value
LOANS ORIGINATED
33
$162,451
422
$157,903
370
$128,803
117
$31,458
46
$95,741
12
$95,128
APPLICATIONS APPROVED, NOT ACCEPTED
0
$0
71
$163,614
81
$114,945
16
$29,824
5
$95,296
1
$34,160
APPLICATIONS DENIED
4
$133,460
43
$111,931
247
$145,783
42
$46,371
5
$21,724
5
$111,528
APPLICATIONS WITHDRAWN
2
$94,910
23
$183,215
94
$132,770
15
$164,115
5
$144,112
0
$0
FILES CLOSED FOR INCOMPLETENESS
0
$0
15
$112,183
43
$140,588
0
$0
1
$54,080
0
$0
Aggregated Statistics For Year 2006 (Based on 2 full and 4 partial tracts)
A) FHA, FSA/RHS & VA Home Purchase Loans
B) Conventional Home Purchase Loans
C) Refinancings
D) Home Improvement Loans
E) Loans on Dwellings For 5+ Families
F) Non-occupant Loans on < 5 Family Dwellings (A B C & D)
G) Loans On Manufactured Home Dwelling (A B C & D)
Number
Average Value
Number
Average Value
Number
Average Value
Number
Average Value
Number
Average Value
Number
Average Value
Number
Average Value
LOANS ORIGINATED
37
$139,707
520
$131,255
456
$121,208
91
$33,053
4
$1,239,628
53
$104,822
7
$64,736
APPLICATIONS APPROVED, NOT ACCEPTED
5
$118,938
52
$150,187
120
$123,596
15
$40,662
0
$0
6
$104,407
4
$79,528
APPLICATIONS DENIED
6
$94,192
82
$92,654
341
$120,634
69
$24,227
0
$0
62
$112,517
13
$36,562
APPLICATIONS WITHDRAWN
6
$157,953
38
$150,886
123
$122,664
12
$75,861
0
$0
2
$123,965
2
$31,990
FILES CLOSED FOR INCOMPLETENESS
1
$115,990
22
$168,122
113
$139,475
2
$121,965
0
$0
9
$173,864
0
$0
Aggregated Statistics For Year 2005 (Based on 2 full and 4 partial tracts)
A) FHA, FSA/RHS & VA Home Purchase Loans
B) Conventional Home Purchase Loans
C) Refinancings
D) Home Improvement Loans
E) Loans on Dwellings For 5+ Families
F) Non-occupant Loans on < 5 Family Dwellings (A B C & D)
G) Loans On Manufactured Home Dwelling (A B C & D)
Number
Average Value
Number
Average Value
Number
Average Value
Number
Average Value
Number
Average Value
Number
Average Value
Number
Average Value
LOANS ORIGINATED
39
$143,196
518
$132,582
529
$120,639
87
$46,427
8
$576,828
44
$93,194
9
$87,761
APPLICATIONS APPROVED, NOT ACCEPTED
3
$265,287
48
$139,120
124
$110,634
8
$48,176
0
$0
2
$149,955
3
$44,770
APPLICATIONS DENIED
5
$89,354
53
$133,525
289
$115,438
47
$50,790
0
$0
2
$111,965
12
$33,119
APPLICATIONS WITHDRAWN
6
$219,933
43
$133,318
189
$118,763
8
$46,078
0
$0
7
$102,367
1
$81,970
FILES CLOSED FOR INCOMPLETENESS
0
$0
24
$133,688
107
$131,816
0
$0
0
$0
0
$0
0
$0
Aggregated Statistics For Year 2004 (Based on 2 full and 4 partial tracts)
A) FHA, FSA/RHS & VA Home Purchase Loans
B) Conventional Home Purchase Loans
C) Refinancings
D) Home Improvement Loans
F) Non-occupant Loans on < 5 Family Dwellings (A B C & D)
G) Loans On Manufactured Home Dwelling (A B C & D)
Number
Average Value
Number
Average Value
Number
Average Value
Number
Average Value
Number
Average Value
Number
Average Value
LOANS ORIGINATED
49
$142,457
455
$133,225
502
$120,006
83
$34,927
27
$95,573
10
$58,185
APPLICATIONS APPROVED, NOT ACCEPTED
5
$152,366
45
$105,799
93
$114,024
15
$30,689
11
$83,487
1
$29,890
APPLICATIONS DENIED
6
$146,290
28
$120,248
228
$117,391
56
$19,979
2
$121,965
7
$47,219
APPLICATIONS WITHDRAWN
2
$148,955
32
$108,121
183
$114,765
6
$71,980
5
$81,118
0
$0
FILES CLOSED FOR INCOMPLETENESS
1
$148,850
36
$115,591
117
$120,986
3
$27,043
0
$0
0
$0
Aggregated Statistics For Year 2003 (Based on 2 full and 4 partial tracts)
A) FHA, FSA/RHS & VA Home Purchase Loans
B) Conventional Home Purchase Loans
C) Refinancings
D) Home Improvement Loans
E) Loans on Dwellings For 5+ Families
F) Non-occupant Loans on < 5 Family Dwellings (A B C & D)
Number
Average Value
Number
Average Value
Number
Average Value
Number
Average Value
Number
Average Value
Number
Average Value
LOANS ORIGINATED
58
$125,158
300
$129,068
1,262
$113,640
99
$17,894
4
$436,370
31
$89,090
APPLICATIONS APPROVED, NOT ACCEPTED
0
$0
16
$179,988
109
$113,443
25
$26,965
0
$0
2
$108,965
APPLICATIONS DENIED
0
$0
30
$96,282
378
$111,162
60
$21,421
0
$0
18
$98,837
APPLICATIONS WITHDRAWN
6
$154,817
27
$105,550
158
$117,169
7
$30,311
0
$0
2
$110,965
FILES CLOSED FOR INCOMPLETENESS
3
$123,137
15
$120,947
90
$120,048
6
$25,325
0
$0
5
$87,968
Aggregated Statistics For Year 2002 (Based on 2 full and 4 partial tracts)
A) FHA, FSA/RHS & VA Home Purchase Loans
B) Conventional Home Purchase Loans
C) Refinancings
D) Home Improvement Loans
E) Loans on Dwellings For 5+ Families
F) Non-occupant Loans on < 5 Family Dwellings (A B C & D)
Number
Average Value
Number
Average Value
Number
Average Value
Number
Average Value
Number
Average Value
Number
Average Value
LOANS ORIGINATED
55
$112,603
266
$129,599
912
$113,233
138
$17,326
6
$321,570
30
$84,320
APPLICATIONS APPROVED, NOT ACCEPTED
3
$124,190
34
$94,118
105
$94,504
18
$31,157
0
$0
1
$129,430
APPLICATIONS DENIED
5
$112,756
47
$73,724
189
$84,329
48
$20,740
0
$0
2
$33,990
APPLICATIONS WITHDRAWN
1
$131,590
41
$96,501
169
$102,414
6
$28,727
0
$0
2
$15,995
FILES CLOSED FOR INCOMPLETENESS
1
$104,620
11
$109,993
61
$109,546
3
$24,117
0
$0
1
$94,920
Aggregated Statistics For Year 2001 (Based on 2 full and 4 partial tracts)
A) FHA, FSA/RHS & VA Home Purchase Loans
B) Conventional Home Purchase Loans
C) Refinancings
D) Home Improvement Loans
F) Non-occupant Loans on < 5 Family Dwellings (A B C & D)
Number
Average Value
Number
Average Value
Number
Average Value
Number
Average Value
Number
Average Value
LOANS ORIGINATED
84
$104,099
267
$120,836
702
$100,025
109
$18,238
21
$53,558
APPLICATIONS APPROVED, NOT ACCEPTED
4
$100,715
19
$118,836
79
$96,558
15
$25,575
0
$0
APPLICATIONS DENIED
5
$99,634
44
$64,464
192
$84,575
28
$10,341
4
$49,392
APPLICATIONS WITHDRAWN
2
$121,880
21
$99,144
101
$87,227
6
$15,102
1
$123,820
FILES CLOSED FOR INCOMPLETENESS
0
$0
4
$150,205
28
$109,629
1
$7,120
1
$107,860
Aggregated Statistics For Year 2000 (Based on 2 full and 4 partial tracts)
A) FHA, FSA/RHS & VA Home Purchase Loans
B) Conventional Home Purchase Loans
C) Refinancings
D) Home Improvement Loans
F) Non-occupant Loans on < 5 Family Dwellings (A B C & D)
Number
Average Value
Number
Average Value
Number
Average Value
Number
Average Value
Number
Average Value
LOANS ORIGINATED
59
$98,503
201
$117,789
267
$73,454
116
$19,689
14
$62,947
APPLICATIONS APPROVED, NOT ACCEPTED
5
$114,312
23
$121,837
47
$71,431
20
$26,460
1
$93,930
APPLICATIONS DENIED
2
$132,960
46
$55,667
101
$72,049
46
$20,404
3
$82,333
APPLICATIONS WITHDRAWN
1
$217,880
24
$107,759
60
$76,110
8
$21,308
0
$0
FILES CLOSED FOR INCOMPLETENESS
0
$0
3
$105,277
19
$83,739
1
$16,180
0
$0
Aggregated Statistics For Year 1999 (Based on 1 full and 2 partial tracts)
A) FHA, FSA/RHS & VA Home Purchase Loans
B) Conventional Home Purchase Loans
C) Refinancings
D) Home Improvement Loans
E) Loans on Dwellings For 5+ Families
F) Non-occupant Loans on < 5 Family Dwellings (A B C & D)
2002 - 2018 National Fire Incident Reporting System (NFIRS) incidents
According to the data from the years 2002 - 2018 the average number of fires per year is 12. The highest number of fire incidents - 56 took place in 2011, and the least - 0 in 2003. The data has a growing trend.
When looking into fire subcategories, the most reports belonged to: Outside Fires (44.4%), and Structure Fires (33.8%).
Fire incident types reported to NFIRS in Zip Code 50211


 Nearest zip codes: 50061, 50160, 50321, 50229, 50265, 50315.


 According to the data from the years 2002 - 2018 the average number of fires per year is 12. The highest number of fire incidents - 56 took place in 2011, and the least - 0 in 2003. The data has a growing trend.
 When looking into fire subcategories, the most reports belonged to: Outside Fires (44.4%), and Structure Fires (33.8%).