Estimated zip code population in 2022: 1,565 Zip code population in 2010: 1,753 Zip code population in 2000: 1,719
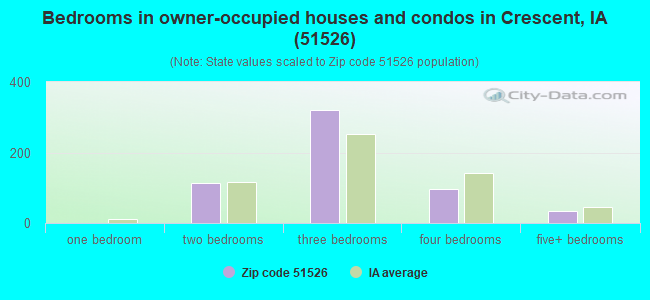
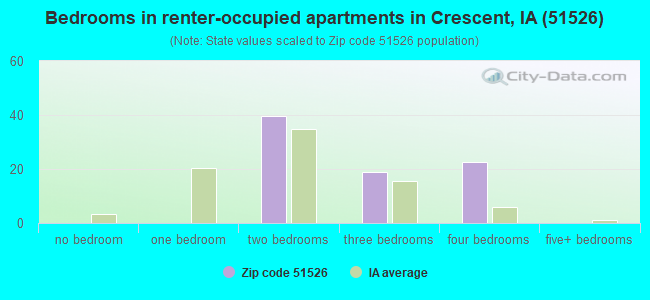
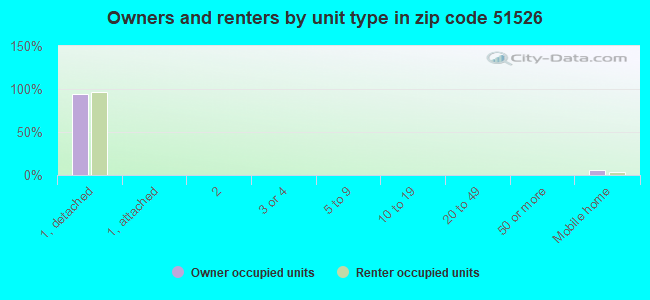
Houses and condos: 700 Renter-occupied apartments: 80
% of renters here:
12%
State:
28%
March 2022 cost of living index in zip code 51526: 81.3 (low, U.S. average is 100)
Land area: 41.8 sq. mi. Water area: 1.1 sq. mi.
Population density: 37 people per square mile
(very low).
OSM Map
General Map
Google Map
MSN Map
OSM Map
General Map
Google Map
MSN Map
OSM Map
General Map
Google Map
MSN Map
OSM Map
General Map
Google Map
MSN Map
Please wait while loading the map...
Real estate property taxes paid for housing units in 2022:
This zip code:
1.4% ($4,054)
Iowa:
1.4% ($2,724)
Median real estate property taxes paid for housing units with mortgages in 2022: $4,294 (1.4%) Median real estate property taxes paid for housing units with no mortgage in 2022: $3,287 (1.1%)
Business Search- 14 Million verified businesses
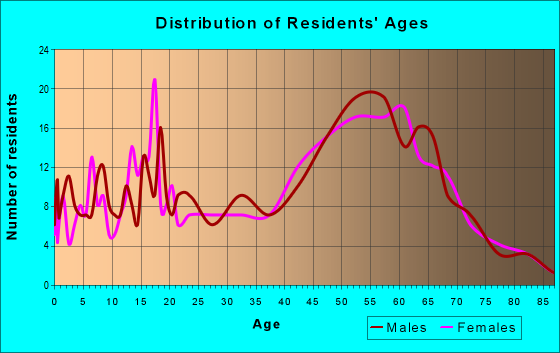
Males: 856
(54.7%)
Females: 709
(45.3%)
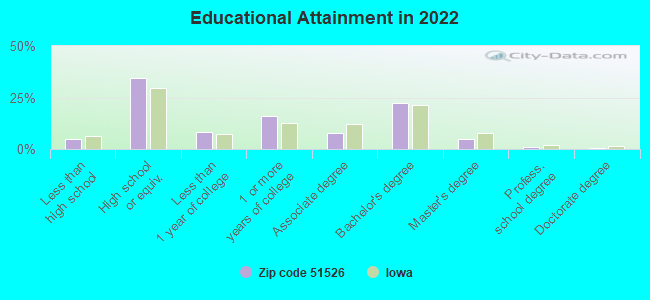
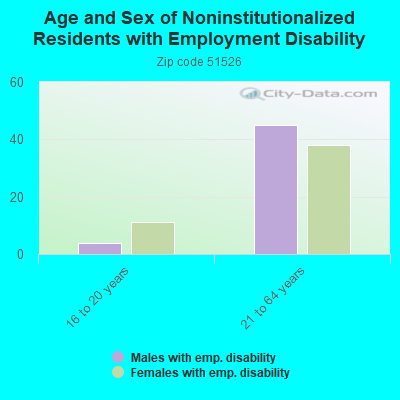
For population 25 years and over in 51526:
High school or higher: 93.8%
Bachelor's degree or higher: 28.4%
Graduate or professional degree: 6.3%
Unemployed: 0.6%
Mean travel time to work (commute): 25.9 minutes
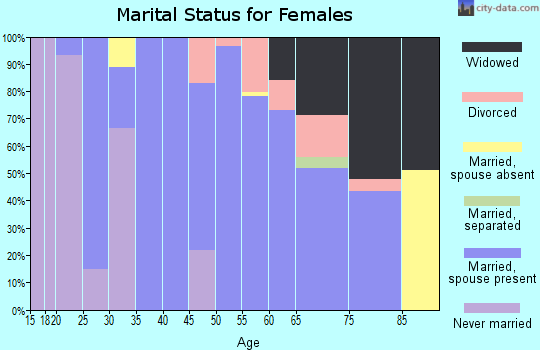
For population 15 years and over in 51526:
Never married: 24.3%
Now married: 55.3%
Separated: 1.0%
Widowed: 8.9%
Divorced: 10.4%
Zip code 51526 compared to state average:
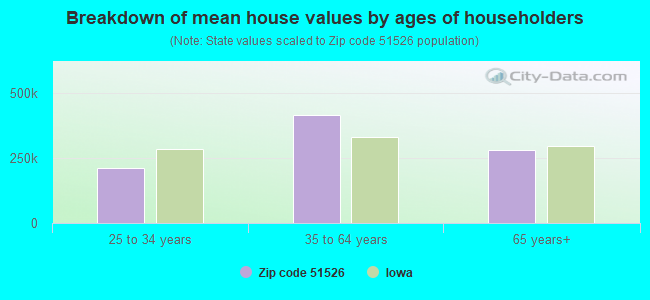
Median house value above state average.
Unemployed percentage significantly below state average.
Black race population percentage significantly below state average.
Hispanic race population percentage below state average.
Median age significantly above state average.
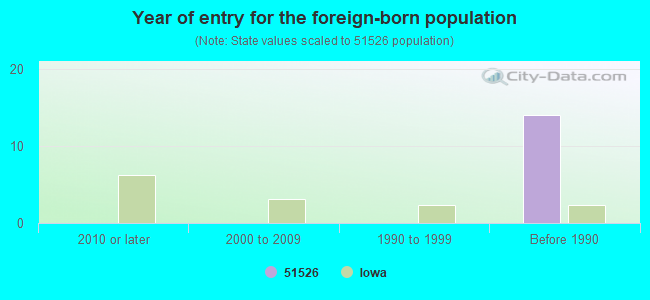
Foreign-born population percentage significantly below state average.
Renting percentage significantly below state average.
Length of stay since moving in significantly above state average.
Estimated median house/condo value in 2022: $297,472
51526:
$297,472
Iowa:
$194,600
Median resident age:
This zip code:
50.7 years
Iowa median age:
38.9 years
Average household size:
This zip code:
2.4 people
Iowa:
2.3 people
Averages for the 2020 tax year for zip code 51526, filed in 2021:
Average Adjusted Gross Income (AGI) in 2020: $82,879 (Individual Income Tax Returns)
Here:
$82,879
State:
$71,087
Salary/wage: $69,424 (reported on 80.5% of returns)
Here:
$69,424
State:
$57,361
(% of AGI for various income ranges: 1321.5% for AGIs below $25k, 3667.5% for AGIs $25k-50k, 6129.0% for AGIs $50k-75k, 8541.4% for AGIs $75k-100k, 17505.5% for AGIs $100k-200k)
Taxable interest for individuals: $982 (reported on 41.5% of returns)
This zip code:
$982
Iowa:
$1,633
(% of AGI for various income ranges: 16.9% for AGIs below $25k, 22.5% for AGIs $25k-50k, 89.0% for AGIs $50k-75k, 27.1% for AGIs $75k-100k, 137.3% for AGIs $100k-200k)
Ordinary dividends: $3,238 (reported on 25.6% of returns)
Here:
$3,238
State:
$5,432
(% of AGI for various income ranges: 36.9% for AGIs below $25k, 56.0% for AGIs $50k-75k, 148.6% for AGIs $75k-100k, 239.1% for AGIs $100k-200k)
Net capital gain/loss in AGI: +$12,222 (reported on 22.0% of returns)
Here:
+$12,222
State:
+$15,243
(% of AGI for various income ranges: 21.5% for AGIs below $25k, 96.7% for AGIs $25k-50k, 14.0% for AGIs $50k-75k, 32.9% for AGIs $75k-100k, 530.9% for AGIs $100k-200k)
Profit/loss from business: +$5,122 (reported on 11.0% of returns)
Here:
+$5,122
State:
+$11,763
(% of AGI for various income ranges: 183.8% for AGIs below $25k, 135.0% for AGIs $50k-75k, 79.1% for AGIs $100k-200k)
Taxable individual retirement arrangement distribution: $17,667 (reported on 14.6% of returns)
51526:
$17,667
Iowa:
$17,324
(% of AGI for various income ranges: 248.5% for AGIs below $25k, 609.0% for AGIs $50k-75k, 1080.0% for AGIs $100k-200k)
Total itemized deductions: $30,840 (reported on 6.1% of returns)
Here:
$30,840
State:
$33,775
(% of AGI for various income ranges: 364.2% for AGIs $25k-50k, 1004.5% for AGIs $100k-200k)
Charity contributions: $6,000 (reported on 4.9% of returns)
Here:
$6,000
State:
$13,075
(% of AGI for various income ranges: 218.2% for AGIs $100k-200k)
Taxes paid: $8,360 (reported on 6.1% of returns)
51526:
$8,360
State:
$7,704
(% of AGI for various income ranges: 101.5% for AGIs below $25k, 260.0% for AGIs $100k-200k)
Earned income credit: $1,700 (reported on 7.3% of returns)
Here:
$1,700
State:
$2,195
(% of AGI for various income ranges: 78.5% for AGIs below $25k)
Percentage of individuals using paid preparers for their 2020 taxes: 96.3%
Here:
96%
State:
95%
(% for various income ranges: 94.4% for AGIs below $25k, 94.1% for AGIs $25k-50k, 93.3% for AGIs $50k-75k, 100.0% for AGIs $75k-100k, 100.0% for AGIs $100k-200k, 100.0% for AGIs over 200k)
Averages for the 2012 tax year for zip code 51526, filed in 2013:
Average Adjusted Gross Income (AGI) in 2012: $62,234 (Individual Income Tax Returns)
Here:
$62,234
State:
$58,860
Salary/wage: $52,865 (reported on 82.6% of returns)
Here:
$52,865
State:
$46,659
(% of AGI for various income ranges: 67.9% for AGIs below $25k, 74.7% for AGIs $25k-50k, 69.2% for AGIs $50k-75k, 78.2% for AGIs $75k-100k, 93.3% for AGIs $100k-200k)
Taxable interest for individuals: $1,005 (reported on 45.3% of returns)
This zip code:
$1,005
Iowa:
$1,537
(% of AGI for various income ranges: 2.1% for AGIs below $25k, 0.8% for AGIs $25k-50k, 1.0% for AGIs $50k-75k, 0.4% for AGIs $75k-100k, 0.8% for AGIs $100k-200k)
Ordinary dividends: $3,979 (reported on 22.1% of returns)
Here:
$3,979
State:
$4,542
(% of AGI for various income ranges: 2.2% for AGIs $25k-50k, 0.5% for AGIs $50k-75k, 0.3% for AGIs $75k-100k, 2.9% for AGIs $100k-200k)
Net capital gain/loss in AGI: +$1,360 (reported on 17.4% of returns)
Here:
+$1,360
State:
+$11,802
(% of AGI for various income ranges: 1.3% for AGIs $100k-200k)
Profit/loss from business: +$5,650 (reported on 14.0% of returns)
Here:
+$5,650
State:
+$10,509
(% of AGI for various income ranges: 4.9% for AGIs below $25k, 1.6% for AGIs $25k-50k, 1.1% for AGIs $50k-75k, 2.3% for AGIs $75k-100k, 0.6% for AGIs $100k-200k)
Taxable individual retirement arrangement distribution: $12,522 (reported on 10.5% of returns)
51526:
$12,522
Iowa:
$11,773
(% of AGI for various income ranges: 3.8% for AGIs $25k-50k, 5.0% for AGIs $50k-75k, 4.5% for AGIs $75k-100k)
Total itemized deductions: $21,331 (21% of AGI, reported on 40.7% of returns)
Here:
$21,331
State:
$21,278
Here:
20.6% of AGI
State:
18.9% of AGI
(% of AGI for various income ranges: 11.8% for AGIs below $25k, 14.6% for AGIs $25k-50k, 14.4% for AGIs $50k-75k, 13.0% for AGIs $75k-100k, 20.1% for AGIs $100k-200k)
Charity contributions: $2,497 (reported on 34.9% of returns)
Here:
$2,497
State:
$4,044
(% of AGI for various income ranges: 1.2% for AGIs $25k-50k, 1.6% for AGIs $50k-75k, 1.0% for AGIs $75k-100k, 2.4% for AGIs $100k-200k)
Taxes paid: $8,634 (reported on 40.7% of returns)
51526:
$8,634
State:
$8,846
(% of AGI for various income ranges: 3.3% for AGIs below $25k, 3.6% for AGIs $25k-50k, 4.5% for AGIs $50k-75k, 5.3% for AGIs $75k-100k, 7.1% for AGIs $100k-200k, 6.6% for AGIs over 200k)
Earned income credit: $1,600 (reported on 9.3% of returns)
Here:
$1,600
State:
$2,098
(% of AGI for various income ranges: 3.2% for AGIs below $25k, 0.5% for AGIs $25k-50k)
Percentage of individuals using paid preparers for their 2012 taxes: 70.9%
Here:
71%
State:
65%
(% for various income ranges: 57.7% for AGIs below $25k, 68.4% for AGIs $25k-50k, 76.9% for AGIs $50k-75k, 83.3% for AGIs $75k-100k, 92.9% for AGIs $100k-200k)
Averages for the 2004 tax year for zip code 51526, filed in 2005:
Average Adjusted Gross Income (AGI) in 2004: $48,182 (Individual Income Tax Returns)
Here:
$48,182
State:
$43,875
Salary/wage: $43,406 (reported on 86.3% of returns)
Here:
$43,406
State:
$38,265
(% of AGI for various income ranges: 300.5% for AGIs below $10k, 73.9% for AGIs $10k-25k, 77.5% for AGIs $25k-50k, 84.2% for AGIs $50k-75k, 78.6% for AGIs $75k-100k, 69.1% for AGIs over 100k)
Taxable interest for individuals: $1,192 (reported on 55.7% of returns)
This zip code:
$1,192
Iowa:
$1,768
(% of AGI for various income ranges: 12.3% for AGIs below $10k, 2.2% for AGIs $10k-25k, 1.5% for AGIs $25k-50k, 1.1% for AGIs $50k-75k, 0.5% for AGIs $75k-100k, 1.8% for AGIs over 100k)
Taxable dividends: $1,660 (reported on 28.5% of returns)
Here:
$1,660
State:
$2,510
(% of AGI for various income ranges: 7.3% for AGIs below $10k, 1.5% for AGIs $10k-25k, 0.5% for AGIs $25k-50k, 0.5% for AGIs $50k-75k, 0.3% for AGIs $75k-100k, 1.9% for AGIs over 100k)
Net capital gain/loss: +$8,947 (reported on 22.7% of returns)
Here:
+$8,947
State:
+$6,139
(% of AGI for various income ranges: -5.0% for AGIs below $10k, -0.7% for AGIs $10k-25k, 0.0% for AGIs $25k-50k, 0.0% for AGIs $50k-75k, 3.5% for AGIs $75k-100k, 11.8% for AGIs over 100k)
Profit/loss from business: +$4,508 (reported on 15.5% of returns)
Here:
+$4,508
State:
+$8,574
(% of AGI for various income ranges: -45.0% for AGIs below $10k, 4.6% for AGIs $10k-25k, 0.2% for AGIs $25k-50k, 2.2% for AGIs $50k-75k, 2.5% for AGIs $75k-100k, 1.1% for AGIs over 100k)
Profit/loss from farming: +$2,385 (reported on 4.7% of returns)
Here:
+$2,385
State:
-$74
IRA payment deduction: $3,147 (reported on 4.1% of returns)
51526:
$3,147
Iowa:
$2,970
Total itemized deductions: $16,701 (21% of AGI, reported on 41.9% of returns)
Here:
$16,701
State:
$16,976
Here:
21.2% of AGI
State:
20.8% of AGI
(% of AGI for various income ranges: 10.2% for AGIs $10k-25k, 15.4% for AGIs $25k-50k, 13.5% for AGIs $50k-75k, 15.7% for AGIs $75k-100k, 15.1% for AGIs over 100k)
Charity contributions deductions: $1,993 (2% of AGI, reported on 36.9% of returns)
Here:
$1,993
State:
$3,089
Here:
2.5% of AGI
State:
3.6% of AGI
(% of AGI for various income ranges: 0.2% for AGIs $10k-25k, 1.4% for AGIs $25k-50k, 1.5% for AGIs $50k-75k, 2.0% for AGIs $75k-100k, 1.6% for AGIs over 100k)
Total tax: $5,972 (reported on 81.9% of returns)
51526:
$5,972
State:
$6,177
(% of AGI for various income ranges: 10.0% for AGIs below $10k, 4.9% for AGIs $10k-25k, 6.4% for AGIs $25k-50k, 8.4% for AGIs $50k-75k, 10.0% for AGIs $75k-100k, 15.1% for AGIs over 100k)
Earned income credit: $1,338 (reported on 8.6% of returns)
Here:
$1,338
State:
$1,540
Percentage of individuals using paid preparers for their 2004 taxes: 74.4%
Here:
74%
State:
70%
(% for various income ranges: 57.3% for AGIs below $10k, 76.3% for AGIs $10k-25k, 74.3% for AGIs $25k-50k, 80.4% for AGIs $50k-75k, 88.3% for AGIs $75k-100k, 74.1% for AGIs over 100k)
Likely homosexual households (counted as self-reported same-sex unmarried-partner households)
Lesbian couples: 0.7% of all households
Gay men: 0.0% of all households
Household received Food Stamps/SNAP in the past 12 months: 64 Household did not receive Food Stamps/SNAP in the past 12 months: 582
Women who had a birth in the past 12 months: 6 (6 now married, 0 unmarried) Women who did not have a birth in the past 12 months: 265 (142 now married, 123 unmarried)
Housing units in zip code 51526 with a mortgage: 316 (63 second mortgage, 52 both second mortgage and home equity loan) Median monthly owner costs for units with a mortgage: $1,633 Median monthly owner costs for units without a mortgage: $660
Residents with income below the poverty level in 2022:
This zip code:
0.8%
Whole state:
11.0%
Residents with income below 50% of the poverty level in 2022:
This zip code:
0.3%
Whole state:
5.5%
Median number of rooms in houses and condos:
Here:
6.9
State:
6.8
Median number of rooms in apartments:
Here:
5.8
State:
4.2
Notable locations in this zip code not listed on our city pages
Notable locations in zip code 51526: Honey Creek Campground (A), Camp Pokamoke (B), Clara (C), Crescent Volunteer Fire and Rescue (D). Display/hide their locations on the map
Size of family households: 233 2-persons, 121 3-persons, 25 4-persons, 52 5-persons, 9 6-persons
Size of nonfamily households: 129 1-person, 79 2-persons
157 married couples with children.
31 single-parent households (28 men, 3 women).
100.1% of residents of 51526 zip code speak English at home.
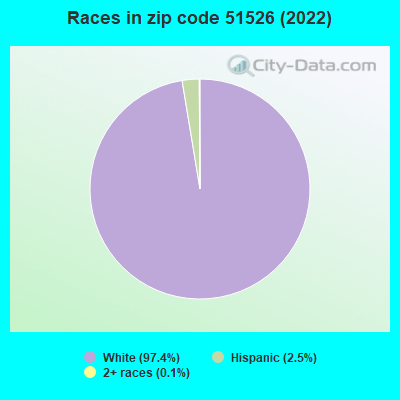
Foreign born population: 0 (0.0%)
:
0.0%
Whole state:
6.0%
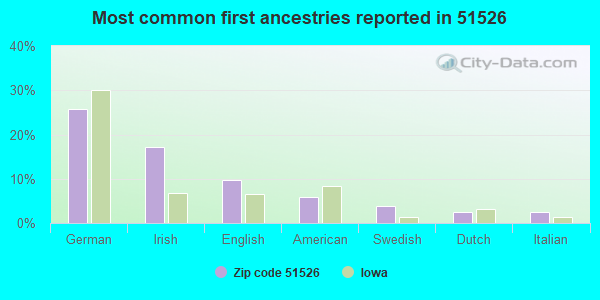
26%German
17%Irish
10%English
6%American
4%Swedish
3%Dutch
2%Italian
Year of entry for the foreign-born population
02010 or later
02000 to 2009
01990 to 1999
14Before 1990
Facilities with environmental interests located in this zip code:
CRESCENT ELEMENTARY SCHOOL (401 EAST WELCH in CRESCENT, IA)
(Geographic Names Information System) (National Center for Education Statistics) - STATE ID-781476 425 Organizations: COUNCIL BLUFFS COMM SCHOOL DISTRICT (SCHOOL DISTRICT)
National Pollutant Discharge Elimination System NON-MAJOR (Tracking pollutant discharge elimination systems) - permit Business SIC classification: CRUSHED AND BROKEN LIMESTONE Organizations: SCHILDBERG CONSTRUCTION CO., I (CONTACT/OWNER)
Alternative names: SCHILDBERG CONSTRUCTION CO INC
CRESCENT CITY OF STP (102 WEST FLORENCE STREET in CRESCENT, IA)
National Pollutant Discharge Elimination System NON-MAJOR (Tracking pollutant discharge elimination systems) - permit Business SIC classification: SEWERAGE SYSTEMS Organizations: CITY OF CRESCENT (CONTACT/OWNER)
SOIL & WATER PURIFICATION SERVICES, INC. (R.R. 1, BOX 181 in CRESCENT, IA)
AIR MINOR (AIRS/AFS) Business SIC classification: NONCLASSIFIABLE ESTABLISHMENTS
HENNINGSEN CONSTRUCTION INC (15692 HWY 988 in CRESCENT, IA)
AIR MINOR (AIRS/AFS) Business SIC classification: ASPHALT PAVING MIXTURES AND BLOCKS
MUELL REFRIGERATION (ROUTE 1 BOX 304 in CRESCENT, IA)
AIR MINOR (AIRS/AFS) Business SIC classification: AUTOMOTIVE REPAIR SHOPS Alternative names: CLOSED FACILITY - MUELL REFRIGERATION
Housing units lacking complete kitchen facilities: 5.7%
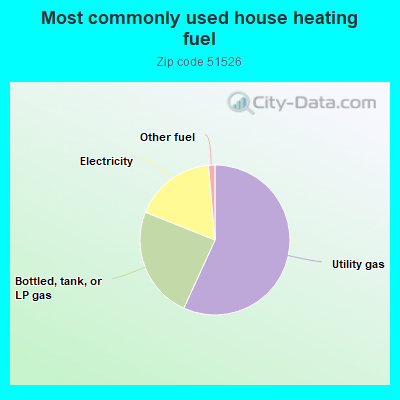
57.0%Utility gas
24.3%Bottled, tank, or LP gas
17.6%Electricity
1.4%Other fuel
Population in 1990: 1,967.
Place of birth for U.S.-born residents:
This state: 841
Northeast: 48
Midwest: 504
South: 34
West: 108
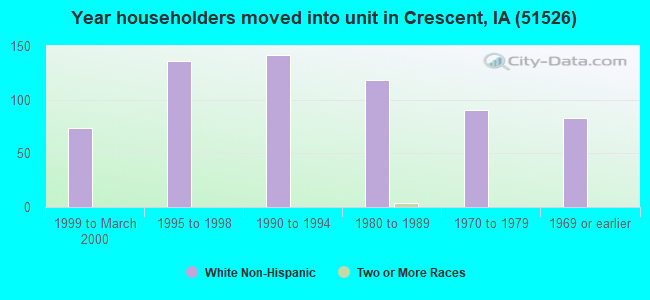
69% of the 51526 zip code residents lived in the same house 5 years ago. Out of people who lived in different houses, 74% lived in this county. Out of people who lived in different counties, 50% lived in Iowa.
94% of the 51526 zip code residents lived in the same house 1 year ago. Out of people who lived in different houses, 72% moved from this county. Out of people who lived in different houses, 9% moved from different county within same state. Out of people who lived in different houses, 17% moved from different state.
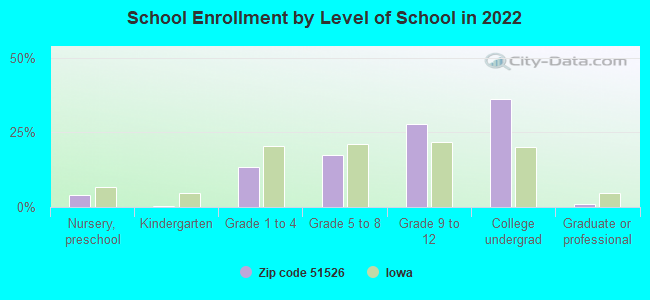
Private vs. public school enrollment:
Students in private schools in grades 1 to 8 (elementary and middle school): 2
Here:
2.9%
Iowa:
10.6%
Students in private schools in grades 9 to 12 (high school):
Here:
0.0%
Iowa:
7.9%
Students in private undergraduate colleges: 4
Here:
4.5%
Iowa:
23.9%
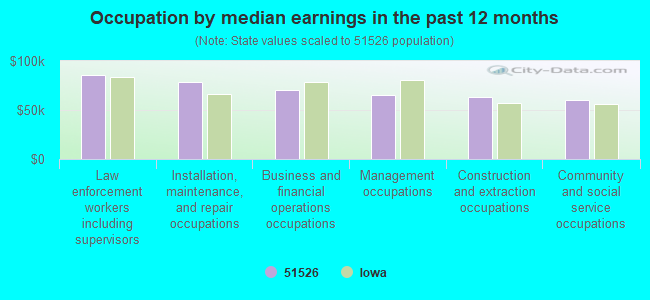
Occupation by median earnings in the past 12 months ($)
85,633Law enforcement workers including supervisors
78,639Installation, maintenance, and repair occupations
69,905Business and financial operations occupations
65,409Management occupations
63,607Construction and extraction occupations
59,854Community and social service occupations
Top industries in this zip code by the number of employees in 2005:
Arts, Entertainment, and Recreation: Skiing Facilities (50-99 employees: 1 establishment)
Accommodation and Food Services: Full-Service Restaurants (20-49: 1)
Mining: Crushed and Broken Limestone Mining and Quarrying (10-19: 1)
Arts, Entertainment, and Recreation: Promoters of Performing Arts, Sports, and Similar Events with Facilities (10-19: 1)
Construction: Water and Sewer Line and Related Structures Construction (10-19: 1)
Construction: Highway, Street, and Bridge Construction (5-9: 1, 1-4: 1)
Arts, Entertainment, and Recreation: Promoters of Performing Arts, Sports, and Similar Events without Facilities (5-9: 1, 1-4: 1)
Fatal accident statistics in 2014:
Fatal accident count: 1
Vehicles involved in fatal accidents: 2
Fatal accidents caused by drunken drivers: 1
Fatalities: 1
Persons involved in fatal accidents: 4
Pedestrians involved in fatal accidents: 0
Fatal accident statistics in 2012:
Fatal accident count: 1
Vehicles involved in fatal accidents: 2
Fatal accidents caused by drunken drivers: 1
Fatalities: 2
Persons involved in fatal accidents: 7
Pedestrians involved in fatal accidents: 0
Home Mortgage Disclosure Act Aggregated Statistics For Year 2009 (Based on 4 partial tracts)
A) FHA, FSA/RHS & VA Home Purchase Loans
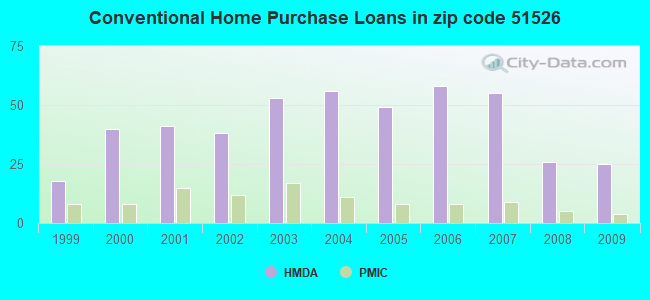
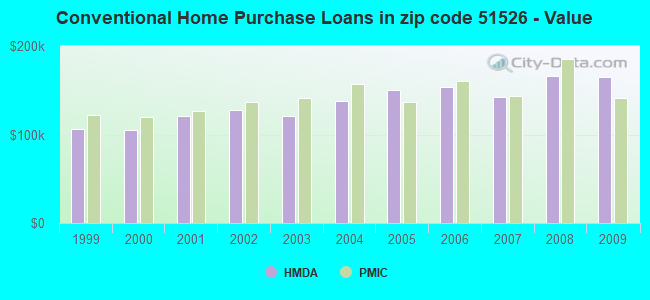
B) Conventional Home Purchase Loans
C) Refinancings
D) Home Improvement Loans
F) Non-occupant Loans on < 5 Family Dwellings (A B C & D)
G) Loans On Manufactured Home Dwelling (A B C & D)
Number
Average Value
Number
Average Value
Number
Average Value
Number
Average Value
Number
Average Value
Number
Average Value
LOANS ORIGINATED
15
$145,299
25
$164,823
148
$154,910
20
$43,222
4
$91,530
3
$97,997
APPLICATIONS APPROVED, NOT ACCEPTED
1
$285,360
2
$160,260
12
$187,001
1
$119,860
0
$0
0
$0
APPLICATIONS DENIED
2
$161,335
4
$132,348
35
$154,021
3
$70,560
2
$110,005
1
$143,750
APPLICATIONS WITHDRAWN
0
$0
1
$194,400
23
$178,906
0
$0
1
$219,730
1
$158,120
FILES CLOSED FOR INCOMPLETENESS
0
$0
0
$0
8
$193,576
1
$39,570
1
$81,510
0
$0
Aggregated Statistics For Year 2008 (Based on 4 partial tracts)
A) FHA, FSA/RHS & VA Home Purchase Loans
B) Conventional Home Purchase Loans
C) Refinancings
D) Home Improvement Loans
F) Non-occupant Loans on < 5 Family Dwellings (A B C & D)
G) Loans On Manufactured Home Dwelling (A B C & D)
Number
Average Value
Number
Average Value
Number
Average Value
Number
Average Value
Number
Average Value
Number
Average Value
LOANS ORIGINATED
8
$146,309
26
$166,463
93
$149,238
21
$44,816
10
$98,953
2
$141,395
APPLICATIONS APPROVED, NOT ACCEPTED
1
$154,010
1
$46,690
14
$226,781
0
$0
0
$0
0
$0
APPLICATIONS DENIED
1
$252,260
4
$70,405
39
$187,516
11
$69,552
0
$0
2
$95,205
APPLICATIONS WITHDRAWN
1
$125,040
2
$97,305
12
$167,049
3
$63,407
0
$0
0
$0
FILES CLOSED FOR INCOMPLETENESS
0
$0
0
$0
6
$201,442
0
$0
0
$0
0
$0
Aggregated Statistics For Year 2007 (Based on 4 partial tracts)
A) FHA, FSA/RHS & VA Home Purchase Loans
B) Conventional Home Purchase Loans
C) Refinancings
D) Home Improvement Loans
F) Non-occupant Loans on < 5 Family Dwellings (A B C & D)
G) Loans On Manufactured Home Dwelling (A B C & D)
Number
Average Value
Number
Average Value
Number
Average Value
Number
Average Value
Number
Average Value
Number
Average Value
LOANS ORIGINATED
2
$149,715
55
$142,305
79
$123,333
27
$40,354
8
$110,582
1
$116,110
APPLICATIONS APPROVED, NOT ACCEPTED
0
$0
1
$87,860
13
$125,624
3
$33,380
0
$0
0
$0
APPLICATIONS DENIED
0
$0
5
$114,656
38
$154,991
13
$48,424
1
$140,300
2
$104,645
APPLICATIONS WITHDRAWN
0
$0
4
$124,995
16
$170,744
1
$172,330
2
$64,500
1
$43,530
FILES CLOSED FOR INCOMPLETENESS
0
$0
0
$0
4
$134,700
0
$0
0
$0
0
$0
Aggregated Statistics For Year 2006 (Based on 4 partial tracts)
A) FHA, FSA/RHS & VA Home Purchase Loans
B) Conventional Home Purchase Loans
C) Refinancings
D) Home Improvement Loans
F) Non-occupant Loans on < 5 Family Dwellings (A B C & D)
G) Loans On Manufactured Home Dwelling (A B C & D)
Number
Average Value
Number
Average Value
Number
Average Value
Number
Average Value
Number
Average Value
Number
Average Value
LOANS ORIGINATED
2
$177,100
58
$154,222
99
$124,219
27
$32,009
8
$133,159
2
$43,980
APPLICATIONS APPROVED, NOT ACCEPTED
0
$0
3
$155,547
10
$135,022
1
$58,520
1
$156,380
0
$0
APPLICATIONS DENIED
0
$0
8
$122,221
40
$156,142
8
$45,464
3
$61,440
3
$37,753
APPLICATIONS WITHDRAWN
0
$0
9
$98,010
26
$183,780
6
$89,683
2
$217,095
0
$0
FILES CLOSED FOR INCOMPLETENESS
0
$0
0
$0
10
$192,066
1
$199,430
0
$0
0
$0
Aggregated Statistics For Year 2005 (Based on 4 partial tracts)
A) FHA, FSA/RHS & VA Home Purchase Loans
B) Conventional Home Purchase Loans
C) Refinancings
D) Home Improvement Loans
F) Non-occupant Loans on < 5 Family Dwellings (A B C & D)
G) Loans On Manufactured Home Dwelling (A B C & D)
Number
Average Value
Number
Average Value
Number
Average Value
Number
Average Value
Number
Average Value
Number
Average Value
LOANS ORIGINATED
3
$143,103
49
$150,005
116
$140,027
29
$35,257
4
$120,432
4
$92,692
APPLICATIONS APPROVED, NOT ACCEPTED
0
$0
4
$90,172
14
$144,284
3
$26,733
0
$0
0
$0
APPLICATIONS DENIED
0
$0
9
$126,611
55
$153,374
12
$64,852
1
$128,290
3
$59,290
APPLICATIONS WITHDRAWN
0
$0
8
$156,536
34
$140,477
1
$53,710
1
$50,090
2
$90,220
FILES CLOSED FOR INCOMPLETENESS
0
$0
0
$0
12
$166,538
1
$20,580
0
$0
0
$0
Aggregated Statistics For Year 2004 (Based on 4 partial tracts)
A) FHA, FSA/RHS & VA Home Purchase Loans
B) Conventional Home Purchase Loans
C) Refinancings
D) Home Improvement Loans
F) Non-occupant Loans on < 5 Family Dwellings (A B C & D)
G) Loans On Manufactured Home Dwelling (A B C & D)
Number
Average Value
Number
Average Value
Number
Average Value
Number
Average Value
Number
Average Value
Number
Average Value
LOANS ORIGINATED
4
$114,392
56
$137,466
129
$127,993
24
$37,735
3
$59,180
2
$105,815
APPLICATIONS APPROVED, NOT ACCEPTED
0
$0
6
$103,932
25
$136,835
1
$87,100
1
$19,790
0
$0
APPLICATIONS DENIED
0
$0
5
$155,802
65
$152,912
9
$17,548
0
$0
2
$73,215
APPLICATIONS WITHDRAWN
0
$0
4
$132,528
25
$141,397
2
$39,570
0
$0
0
$0
FILES CLOSED FOR INCOMPLETENESS
0
$0
1
$71,230
13
$152,828
1
$15,830
0
$0
0
$0
Aggregated Statistics For Year 2003 (Based on 4 partial tracts)
A) FHA, FSA/RHS & VA Home Purchase Loans
B) Conventional Home Purchase Loans
C) Refinancings
D) Home Improvement Loans
F) Non-occupant Loans on < 5 Family Dwellings (A B C & D)
Number
Average Value
Number
Average Value
Number
Average Value
Number
Average Value
Number
Average Value
LOANS ORIGINATED
7
$126,224
53
$121,345
284
$120,754
23
$25,877
7
$102,191
APPLICATIONS APPROVED, NOT ACCEPTED
0
$0
9
$118,003
36
$113,528
3
$44,470
1
$53,820
APPLICATIONS DENIED
0
$0
12
$171,576
69
$126,765
7
$13,001
5
$86,822
APPLICATIONS WITHDRAWN
0
$0
3
$146,520
52
$108,906
2
$48,450
2
$157,490
FILES CLOSED FOR INCOMPLETENESS
0
$0
2
$151,815
12
$174,186
1
$1,580
2
$130,580
Aggregated Statistics For Year 2002 (Based on 4 partial tracts)
A) FHA, FSA/RHS & VA Home Purchase Loans
B) Conventional Home Purchase Loans
C) Refinancings
D) Home Improvement Loans
E) Loans on Dwellings For 5+ Families
F) Non-occupant Loans on < 5 Family Dwellings (A B C & D)
Number
Average Value
Number
Average Value
Number
Average Value
Number
Average Value
Number
Average Value
Number
Average Value
LOANS ORIGINATED
1
$109,210
38
$127,991
206
$117,489
36
$24,296
1
$4,750
8
$108,642
APPLICATIONS APPROVED, NOT ACCEPTED
0
$0
3
$161,623
28
$113,558
4
$40,410
0
$0
2
$124,645
APPLICATIONS DENIED
2
$103,675
7
$121,914
32
$118,349
4
$8,542
0
$0
1
$101,130
APPLICATIONS WITHDRAWN
0
$0
3
$158,890
36
$105,164
2
$29,950
0
$0
0
$0
FILES CLOSED FOR INCOMPLETENESS
0
$0
1
$68,830
9
$136,458
0
$0
0
$0
1
$24,530
Aggregated Statistics For Year 2001 (Based on 4 partial tracts)
A) FHA, FSA/RHS & VA Home Purchase Loans
B) Conventional Home Purchase Loans
C) Refinancings
D) Home Improvement Loans
F) Non-occupant Loans on < 5 Family Dwellings (A B C & D)
Number
Average Value
Number
Average Value
Number
Average Value
Number
Average Value
Number
Average Value
LOANS ORIGINATED
3
$107,460
41
$120,680
152
$114,130
29
$30,468
5
$81,580
APPLICATIONS APPROVED, NOT ACCEPTED
0
$0
1
$82,600
23
$111,252
2
$31,335
0
$0
APPLICATIONS DENIED
0
$0
4
$95,750
41
$128,608
7
$35,414
1
$47,480
APPLICATIONS WITHDRAWN
0
$0
7
$99,464
20
$105,733
0
$0
0
$0
FILES CLOSED FOR INCOMPLETENESS
0
$0
0
$0
7
$139,071
0
$0
0
$0
Aggregated Statistics For Year 2000 (Based on 4 partial tracts)
A) FHA, FSA/RHS & VA Home Purchase Loans
B) Conventional Home Purchase Loans
C) Refinancings
D) Home Improvement Loans
F) Non-occupant Loans on < 5 Family Dwellings (A B C & D)
Number
Average Value
Number
Average Value
Number
Average Value
Number
Average Value
Number
Average Value
LOANS ORIGINATED
3
$148,223
40
$105,516
77
$83,043
40
$24,372
6
$44,833
APPLICATIONS APPROVED, NOT ACCEPTED
0
$0
5
$56,932
9
$85,651
5
$41,336
0
$0
APPLICATIONS DENIED
0
$0
6
$84,945
14
$87,048
11
$28,972
2
$55,795
APPLICATIONS WITHDRAWN
0
$0
3
$109,010
12
$90,568
0
$0
1
$67,270
FILES CLOSED FOR INCOMPLETENESS
0
$0
0
$0
8
$96,515
1
$4,750
0
$0
Aggregated Statistics For Year 1999 (Based on 2 partial tracts)
A) FHA, FSA/RHS & VA Home Purchase Loans
B) Conventional Home Purchase Loans
C) Refinancings
D) Home Improvement Loans
F) Non-occupant Loans on < 5 Family Dwellings (A B C & D)
Detailed PMIC statistics for the following Tracts:0214.00
, 0318.00
2002 - 2018 National Fire Incident Reporting System (NFIRS) incidents
According to the data from the years 2002 - 2018 the average number of fire incidents per year is 9. The highest number of reported fires - 51 took place in 2002, and the least - 0 in 2009. The data has a decreasing trend.
When looking into fire subcategories, the most incidents belonged to: Outside Fires (62.3%), and Structure Fires (16.6%).
Fire incident types reported to NFIRS in Zip Code 51526


+$2,385
-$74
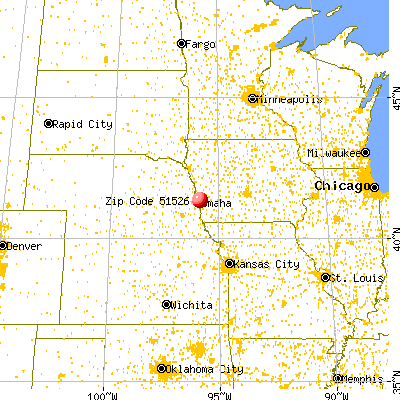
 Nearest zip codes: 51542, 68110, 68112, 51510, 68111, 68102.


 According to the data from the years 2002 - 2018 the average number of fire incidents per year is 9. The highest number of reported fires - 51 took place in 2002, and the least - 0 in 2009. The data has a decreasing trend.
 When looking into fire subcategories, the most incidents belonged to: Outside Fires (62.3%), and Structure Fires (16.6%).