Estimated zip code population in 2022: 338 Zip code population in 2010: 274 Zip code population in 2000: 356
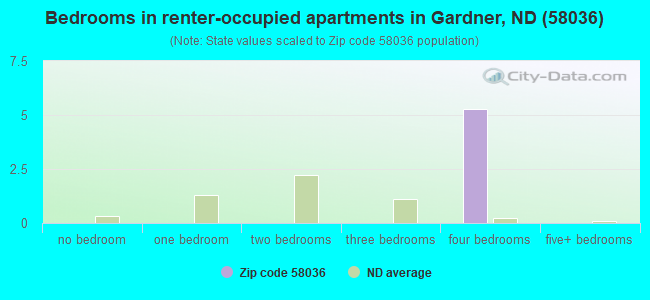
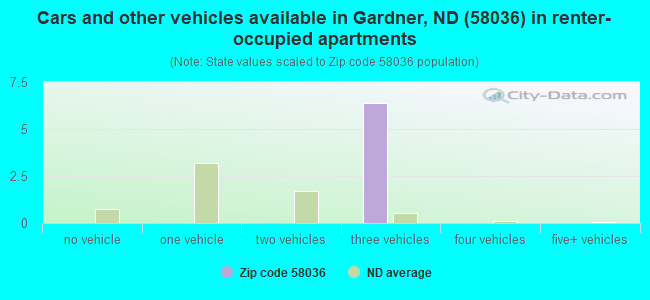
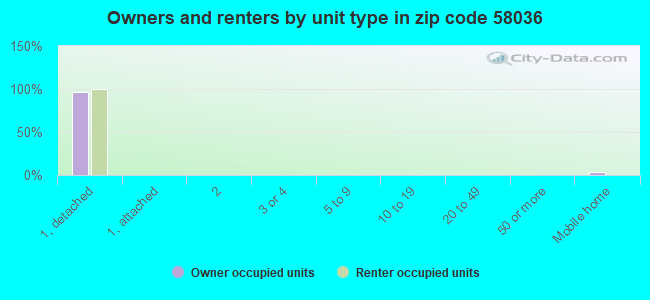
Houses and condos: 145 Renter-occupied apartments: 5
% of renters here:
5%
State:
35%
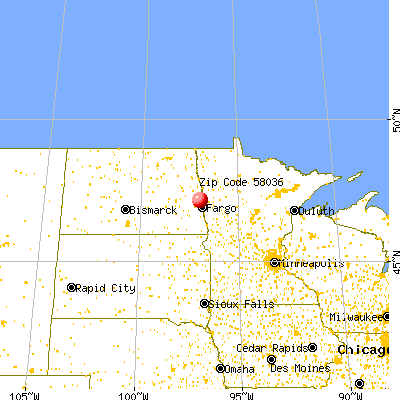
March 2022 cost of living index in zip code 58036: 78.0 (low, U.S. average is 100)
Land area: 74.2 sq. mi. Water area: 0.0 sq. mi.
Population density: 5 people per square mile
(very low).
OSM Map
General Map
Google Map
MSN Map
OSM Map
General Map
Google Map
MSN Map
OSM Map
General Map
Google Map
MSN Map
OSM Map
General Map
Google Map
MSN Map
Please wait while loading the map...
Real estate property taxes paid for housing units in 2022:
This zip code:
0.9% ($2,431)
North Dakota:
1.0% ($2,347)
Median real estate property taxes paid for housing units with mortgages in 2022: $2,473 (1.0%) Median real estate property taxes paid for housing units with no mortgage in 2022: $2,367 (0.9%)
Business Search- 14 Million verified businesses
Males: 177
(52.6%)
Females: 160
(47.4%)
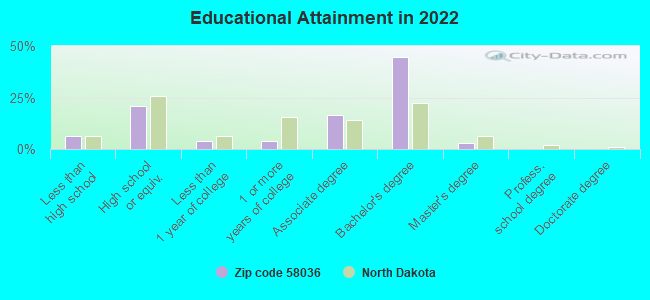
For population 25 years and over in 58036:
High school or higher: 93.3%
Bachelor's degree or higher: 47.1%
Graduate or professional degree: 3.1%
Mean travel time to work (commute): 38.2 minutes
For population 15 years and over in 58036:
Never married: 22.3%
Now married: 71.1%
Separated: 0.0%
Widowed: 0.0%
Divorced: 6.7%
Zip code 58036 compared to state average:
Unemployed percentage significantly below state average.
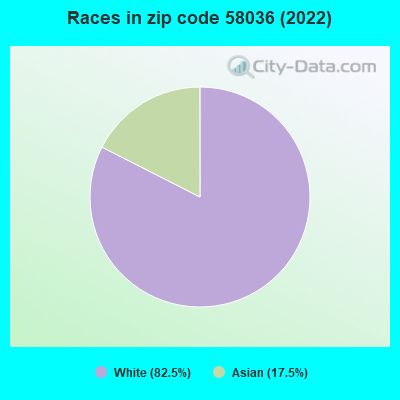
Black race population percentage significantly below state average.
Hispanic race population percentage significantly below state average.
Median age above state average.
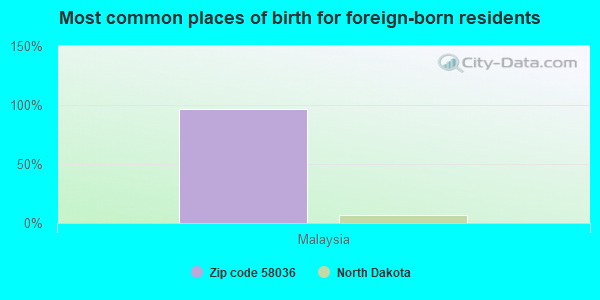
Foreign-born population percentage significantly above state average.
Renting percentage significantly below state average.
Length of stay since moving in significantly above state average.
Number of rooms per house above state average.
Percentage of population with a bachelor's degree or higher above state average.
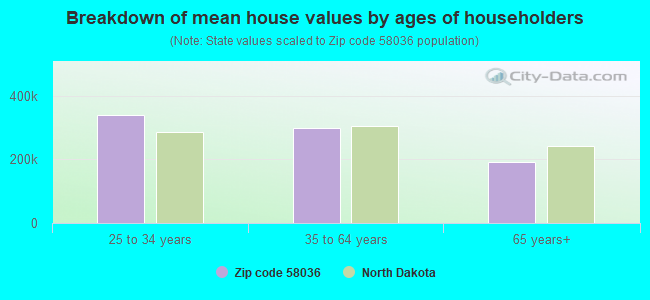
Estimated median house/condo value in 2022: $257,006
58036:
$257,006
North Dakota:
$243,100
Median resident age:
This zip code:
42.3 years
North Dakota median age:
36.2 years
Average household size:
This zip code:
2.7 people
North Dakota:
2.3 people
Averages for the 2020 tax year for zip code 58036, filed in 2021:
Average Adjusted Gross Income (AGI) in 2020: $74,907 (Individual Income Tax Returns)
Here:
$74,907
State:
$77,891
Salary/wage: $63,309 (reported on 78.6% of returns)
Here:
$63,309
State:
$59,202
(% of AGI for various income ranges: 4015.0% for AGIs $25k-50k, 5068.0% for AGIs $50k-75k)
Taxable interest for individuals: $875 (reported on 28.6% of returns)
This zip code:
$875
North Dakota:
$2,112
(% of AGI for various income ranges: )
Net capital gain/loss in AGI: +$2,000 (reported on 14.3% of returns)
Here:
+$2,000
State:
+$17,618
(% of AGI for various income ranges: 200.0% for AGIs $25k-50k)
Percentage of individuals using paid preparers for their 2020 taxes: 85.7%
Here:
86%
State:
95%
(% for various income ranges: 80.0% for AGIs $25k-50k, 80.0% for AGIs $50k-75k, 100.0% for AGIs $100k-200k)
Averages for the 2012 tax year for zip code 58036, filed in 2013:
Average Adjusted Gross Income (AGI) in 2012: $61,692 (Individual Income Tax Returns)
Here:
$61,692
State:
$70,683
Salary/wage: $41,755 (reported on 84.6% of returns)
Here:
$41,755
State:
$48,615
(% of AGI for various income ranges: 66.2% for AGIs below $25k, 66.0% for AGIs $25k-50k, 93.3% for AGIs $75k-100k, 33.3% for AGIs $100k-200k)
Taxable interest for individuals: $360 (reported on 38.5% of returns)
This zip code:
$360
North Dakota:
$1,659
Ordinary dividends: $367 (reported on 23.1% of returns)
Here:
$367
State:
$4,855
Net capital gain/loss in AGI: +$15,450 (reported on 15.4% of returns)
Here:
+$15,450
State:
+$26,078
Taxes paid: $3,350 (reported on 15.4% of returns)
58036:
$3,350
State:
$6,844
Percentage of individuals using paid preparers for their 2012 taxes: 61.5%
Here:
62%
State:
59%
Averages for the 2004 tax year for zip code 58036, filed in 2005:
Average Adjusted Gross Income (AGI) in 2004: $40,024 (Individual Income Tax Returns)
Here:
$40,024
State:
$40,108
Salary/wage: $31,592 (reported on 83.5% of returns)
Here:
$31,592
State:
$33,868
(% of AGI for various income ranges: 114.7% for AGIs below $10k, 65.0% for AGIs $10k-25k, 73.6% for AGIs $25k-50k, 79.3% for AGIs $50k-75k, 46.7% for AGIs $75k-100k)
Taxable interest for individuals: $671 (reported on 48.2% of returns)
This zip code:
$671
North Dakota:
$1,652
(% of AGI for various income ranges: 11.0% for AGIs below $10k, 1.8% for AGIs $10k-25k, 0.9% for AGIs $25k-50k, 0.3% for AGIs $50k-75k, 0.5% for AGIs $75k-100k)
Taxable dividends: $533 (reported on 26.5% of returns)
Here:
$533
State:
$2,207
Net capital gain/loss: +$86 (reported on 20.6% of returns)
Here:
+$86
State:
+$6,573
Profit/loss from business: +$5,435 (reported on 13.5% of returns)
Here:
+$5,435
State:
+$8,636
Profit/loss from farming: +$3,722 (reported on 10.6% of returns)
Here:
+$3,722
State:
+$1,979
Total itemized deductions: $11,923 (24% of AGI, reported on 15.3% of returns)
Here:
$11,923
State:
$16,683
Here:
24.2% of AGI
State:
18.6% of AGI
Charity contributions deductions: $1,000 (2% of AGI, reported on 8.8% of returns)
Here:
$1,000
State:
$3,523
Here:
1.8% of AGI
State:
3.6% of AGI
Total tax: $5,470 (reported on 78.8% of returns)
58036:
$5,470
State:
$5,748
(% of AGI for various income ranges: 1.8% for AGIs below $10k, 5.5% for AGIs $10k-25k, 9.0% for AGIs $25k-50k, 9.5% for AGIs $50k-75k, 15.1% for AGIs $75k-100k)
Percentage of individuals using paid preparers for their 2004 taxes: 65.9%
Here:
66%
State:
63%
(% for various income ranges: 56.2% for AGIs below $10k, 69.8% for AGIs $10k-25k, 66.7% for AGIs $25k-50k, 57.1% for AGIs $50k-75k, 83.3% for AGIs $75k-100k)
Household received Food Stamps/SNAP in the past 12 months: 1 Household did not receive Food Stamps/SNAP in the past 12 months: 122
Women who had a birth in the past 12 months: 5 (6 now married, 0 unmarried) Women who did not have a birth in the past 12 months: 64 (38 now married, 26 unmarried)
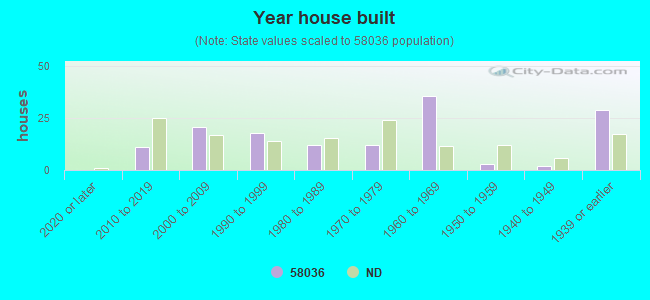
Housing units in zip code 58036 with a mortgage: 62 (7 second mortgage, 6 both second mortgage and home equity loan) Houses without a mortgage: 30
Median monthly owner costs for units with a mortgage: $1,751 Median monthly owner costs for units without a mortgage: $748
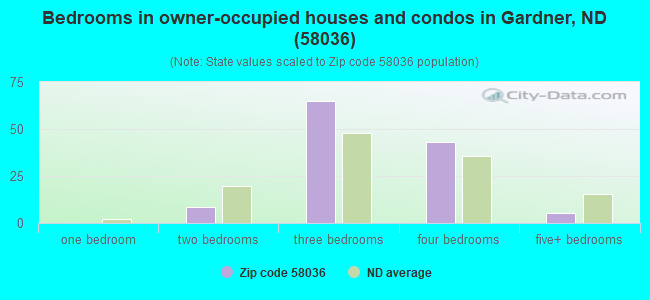
Median number of rooms in houses and condos:
Here:
6.7
State:
7.0
Notable locations in this zip code not listed on our city pages
Size of family households: 46 2-persons, 25 3-persons, 29 4-persons, 8 5-persons
Size of nonfamily households: 6 1-person, 7 2-persons
70 married couples with children.
1 single-parent households (1 women).
79.4% of residents of 58036 zip code speak English at home.
0.3% of residents speak Spanish at home (100% very well).
1.6% of residents speak other Indo-European language at home (100% very well).
23.7% of residents speak Asian or Pacific Island language at home (41% very well, 59% well).
Foreign born population: 62 (18.6%) (45.1% of them are naturalized citizens)
This zip code:
18.6%
Whole state:
4.9%
97%Malaysia
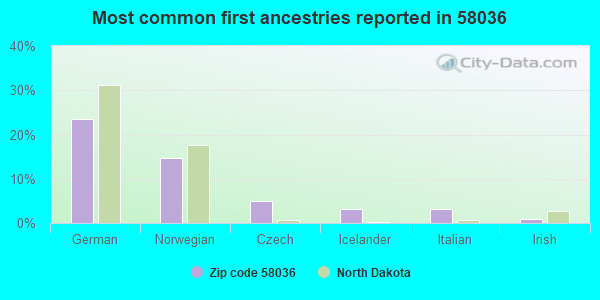
24%German
15%Norwegian
5%Czech
3%Icelander
3%Italian
1%Irish
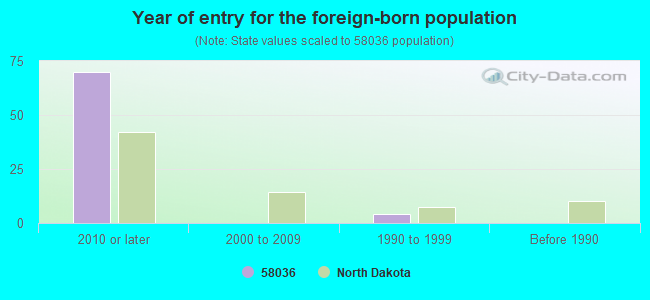
Year of entry for the foreign-born population
702010 or later
02000 to 2009
41990 to 1999
0Before 1990
Facilities with environmental interests located in this zip code:
GARDNER, CITY OF (UNKNOWN ADDRESS in GARDNER, ND)
National Pollutant Discharge Elimination System NON-MAJOR (Tracking pollutant discharge elimination systems) - permit COMMUNITY WATER SYSTEM (SDWIS) - SDWIS-ND0900387 2806, WATER TREATMENT PLANT Business SIC classification: SEWERAGE SYSTEMS
AT&T CORP - GARDNER (4 MI W & 2 MI N in GARDNER, ND)
(Resource Conservation and Recovery Act (tracking hazardous waste)) Organizations: AMERICAN TEL & TEL CO LONG LIN (CONTACT/OWNER)
Housing units lacking complete plumbing facilities: 7.4% Housing units lacking complete kitchen facilities: 3.8%
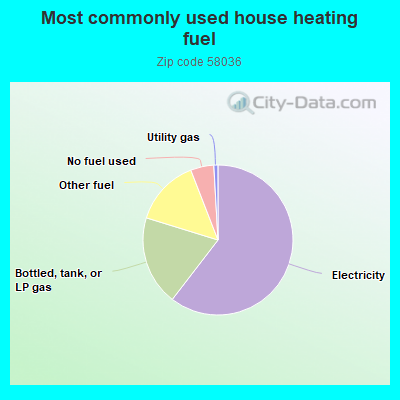
61.6%Electricity
19.7%Bottled, tank, or LP gas
14.6%Other fuel
5.1%No fuel used
0.9%Utility gas
Population in 1990: 200. Population change in the 1990s: +156 (+78.0%).
Place of birth for U.S.-born residents:
This state: 193
Midwest: 78
South: 2
West: 3
81% of the 58036 zip code residents lived in the same house 5 years ago. Out of people who lived in different houses, 70% lived in this county. Out of people who lived in different counties, 50% lived in North Dakota.
102% of the 58036 zip code residents lived in the same house 1 year ago.
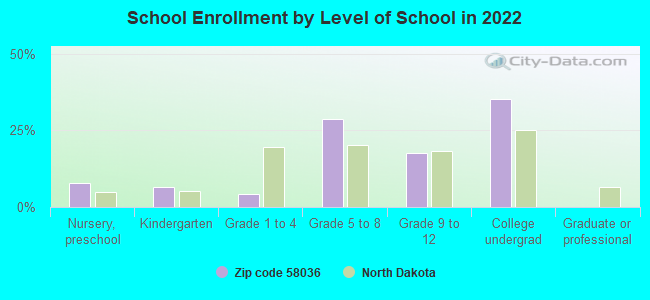
Private vs. public school enrollment:
Students in private schools in grades 1 to 8 (elementary and middle school):
Here:
0.0%
North Dakota:
8.4%
Students in private schools in grades 9 to 12 (high school): 16
Here:
89.5%
North Dakota:
8.2%
Students in private undergraduate colleges:
Here:
0.0%
North Dakota:
14.3%
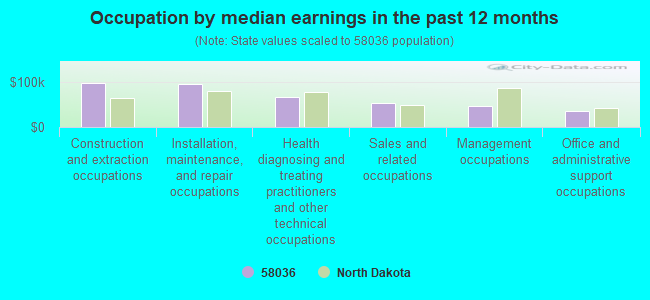
Occupation by median earnings in the past 12 months ($)
97,835Construction and extraction occupations
96,474Installation, maintenance, and repair occupations
67,730Health diagnosing and treating practitioners and other technical occupations
54,093Sales and related occupations
45,825Management occupations
36,583Office and administrative support occupations
Top industries in this zip code by the number of employees in 2005:
Other Services (except Public Administration): Religious Organizations (1-4 employees: 1 establishment)
Professional, Scientific, and Technical Services: Research and Development in the Physical, Engineering, and Life Sciences (1-4: 1)
Construction: Residential Remodelers (1-4: 1)
Accommodation and Food Services: Drinking Places (Alcoholic Beverages) (1-4: 1)
Construction: Commercial and Institutional Building Construction (1-4: 1)
Fatal accident statistics in 2012:
Fatal accident count: 1
Vehicles involved in fatal accidents: 1
Fatal accidents caused by drunken drivers: 0
Fatalities: 1
Persons involved in fatal accidents: 1
Pedestrians involved in fatal accidents: 0
Home Mortgage Disclosure Act Aggregated Statistics For Year 2009 (Based on 2 partial tracts)
A) FHA, FSA/RHS & VA Home Purchase Loans
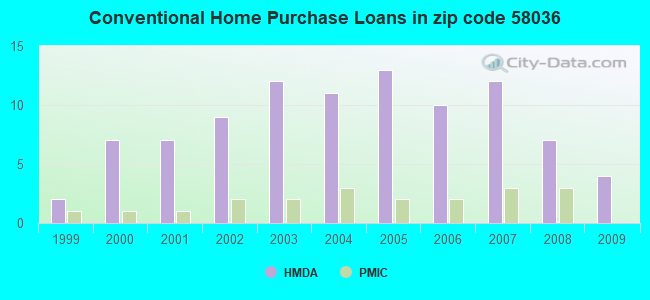
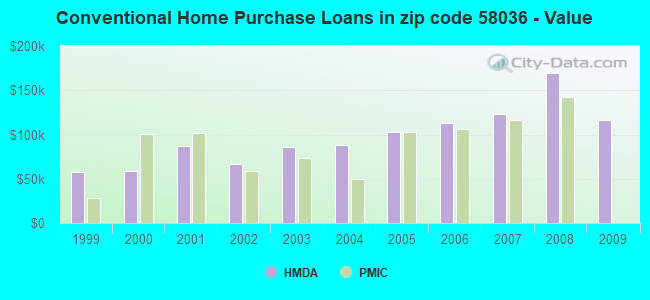
B) Conventional Home Purchase Loans
C) Refinancings
D) Home Improvement Loans
G) Loans On Manufactured Home Dwelling (A B C & D)
Number
Average Value
Number
Average Value
Number
Average Value
Number
Average Value
Number
Average Value
LOANS ORIGINATED
4
$142,030
4
$116,420
25
$130,031
2
$41,445
1
$61,390
APPLICATIONS APPROVED, NOT ACCEPTED
0
$0
1
$107,130
3
$185,073
0
$0
0
$0
APPLICATIONS DENIED
0
$0
0
$0
8
$160,554
0
$0
0
$0
APPLICATIONS WITHDRAWN
1
$167,350
1
$35,970
6
$182,923
1
$108,700
0
$0
FILES CLOSED FOR INCOMPLETENESS
0
$0
0
$0
0
$0
0
$0
0
$0
Aggregated Statistics For Year 2008 (Based on 2 partial tracts)
A) FHA, FSA/RHS & VA Home Purchase Loans
B) Conventional Home Purchase Loans
C) Refinancings
D) Home Improvement Loans
F) Non-occupant Loans on < 5 Family Dwellings (A B C & D)
G) Loans On Manufactured Home Dwelling (A B C & D)
Number
Average Value
Number
Average Value
Number
Average Value
Number
Average Value
Number
Average Value
Number
Average Value
LOANS ORIGINATED
3
$176,603
7
$169,024
22
$106,921
7
$20,779
2
$48,485
2
$119,255
APPLICATIONS APPROVED, NOT ACCEPTED
0
$0
0
$0
6
$108,698
0
$0
0
$0
1
$57,870
APPLICATIONS DENIED
0
$0
1
$45,360
9
$109,567
1
$22,680
0
$0
2
$99,900
APPLICATIONS WITHDRAWN
0
$0
1
$180,640
5
$131,454
1
$27,370
0
$0
0
$0
FILES CLOSED FOR INCOMPLETENESS
0
$0
0
$0
1
$121,600
0
$0
0
$0
0
$0
Aggregated Statistics For Year 2007 (Based on 2 partial tracts)
A) FHA, FSA/RHS & VA Home Purchase Loans
B) Conventional Home Purchase Loans
C) Refinancings
D) Home Improvement Loans
G) Loans On Manufactured Home Dwelling (A B C & D)
Number
Average Value
Number
Average Value
Number
Average Value
Number
Average Value
Number
Average Value
LOANS ORIGINATED
2
$71,555
12
$122,969
18
$116,192
4
$19,160
2
$81,525
APPLICATIONS APPROVED, NOT ACCEPTED
0
$0
0
$0
2
$170,475
1
$22,680
0
$0
APPLICATIONS DENIED
0
$0
2
$63,145
7
$109,424
4
$7,820
1
$25,020
APPLICATIONS WITHDRAWN
0
$0
2
$138,610
3
$115,607
1
$51,220
0
$0
FILES CLOSED FOR INCOMPLETENESS
0
$0
0
$0
1
$84,460
0
$0
0
$0
Aggregated Statistics For Year 2006 (Based on 2 partial tracts)
A) FHA, FSA/RHS & VA Home Purchase Loans
B) Conventional Home Purchase Loans
C) Refinancings
D) Home Improvement Loans
G) Loans On Manufactured Home Dwelling (A B C & D)
Number
Average Value
Number
Average Value
Number
Average Value
Number
Average Value
Number
Average Value
LOANS ORIGINATED
2
$93,255
10
$113,507
18
$86,715
7
$37,369
2
$99,120
APPLICATIONS APPROVED, NOT ACCEPTED
0
$0
0
$0
2
$104,200
0
$0
1
$54,740
APPLICATIONS DENIED
0
$0
3
$64,777
10
$94,309
1
$58,260
1
$86,410
APPLICATIONS WITHDRAWN
0
$0
2
$131,570
5
$113,000
1
$3,520
1
$66,080
FILES CLOSED FOR INCOMPLETENESS
0
$0
0
$0
2
$117,105
0
$0
0
$0
Aggregated Statistics For Year 2005 (Based on 2 partial tracts)
A) FHA, FSA/RHS & VA Home Purchase Loans
B) Conventional Home Purchase Loans
C) Refinancings
D) Home Improvement Loans
F) Non-occupant Loans on < 5 Family Dwellings (A B C & D)
G) Loans On Manufactured Home Dwelling (A B C & D)
Number
Average Value
Number
Average Value
Number
Average Value
Number
Average Value
Number
Average Value
Number
Average Value
LOANS ORIGINATED
3
$92,667
13
$102,562
16
$85,507
6
$29,520
1
$37,150
1
$88,760
APPLICATIONS APPROVED, NOT ACCEPTED
0
$0
3
$87,713
3
$107,003
0
$0
0
$0
1
$68,820
APPLICATIONS DENIED
0
$0
2
$50,440
8
$76,831
2
$47,700
0
$0
1
$47,700
APPLICATIONS WITHDRAWN
0
$0
2
$72,530
4
$100,488
1
$44,970
0
$0
0
$0
FILES CLOSED FOR INCOMPLETENESS
0
$0
0
$0
4
$71,162
0
$0
0
$0
0
$0
Aggregated Statistics For Year 2004 (Based on 2 partial tracts)
A) FHA, FSA/RHS & VA Home Purchase Loans
B) Conventional Home Purchase Loans
C) Refinancings
D) Home Improvement Loans
G) Loans On Manufactured Home Dwelling (A B C & D)
Number
Average Value
Number
Average Value
Number
Average Value
Number
Average Value
Number
Average Value
LOANS ORIGINATED
3
$71,163
11
$88,224
16
$76,318
5
$32,218
3
$63,863
APPLICATIONS APPROVED, NOT ACCEPTED
0
$0
1
$67,250
4
$34,898
1
$25,410
0
$0
APPLICATIONS DENIED
1
$86,800
4
$48,190
4
$63,050
2
$26,785
1
$43,790
APPLICATIONS WITHDRAWN
0
$0
2
$82,695
3
$97,750
0
$0
0
$0
FILES CLOSED FOR INCOMPLETENESS
0
$0
0
$0
3
$129,943
0
$0
0
$0
Aggregated Statistics For Year 2003 (Based on 2 partial tracts)
A) FHA, FSA/RHS & VA Home Purchase Loans
B) Conventional Home Purchase Loans
C) Refinancings
D) Home Improvement Loans
F) Non-occupant Loans on < 5 Family Dwellings (A B C & D)
Number
Average Value
Number
Average Value
Number
Average Value
Number
Average Value
Number
Average Value
LOANS ORIGINATED
4
$84,358
12
$85,498
30
$86,202
4
$13,000
1
$63,730
APPLICATIONS APPROVED, NOT ACCEPTED
0
$0
0
$0
2
$152,295
0
$0
0
$0
APPLICATIONS DENIED
1
$52,000
2
$52,980
9
$59,780
1
$19,550
0
$0
APPLICATIONS WITHDRAWN
0
$0
2
$109,090
3
$63,343
0
$0
0
$0
FILES CLOSED FOR INCOMPLETENESS
0
$0
0
$0
0
$0
0
$0
0
$0
Aggregated Statistics For Year 2002 (Based on 2 partial tracts)
A) FHA, FSA/RHS & VA Home Purchase Loans
B) Conventional Home Purchase Loans
C) Refinancings
D) Home Improvement Loans
Number
Average Value
Number
Average Value
Number
Average Value
Number
Average Value
LOANS ORIGINATED
4
$70,478
9
$67,078
16
$72,921
4
$31,085
APPLICATIONS APPROVED, NOT ACCEPTED
0
$0
0
$0
3
$80,937
0
$0
APPLICATIONS DENIED
0
$0
2
$31,475
7
$59,544
2
$10,950
APPLICATIONS WITHDRAWN
0
$0
1
$101,660
1
$76,250
0
$0
FILES CLOSED FOR INCOMPLETENESS
0
$0
0
$0
0
$0
0
$0
Aggregated Statistics For Year 2001 (Based on 2 partial tracts)
A) FHA, FSA/RHS & VA Home Purchase Loans
B) Conventional Home Purchase Loans
C) Refinancings
D) Home Improvement Loans
Number
Average Value
Number
Average Value
Number
Average Value
Number
Average Value
LOANS ORIGINATED
5
$54,270
7
$86,634
16
$61,314
3
$29,457
APPLICATIONS APPROVED, NOT ACCEPTED
0
$0
1
$44,570
1
$15,640
0
$0
APPLICATIONS DENIED
0
$0
2
$55,720
5
$66,314
1
$27,370
APPLICATIONS WITHDRAWN
0
$0
1
$96,190
4
$62,072
0
$0
FILES CLOSED FOR INCOMPLETENESS
0
$0
1
$26,200
0
$0
1
$33,230
Aggregated Statistics For Year 2000 (Based on 2 partial tracts)
A) FHA, FSA/RHS & VA Home Purchase Loans
B) Conventional Home Purchase Loans
C) Refinancings
D) Home Improvement Loans
F) Non-occupant Loans on < 5 Family Dwellings (A B C & D)
Number
Average Value
Number
Average Value
Number
Average Value
Number
Average Value
Number
Average Value
LOANS ORIGINATED
2
$60,215
7
$58,203
8
$60,459
3
$34,930
1
$16,420
APPLICATIONS APPROVED, NOT ACCEPTED
0
$0
1
$16,810
2
$14,075
0
$0
0
$0
APPLICATIONS DENIED
0
$0
1
$35,190
5
$47,076
1
$20,720
0
$0
APPLICATIONS WITHDRAWN
0
$0
1
$39,100
1
$68,420
0
$0
0
$0
FILES CLOSED FOR INCOMPLETENESS
0
$0
0
$0
0
$0
0
$0
0
$0
Aggregated Statistics For Year 1999 (Based on 1 partial tract)


 Nearest zip codes: 58038, 58005, 58042, 56546, 56550, 56574.