Estimated zip code population in 2022: 30,546 Zip code population in 2010: 28,836 Zip code population in 2000: 30,161
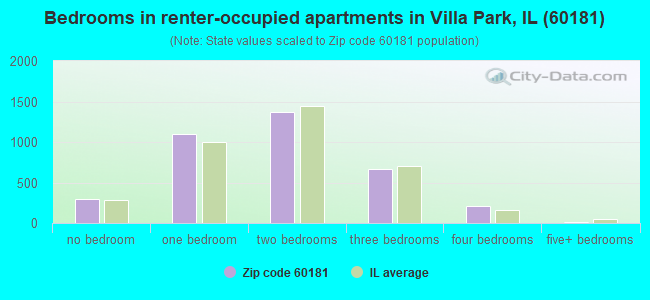
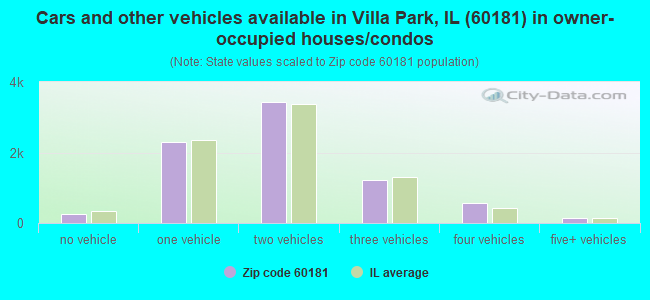
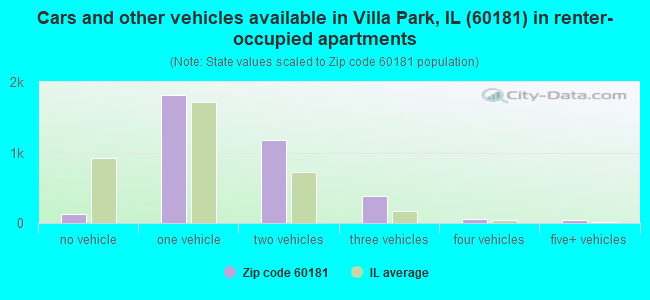
Houses and condos: 12,415 Renter-occupied apartments: 3,653
% of renters here:
32%
State:
33%
March 2022 cost of living index in zip code 60181: 101.7 (near average, U.S. average is 100)
Land area: 6.6 sq. mi. Water area: 0.1 sq. mi.
Population density: 4,625 people per square mile
(average).
OSM Map
General Map
Google Map
MSN Map
OSM Map
General Map
Google Map
MSN Map
OSM Map
General Map
Google Map
MSN Map
OSM Map
General Map
Google Map
MSN Map
Please wait while loading the map...
Real estate property taxes paid for housing units in 2022:
This zip code:
1.9% ($5,709)
Illinois:
2.0% ($4,912)
Median real estate property taxes paid for housing units with mortgages in 2022: $5,569 (1.9%) Median real estate property taxes paid for housing units with no mortgage in 2022: $5,984 (2.0%)
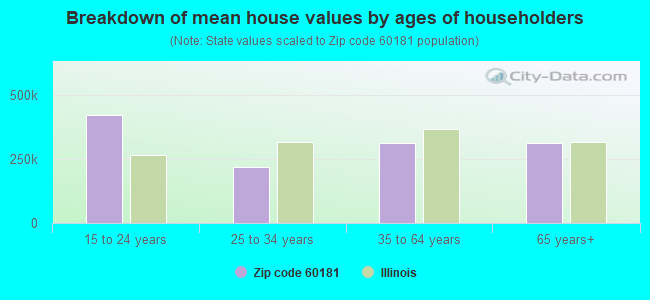
Estimated median house/condo value in 2022: $297,585
60181:
$297,585
Illinois:
$251,600
According to our research of Illinois and other state lists, there were 20 registered sex offenders living in 60181 zip code as of April 27, 2024. The ratio of all residents to sex offenders in zip code 60181 is 1,454 to 1. The ratio of registered sex offenders to all residents in this zip code is lower than the state average.
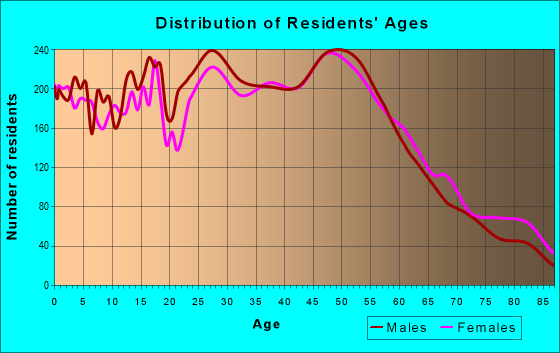
Median resident age:
This zip code:
36.3 years
Illinois median age:
39.1 years
Average household size:
This zip code:
2.6 people
Illinois:
2.4 people
Averages for the 2020 tax year for zip code 60181, filed in 2021:
Average Adjusted Gross Income (AGI) in 2020: $67,773 (Individual Income Tax Returns)
Here:
$67,773
State:
$82,626
Salary/wage: $58,903 (reported on 83.7% of returns)
Here:
$58,903
State:
$66,640
(% of AGI for various income ranges: 1162.9% for AGIs below $25k, 3553.5% for AGIs $25k-50k, 6515.5% for AGIs $50k-75k, 9416.5% for AGIs $75k-100k, 16950.4% for AGIs $100k-200k, 59485.8% for AGIs over 200k)
Taxable interest for individuals: $1,524 (reported on 27.4% of returns)
This zip code:
$1,524
Illinois:
$2,376
(% of AGI for various income ranges: 17.7% for AGIs below $25k, 23.1% for AGIs $25k-50k, 34.9% for AGIs $50k-75k, 39.8% for AGIs $75k-100k, 128.1% for AGIs $100k-200k, 1049.5% for AGIs over 200k)
Ordinary dividends: $5,408 (reported on 20.7% of returns)
Here:
$5,408
State:
$9,061
(% of AGI for various income ranges: 22.8% for AGIs below $25k, 38.4% for AGIs $25k-50k, 80.0% for AGIs $50k-75k, 127.3% for AGIs $75k-100k, 273.4% for AGIs $100k-200k, 4172.6% for AGIs over 200k)
Net capital gain/loss in AGI: +$16,434 (reported on 17.8% of returns)
Here:
+$16,434
State:
+$31,684
(% of AGI for various income ranges: 7.0% for AGIs below $25k, 30.6% for AGIs $25k-50k, 76.7% for AGIs $50k-75k, 138.4% for AGIs $75k-100k, 367.0% for AGIs $100k-200k, 18165.8% for AGIs over 200k)
Profit/loss from business: +$10,242 (reported on 15.6% of returns)
Here:
+$10,242
State:
+$12,175
(% of AGI for various income ranges: 152.7% for AGIs below $25k, 148.1% for AGIs $25k-50k, 160.4% for AGIs $50k-75k, 257.9% for AGIs $75k-100k, 337.9% for AGIs $100k-200k, 2027.9% for AGIs over 200k)
Taxable individual retirement arrangement distribution: $19,866 (reported on 8.7% of returns)
60181:
$19,866
Illinois:
$21,613
(% of AGI for various income ranges: 55.9% for AGIs below $25k, 109.3% for AGIs $25k-50k, 153.9% for AGIs $50k-75k, 282.9% for AGIs $75k-100k, 616.5% for AGIs $100k-200k, 2926.8% for AGIs over 200k)
Self-employed (Keogh) retirement plans: $28,560 (reported on 0.3% of returns)
60181:
$28,560
Illinois:
$30,962
(% of AGI for various income ranges: 15.1% for AGIs $50k-75k, 604.2% for AGIs over 200k)
Total itemized deductions: $28,338 (reported on 9.9% of returns)
Here:
$28,338
State:
$34,948
(% of AGI for various income ranges: 57.7% for AGIs below $25k, 135.3% for AGIs $25k-50k, 361.4% for AGIs $50k-75k, 510.7% for AGIs $75k-100k, 752.9% for AGIs $100k-200k, 6534.7% for AGIs over 200k)
Charity contributions: $6,950 (reported on 7.7% of returns)
Here:
$6,950
State:
$13,122
(% of AGI for various income ranges: 2.2% for AGIs below $25k, 17.1% for AGIs $25k-50k, 48.1% for AGIs $50k-75k, 61.3% for AGIs $75k-100k, 178.9% for AGIs $100k-200k, 1671.6% for AGIs over 200k)
Taxes paid: $8,448 (reported on 9.8% of returns)
60181:
$8,448
State:
$8,563
(% of AGI for various income ranges: 16.8% for AGIs below $25k, 42.0% for AGIs $25k-50k, 133.8% for AGIs $50k-75k, 210.5% for AGIs $75k-100k, 260.3% for AGIs $100k-200k, 978.4% for AGIs over 200k)
Earned income credit: $2,187 (reported on 11.8% of returns)
Here:
$2,187
State:
$2,311
(% of AGI for various income ranges: 75.0% for AGIs below $25k, 52.7% for AGIs $25k-50k, 0.9% for AGIs $50k-75k)
Percentage of individuals using paid preparers for their 2020 taxes: 92.2%
Here:
92%
State:
93%
(% for various income ranges: 90.7% for AGIs below $25k, 92.5% for AGIs $25k-50k, 93.1% for AGIs $50k-75k, 92.6% for AGIs $75k-100k, 92.8% for AGIs $100k-200k, 94.6% for AGIs over 200k)
Averages for the 2012 tax year for zip code 60181, filed in 2013:
Average Adjusted Gross Income (AGI) in 2012: $56,732 (Individual Income Tax Returns)
Here:
$56,732
State:
$68,058
Salary/wage: $48,840 (reported on 85.6% of returns)
Here:
$48,840
State:
$55,396
(% of AGI for various income ranges: 75.3% for AGIs below $25k, 81.7% for AGIs $25k-50k, 82.1% for AGIs $50k-75k, 79.9% for AGIs $75k-100k, 81.0% for AGIs $100k-200k, 40.6% for AGIs over 200k)
Taxable interest for individuals: $1,249 (reported on 34.1% of returns)
This zip code:
$1,249
Illinois:
$1,969
(% of AGI for various income ranges: 1.1% for AGIs below $25k, 0.6% for AGIs $25k-50k, 0.6% for AGIs $50k-75k, 0.5% for AGIs $75k-100k, 0.8% for AGIs $100k-200k, 1.0% for AGIs over 200k)
Ordinary dividends: $3,923 (reported on 20.7% of returns)
Here:
$3,923
State:
$7,786
(% of AGI for various income ranges: 1.4% for AGIs below $25k, 1.1% for AGIs $25k-50k, 1.0% for AGIs $50k-75k, 1.2% for AGIs $75k-100k, 1.2% for AGIs $100k-200k, 2.6% for AGIs over 200k)
Net capital gain/loss in AGI: +$4,623 (reported on 14.4% of returns)
Here:
+$4,623
State:
+$22,183
(% of AGI for various income ranges: 0.2% for AGIs $50k-75k, 0.3% for AGIs $75k-100k, 0.9% for AGIs $100k-200k, 4.9% for AGIs over 200k)
Profit/loss from business: +$11,761 (reported on 13.1% of returns)
Here:
+$11,761
State:
+$12,903
(% of AGI for various income ranges: 9.6% for AGIs below $25k, 2.9% for AGIs $25k-50k, 1.9% for AGIs $50k-75k, 2.3% for AGIs $75k-100k, 1.8% for AGIs $100k-200k, 2.1% for AGIs over 200k)
Taxable individual retirement arrangement distribution: $14,541 (reported on 9.9% of returns)
60181:
$14,541
Illinois:
$17,929
(% of AGI for various income ranges: 3.2% for AGIs below $25k, 2.4% for AGIs $25k-50k, 2.4% for AGIs $50k-75k, 2.7% for AGIs $75k-100k, 2.8% for AGIs $100k-200k, 2.0% for AGIs over 200k)
Self-employment retirement plans: $16,120 (reported on 0.3% of returns)
60181:
$16,120
Illinois:
$24,666
Total itemized deductions: $21,017 (21% of AGI, reported on 38.1% of returns)
Here:
$21,017
State:
$26,433
Here:
21.2% of AGI
State:
19.2% of AGI
(% of AGI for various income ranges: 12.0% for AGIs below $25k, 12.7% for AGIs $25k-50k, 15.6% for AGIs $50k-75k, 16.0% for AGIs $75k-100k, 16.0% for AGIs $100k-200k, 10.2% for AGIs over 200k)
Charity contributions: $2,545 (reported on 31.6% of returns)
Here:
$2,545
State:
$4,525
(% of AGI for various income ranges: 0.7% for AGIs below $25k, 1.1% for AGIs $25k-50k, 1.4% for AGIs $50k-75k, 1.7% for AGIs $75k-100k, 1.7% for AGIs $100k-200k, 1.3% for AGIs over 200k)
Taxes paid: $8,889 (reported on 38.1% of returns)
60181:
$8,889
State:
$11,968
(% of AGI for various income ranges: 3.5% for AGIs below $25k, 4.4% for AGIs $25k-50k, 6.3% for AGIs $50k-75k, 6.7% for AGIs $75k-100k, 7.4% for AGIs $100k-200k, 5.1% for AGIs over 200k)
Earned income credit: $2,238 (reported on 14.5% of returns)
Here:
$2,238
State:
$2,349
(% of AGI for various income ranges: 5.5% for AGIs below $25k, 0.9% for AGIs $25k-50k)
Percentage of individuals using paid preparers for their 2012 taxes: 56.2%
Here:
56%
State:
57%
(% for various income ranges: 53.7% for AGIs below $25k, 57.8% for AGIs $25k-50k, 56.9% for AGIs $50k-75k, 55.0% for AGIs $75k-100k, 59.1% for AGIs $100k-200k, 69.0% for AGIs over 200k)
Averages for the 2004 tax year for zip code 60181, filed in 2005:
Average Adjusted Gross Income (AGI) in 2004: $51,576 (Individual Income Tax Returns)
Here:
$51,576
State:
$54,625
Salary/wage: $44,325 (reported on 86.0% of returns)
Here:
$44,325
State:
$46,811
(% of AGI for various income ranges: 112.3% for AGIs below $10k, 75.3% for AGIs $10k-25k, 82.7% for AGIs $25k-50k, 84.5% for AGIs $50k-75k, 86.5% for AGIs $75k-100k, 56.5% for AGIs over 100k)
Taxable interest for individuals: $1,608 (reported on 52.7% of returns)
This zip code:
$1,608
Illinois:
$2,101
(% of AGI for various income ranges: 6.8% for AGIs below $10k, 2.9% for AGIs $10k-25k, 1.3% for AGIs $25k-50k, 1.2% for AGIs $50k-75k, 1.0% for AGIs $75k-100k, 1.9% for AGIs over 100k)
Taxable dividends: $2,724 (reported on 26.5% of returns)
Here:
$2,724
State:
$4,306
(% of AGI for various income ranges: 3.8% for AGIs below $10k, 1.9% for AGIs $10k-25k, 1.2% for AGIs $25k-50k, 1.1% for AGIs $50k-75k, 0.8% for AGIs $75k-100k, 1.7% for AGIs over 100k)
Net capital gain/loss: +$6,053 (reported on 19.2% of returns)
Here:
+$6,053
State:
+$17,321
(% of AGI for various income ranges: -2.4% for AGIs below $10k, 0.1% for AGIs $10k-25k, 0.4% for AGIs $25k-50k, 0.4% for AGIs $50k-75k, 0.8% for AGIs $75k-100k, 5.4% for AGIs over 100k)
Profit/loss from business: +$10,002 (reported on 12.8% of returns)
Here:
+$10,002
State:
+$11,771
(% of AGI for various income ranges: 8.8% for AGIs below $10k, 6.1% for AGIs $10k-25k, 3.1% for AGIs $25k-50k, 2.1% for AGIs $50k-75k, 1.9% for AGIs $75k-100k, 1.8% for AGIs over 100k)
IRA payment deduction: $3,166 (reported on 2.9% of returns)
60181:
$3,166
Illinois:
$3,087
(% of AGI for various income ranges: 0.4% for AGIs below $10k, 0.3% for AGIs $10k-25k, 0.3% for AGIs $25k-50k, 0.2% for AGIs $50k-75k, 0.1% for AGIs $75k-100k, 0.1% for AGIs over 100k)
Self-employed pension: $9,080 (reported on 0.6% of returns)
Here:
$9,080
Illinois:
$16,965
(% of AGI for various income ranges: 0.1% for AGIs $25k-50k, 0.0% for AGIs $50k-75k, 0.1% for AGIs $75k-100k, 0.2% for AGIs over 100k)
Total itemized deductions: $18,648 (22% of AGI, reported on 42.9% of returns)
Here:
$18,648
State:
$20,239
Here:
22.1% of AGI
State:
19.5% of AGI
(% of AGI for various income ranges: 20.1% for AGIs below $10k, 14.2% for AGIs $10k-25k, 16.1% for AGIs $25k-50k, 17.5% for AGIs $50k-75k, 16.8% for AGIs $75k-100k, 13.6% for AGIs over 100k)
Charity contributions deductions: $2,649 (3% of AGI, reported on 38.3% of returns)
Here:
$2,649
State:
$3,719
Here:
3.4% of AGI
State:
3.4% of AGI
(% of AGI for various income ranges: 1.0% for AGIs below $10k, 1.1% for AGIs $10k-25k, 1.6% for AGIs $25k-50k, 1.9% for AGIs $50k-75k, 2.1% for AGIs $75k-100k, 2.3% for AGIs over 100k)
Total tax: $7,574 (reported on 77.2% of returns)
60181:
$7,574
State:
$9,882
(% of AGI for various income ranges: 3.4% for AGIs below $10k, 4.1% for AGIs $10k-25k, 7.2% for AGIs $25k-50k, 9.0% for AGIs $50k-75k, 10.5% for AGIs $75k-100k, 16.6% for AGIs over 100k)
Earned income credit: $1,697 (reported on 10.1% of returns)
Here:
$1,697
State:
$1,788
Percentage of individuals using paid preparers for their 2004 taxes: 54.5%
Here:
54%
State:
61%
(% for various income ranges: 44.2% for AGIs below $10k, 56.2% for AGIs $10k-25k, 56.1% for AGIs $25k-50k, 57.8% for AGIs $50k-75k, 54.5% for AGIs $75k-100k, 60.5% for AGIs over 100k)
Likely homosexual households (counted as self-reported same-sex unmarried-partner households)
Lesbian couples: 0.1% of all households
Gay men: 0.1% of all households
Household received Food Stamps/SNAP in the past 12 months: 1,362 Household did not receive Food Stamps/SNAP in the past 12 months: 10,181
Women who had a birth in the past 12 months: 469 (331 now married, 136 unmarried) Women who did not have a birth in the past 12 months: 7,151 (3,125 now married, 4,014 unmarried)
Housing units in zip code 60181 with a mortgage: 5,472 (389 second mortgage, 357 both second mortgage and home equity loan) Houses without a mortgage: 225
Median monthly owner costs for units with a mortgage: $1,782 Median monthly owner costs for units without a mortgage: $861
Residents with income below the poverty level in 2022:
This zip code:
6.2%
Whole state:
11.9%
Residents with income below 50% of the poverty level in 2022:
This zip code:
2.0%
Whole state:
5.7%
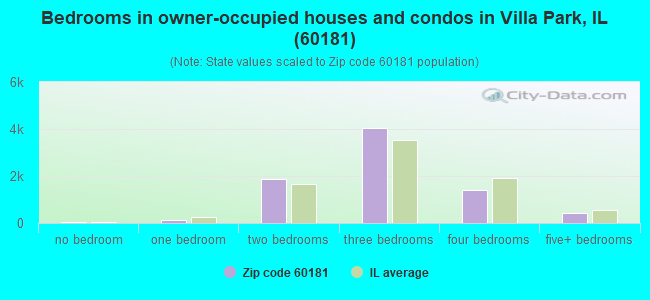
Median number of rooms in houses and condos:
Here:
6.3
State:
6.4
Median number of rooms in apartments:
Here:
3.8
State:
4.1
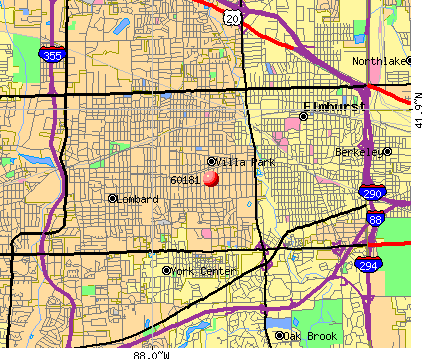
Notable locations in this zip code not listed on our city pages
Notable locations in zip code 60181: Sugar Creek Golf Course (A), Villa Park Village Hall (B), Oakbrook Terrace Village Hall (C), Villa Park Fire Department Station 1 (D), Villa Park Fire Department Station 2 (E), Oakbrook Terrace Fire Protection District (F), Villa Park Fire Department Station 3 (G). Display/hide their locations on the map
Shopping Centers: The Oaks of Oak Brook Shopping Center (1), Villa Oaks Shopping Center (2), Villa DuPage Shopping Center (3), North Park Mall Shopping Center (4), Eastgate Shopping Center (5). Display/hide their locations on the map
Churches in zip code 60181 include: Asbury United Methodist Church (A), Calvary United Methodist Church (B), Christian Church of Villa Park (C), Community Congregational Church (D), Covenant Church of Villa Park (E), First Baptist Church of Villa Park (F), Grace Lutheran Church (G), Harvard Avenue Evangelical Free Church (H), Saint Alexanders Church (I). Display/hide their locations on the map
4,505 married couples with children.
1,116 single-parent households (429 men, 687 women).
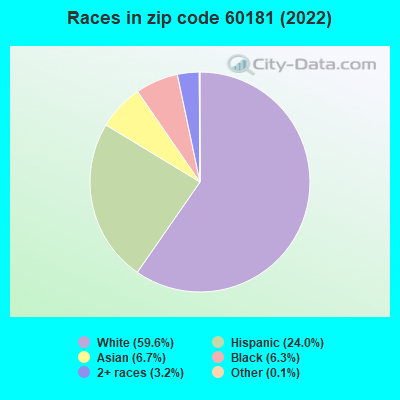
70.0% of residents of 60181 zip code speak English at home.
17.8% of residents speak Spanish at home (65% very well, 17% well, 15% not well, 2% not at all).
8.8% of residents speak other Indo-European language at home (68% very well, 24% well, 7% not well, 2% not at all).
1.8% of residents speak Asian or Pacific Island language at home (73% very well, 25% well, 2% not well).
1.5% of residents speak other language at home (88% very well, 12% well).
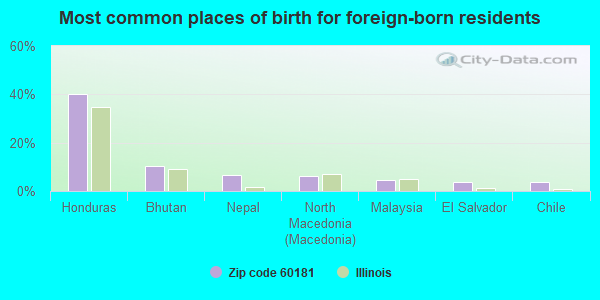
Foreign born population: 5,456 (17.9%) (50.0% of them are naturalized citizens)
Major facilities with environmental interests located in this zip code:
ACCURATE CIRCUITS INC (1115 N ELLSWORTH in VILLA PARK, IL)
STATE MASTER (Illinois EPA Project) - SOLID WASTE PROGRAM, HAZARDOUS WASTE PROGRAM National Pollutant Discharge Elimination System NON-MAJOR (Tracking pollutant discharge elimination systems) - permit HAZARDOUS WASTE BIENNIAL REPORTER (Resource Conservation and Recovery Act (tracking hazardous waste)) - ICIS-, ENFORCEMENT/COMPLIANCE ACTIVITY Large Quantity Generators, more that 1000 kg of hazardous waste/month (Resource Conservation and Recovery Act (tracking hazardous waste)) - ICIS-, ENFORCEMENT/COMPLIANCE ACTIVITY Business NAICS classification: BARE PRINTED CIRCUIT BOARD MANUFACTURING. Alternative names: ACCURATE CIRCUIT CORP.
JEFFERSON MIDDLE SCHOOL (255 W VERMONT in VILLA PARK, IL)
STATE MASTER (Illinois EPA Project) - AIR PROGRAM AIR MINOR (AIRS/AFS) (National Center for Education Statistics) - STATE ID-1902204501007 CRITERIA AND HAZARDOUS AIR POLLUTANT INVENTORY (Inventory of air pollution sources) Large Quantity Generators, more that 1000 kg of hazardous waste/month (Resource Conservation and Recovery Act (tracking hazardous waste)) - notification Business SIC and NAICS classification: ELEMENTARY AND SECONDARY SCHOOLS Organizations: VILLA PARK SCHOOL DIST #45 (CONTACT/OWNER)
, SCH DISTRICT 45 DUPAGE COUNTY (SCHOOL DISTRICT)
Alternative names: JEFFERSON JUNIOR HIGH SCHOOL, VILLA PARK SCHOOL DIST #45
SALT CREEK SANITARY DISTRICT (201 S ROUTE 83 in VILLA PARK, IL)
STATE MASTER (Illinois EPA Project) - SOLID WASTE PROGRAM, National Pollutant Discharge Elimination System Permit STATE MASTER (Illinois EPA Project) - National Pollutant Discharge Elimination System Permit National Pollutant Discharge Elimination System MAJOR (Tracking pollutant discharge elimination systems) - permit National Pollutant Discharge Elimination System NON-MAJOR (Tracking pollutant discharge elimination systems) - permit National Pollutant Discharge Elimination System NON-MAJOR (Tracking pollutant discharge elimination systems) - permit Business SIC classification: SEWERAGE SYSTEMS Alternative names: SALT CREEK SD, SALT CREEK SD STP, SALT CREEK SD-VILLA PARK
JACKSON MIDDLE SCHOOL (301 W JACKSON in VILLA PARK, IL)
STATE MASTER (Illinois EPA Project) - SOLID WASTE PROGRAM, AIR PROGRAM AIR MINOR (AIRS/AFS) COMPLIANCE ACTIVITY (Tracking inspections of insecticide, fungicide, and rodenticide, and toxic substances) (National Center for Education Statistics) - STATE ID-1902204501006 CRITERIA AND HAZARDOUS AIR POLLUTANT INVENTORY (Inventory of air pollution sources) Business SIC and NAICS classification: ELEMENTARY AND SECONDARY SCHOOLS Organizations: SCH DISTRICT 45 DUPAGE COUNTY (SCHOOL DISTRICT)
Alternative names: JACKSON JR HS, JACKSON JUNIOR HIGH SCHOOL
ARDMORE ELEMENTARY SCHOOL (225 S HARVARD in VILLA PARK, IL)
STATE MASTER (Illinois EPA Project) - AIR PROGRAM AIR MINOR (AIRS/AFS) COMPLIANCE ACTIVITY (Tracking inspections of insecticide, fungicide, and rodenticide, and toxic substances) (National Center for Education Statistics) - STATE ID-1902204502001 CRITERIA AND HAZARDOUS AIR POLLUTANT INVENTORY (Inventory of air pollution sources) Business SIC and NAICS classification: ELEMENTARY AND SECONDARY SCHOOLS Organizations: SCH DISTRICT 45 DUPAGE COUNTY (SCHOOL DISTRICT)
Alternative names: ARDMORE ELEM SCH, ARDMORE SCHOOL
NORTH ELEMENTARY SCHOOL (150 W SUNSET in VILLA PARK, IL)
STATE MASTER (Illinois EPA Project) - AIR PROGRAM AIR MINOR (AIRS/AFS) (National Center for Education Statistics) - STATE ID-1902204502010 CRITERIA AND HAZARDOUS AIR POLLUTANT INVENTORY (Inventory of air pollution sources) Business SIC and NAICS classification: ELEMENTARY AND SECONDARY SCHOOLS Organizations: SCH DISTRICT 45 DUPAGE COUNTY (SCHOOL DISTRICT)
Alternative names: NORTH SCHOOL
OAKBROOK TERRACE CITY OF (17W275 BUTTERFIELD RD in OAKBROOK TERRACE, IL)
STATE MASTER (Illinois EPA Project) - SOLID WASTE PROGRAM, HAZARDOUS WASTE PROGRAM STATE MASTER (Illinois EPA Project) - DRINKING WATER PROGRAM Large Quantity Generators, more that 1000 kg of hazardous waste/month (Resource Conservation and Recovery Act (tracking hazardous waste)) - notification Alternative names: OAK BROOK TERRACE
SABERS AUTO SERVICE (523 WEST NORTH AVENUE in VILLA PARK, IL)
STATE MASTER (Illinois EPA Project) - SOLID WASTE PROGRAM, AIR PROGRAM AIR MINOR (AIRS/AFS) (Integrated Compliance Information System) - ICIS-HQ-1999-1171, FORMAL ENFORCEMENT ACTION, ICIS-HQ-1999-1172, Business SIC classification: GASOLINE SERVICE STATIONS; AUTOMOTIVE SERVICES, EXCEPT REPAIR AND CARWASHES; NONCLASSIFIABLE ESTABLISHMENTS Alternative names: SAVERS AUTO SVC INC
PARENT PETROLEUM CO (151 W NORTH AVE in VILLA PARK, IL)
STATE MASTER (Illinois EPA Project) - SOLID WASTE PROGRAM, HAZARDOUS WASTE PROGRAM, AIR PROGRAM AIR MINOR (AIRS/AFS) CRITERIA AND HAZARDOUS AIR POLLUTANT INVENTORY (Inventory of air pollution sources) (Resource Conservation and Recovery Act (tracking hazardous waste)) Business SIC classification: PETROLEUM BULK STATIONS AND TERMINALS Alternative names: WANG ENGINEERING INC
LAIDLAW TRANSIT INCORPORATED (425 NORTH VILLA AVENUE in VILLA PARK, IL)
STATE MASTER (Illinois EPA Project) - National Pollutant Discharge Elimination System Permit, SOLID WASTE PROGRAM National Pollutant Discharge Elimination System NON-MAJOR (Tracking pollutant discharge elimination systems) - permit TRANSPORTER (Resource Conservation and Recovery Act (tracking hazardous waste)) - notification Organizations: VANCOM MANAGEMENT SERVICES, IN (CONTACT/OWNER)
, GUNITE CORP (CONTACT/OWNER)
Alternative names: VANCOM-ILLINOIS, INC., VANCOM TRANSPORTATION IL LP
KRILICH COMPANIES INC (1000 ROYCE BLVD in OAKBROOK TERRACE, IL)
HANDY & HARMAN REFINING GROUP (1179 N ELLSWORTH AVE in VILLA PARK, IL)
STATE MASTER (Illinois EPA Project) - SOLID WASTE PROGRAM, HAZARDOUS WASTE PROGRAM HAZARDOUS WASTE BIENNIAL REPORTER (Resource Conservation and Recovery Act (tracking hazardous waste)) Large Quantity Generators, more that 1000 kg of hazardous waste/month (Resource Conservation and Recovery Act (tracking hazardous waste)) - notification TRI REPORTER (Tracking of toxic chemicals releasing facilities) Business SIC classification: INDUSTRIAL INORGANIC CHEMICALS; SECONDARY SMELTING AND REFINING OF NONFERROUS METALS Organizations: HANDY AND HARMAN REFINING GROUP (CONTACT/OWNER)
Alternative names: AMERICAN CHEMICAL & REFINING CO. INC.
KEPNER PRODUCTS CO (995 N. ELLSWORTH AVE. in VILLA PARK, IL)
STATE MASTER (Illinois EPA Project) - SOLID WASTE PROGRAM, AIR PROGRAM, HAZARDOUS WASTE PROGRAM AIR MINOR (AIRS/AFS) CRITERIA AND HAZARDOUS AIR POLLUTANT INVENTORY (Inventory of air pollution sources) Conditionally Exempt Small Quantity Generators, less than 100 kg/month of hazardous waste (Resource Conservation and Recovery Act (tracking hazardous waste)) - notification Business SIC classification: NONCLASSIFIABLE ESTABLISHMENTS Organizations: KEPNER PRUDUCTS CO (CONTACT/OWNER)
Housing units lacking complete plumbing facilities: 0.1% Housing units lacking complete kitchen facilities: 0.6%
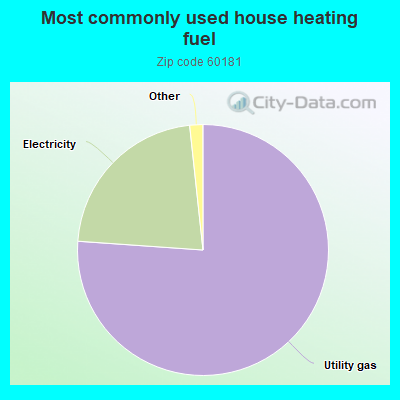
76.2%Utility gas
22.2%Electricity
0.8%Bottled, tank, or LP gas
0.7%No fuel used
Population in 1990: 27,217. Population change in the 1990s: +2,944 (+10.8%).
Place of birth for U.S.-born residents:
This state: 20,531
Northeast: 723
Midwest: 1,635
South: 1,157
West: 616
63% of the 60181 zip code residents lived in the same house 5 years ago. Out of people who lived in different houses, 55% lived in this county. Out of people who lived in different counties, 50% lived in Illinois.
90% of the 60181 zip code residents lived in the same house 1 year ago. Out of people who lived in different houses, 50% moved from this county. Out of people who lived in different houses, 28% moved from different county within same state. Out of people who lived in different houses, 20% moved from different state. Out of people who lived in different houses, 3% moved from abroad.
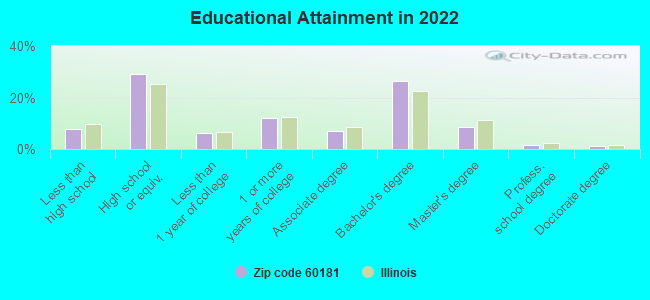
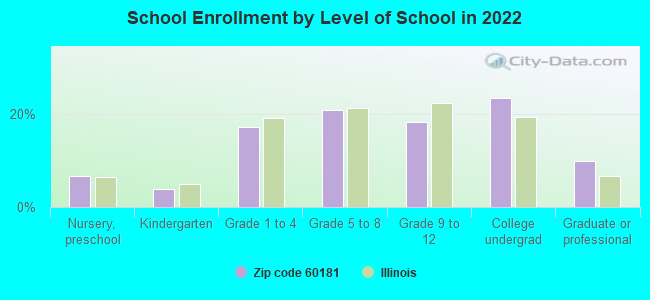
Private vs. public school enrollment:
Students in private schools in grades 1 to 8 (elementary and middle school): 443
Here:
15.7%
Illinois:
13.3%
Students in private schools in grades 9 to 12 (high school): 132
Here:
9.8%
Illinois:
9.9%
Students in private undergraduate colleges: 345
Here:
19.9%
Illinois:
27.4%
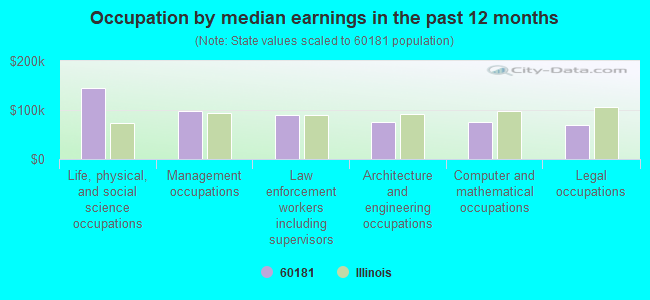
Occupation by median earnings in the past 12 months ($)
145,682Life, physical, and social science occupations
97,775Management occupations
89,452Law enforcement workers including supervisors
76,410Architecture and engineering occupations
75,102Computer and mathematical occupations
69,091Legal occupations
Companies with biggest federal contracts located in this zip code:
TERRACE OAKS ASSOCIATES, LLC (17 W 635 BUTTERFIELD RD S in VILLA PARK, IL) : $515,496 in 44 contractsfrom 2002 to 2006
Contracts for Lease or Rental of Facilities -- Office Buildings by Public Buildings Service Signed by year:2000: $0; 2001: $0; 2002: $2; 2003: $210,280; 2004: $35,154; 2005: $152,490; 2006: $117,570.
Biggest contracts:
$35,047 with Public Buildings Service for Lease or Rental of Facilities -- Office Buildings. Signed on 2003-06-15. Completion date: 2003-06-15.
$35,047, same as above.Signed on 2003-09-15. Completion date: 2003-09-15.
$11,757, same as above.Signed on 2005-10-01. Completion date: 2006-09-30.
$11,757, same as above.Signed on 2006-04-01. Completion date: 2006-09-30.
COMMEG SYSTEMS, INC (141 W HOME AVE in VILLA PARK, IL; small business)
$353,844 with Navy for Office Information System Equipment. Signed on 2005-01-12. Completion date: 2006-01-11.
LEEMIS MARKETING CONSULTANTS, (1 S. 270 SUMMIT AVE in OAKBROOK TERRA, IL)
$72,960 with Department of Defense for Other Administrative Support Services. Signed on 1999-11-23. Completion date: 2001-02-28.
OAKBROOK ENTERPRISES LLC (17W445 ROOSEVELT RD in VILLA PARK, IL; small business) : $49,915 in 21 contractsfrom 2004 to 2006
Contracts for Lodging - Hotel/Motel by Army Signed by year:2000: $0; 2001: $0; 2002: $0; 2003: $0; 2004: $30,203; 2005: $12,565; 2006: $7,147.
Biggest contracts:
$17,045 with Army for Lodging - Hotel/Motel. Signed on 2004-01-23. Completion date: 2004-01-25.
$13,158, same as above.Signed on 2004-01-28. Completion date: 2004-02-01.
$5,104, same as above.Signed on 2005-09-09. Completion date: 2005-08-24.
$3,382, same as above.Signed on 2005-07-15. Completion date: 2005-07-17.
VARIO CONSTRUCTION COMPANY, IN (207 S VILLA AVE in VILLA PARK, IL; small business) : $49,300 in 2 contractsfrom 2002 to 2006
$26,420 with Army for Maintenance, Repair and Rebuilding of Equipment -- Plumbing, Heating, and Waste Disposal Equipment. Signed on 2006-02-09. Completion date: 2006-04-01.
$22,880 with Navy for Maintenance, Repair or Alteration of Real Property -- Miscellaneous Buildings. Signed on 2002-07-29. Completion date: 2002-08-28.
BASIC TRAUMA LIFE SUPPORT INTE (1 S 280 SUMMIT AVE CT B 2 in VILLA PARK, IL)
$34,000 with Department of Veterans Affairs for Educational Services. Signed on 2002-07-15. Completion date: 2003-09-15.
EMERGENCY MEDICINE RISK MANAGE (1 S 450 SUMMIT AVE STE 320 in VILLA PARK, IL; small business)
$24,500 with Air Force for Other Education and Training Services. Signed on 2005-01-19. Completion date: 2006-02-28.
ELECTRON SYSTEMS SWITCH SPECIA (523 CALDUTO CIRCLE in VILLA PARK, IL; small business)
$3,888 with Navy for Miscellaneous Items. Signed on 2002-11-04. Completion date: 2007-12-31.
NIKRO INDUSTRIES INC (638 N IOWA AVE in VILLA PARK, IL; small business)
$3,195 with Army for Air Purification Equipment. Signed on 2005-12-19. Completion date: 2006-01-06.
INFORMATION SOLUTIONS OF AMERI (ONE TOWER LANE in OAKBROOK TERRA, IL) : $1,900 in 2 contractsin 2003
$1,900 with Army for ADP System Acquisition Support Services. Includes preparation of statement of work, benchmarks, specifications, etc.. Taking place in TX. Signed on 2003-04-23. Completion date: 2004-04-30.
$0, same as above.Signed on 2003-04-23. Completion date: 2004-04-30.
Top industries in this zip code by the number of employees in 2005:
Administrative and Support and Waste Management and Remediation Services: Temporary Help Services (500-999 employees: 2 establishments, 250-499 employees: 2 establishments, 100-249 employees: 5 establishments, 50-99 employees: 1 establishment, 20-49 employees: 1 establishment, 10-19 employees: 1 establishment, 5-9 employees: 2 establishments, 1-4 employees: 4 establishments)
Management of Companies and Enterprises: Corporate, Subsidiary, and Regional Managing Offices (over 1000: 1, 250-499: 1, 100-249: 2, 20-49: 1, 10-19: 6, 5-9: 6, 1-4: 9)
2002 - 2018 National Fire Incident Reporting System (NFIRS) incidents
According to the data from the years 2002 - 2018 the average number of fires per year is 123. The highest number of fires - 152 took place in 2004, and the least - 85 in 2016. The data has a decreasing trend.
When looking into fire subcategories, the most reports belonged to: Structure Fires (60.5%), and Outside Fires (25.1%).
Fire incident types reported to NFIRS in Zip Code 60181


 Nearest zip codes: 60126, 60148, 60523, 60101, 60163, 60162.
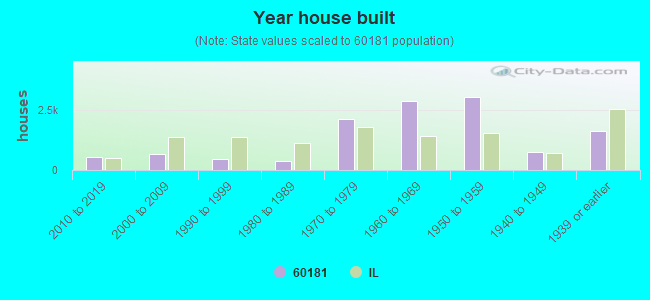


 According to the data from the years 2002 - 2018 the average number of fires per year is 123. The highest number of fires - 152 took place in 2004, and the least - 85 in 2016. The data has a decreasing trend.
 When looking into fire subcategories, the most reports belonged to: Structure Fires (60.5%), and Outside Fires (25.1%).