Estimated zip code population in 2022: 9,242 Zip code population in 2010: 9,397 Zip code population in 2000: 7,288
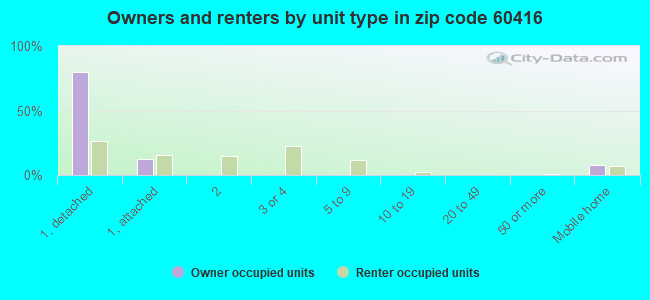
Houses and condos: 3,963 Renter-occupied apartments: 844
% of renters here:
22%
State:
33%
March 2022 cost of living index in zip code 60416: 99.6 (near average, U.S. average is 100)
Land area: 22.3 sq. mi. Water area: 1.0 sq. mi.
Population density: 414 people per square mile
(low).
OSM Map
General Map
Google Map
MSN Map
OSM Map
General Map
Google Map
MSN Map
OSM Map
General Map
Google Map
MSN Map
OSM Map
General Map
Google Map
MSN Map
Please wait while loading the map...
Real estate property taxes paid for housing units in 2022:
This zip code:
1.7% ($3,977)
Illinois:
2.0% ($4,912)
Median real estate property taxes paid for housing units with mortgages in 2022: $4,176 (1.7%) Median real estate property taxes paid for housing units with no mortgage in 2022: $3,730 (1.7%)
Business Search- 14 Million verified businesses
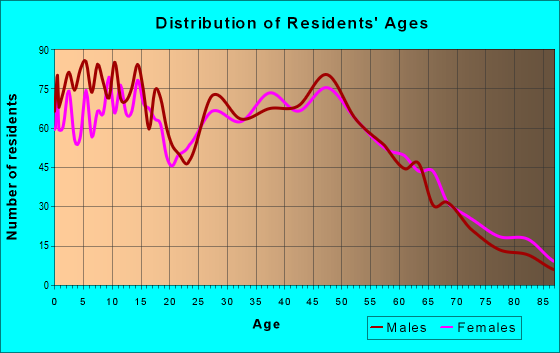
Males: 4,665
(50.5%)
Females: 4,577
(49.5%)
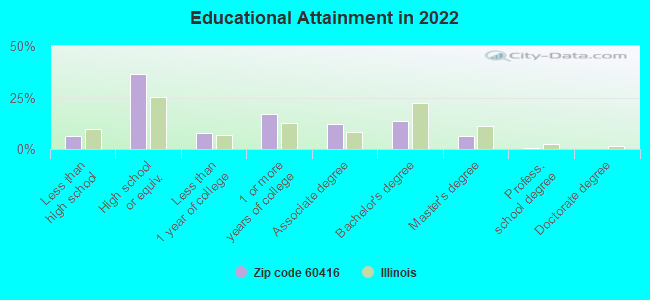
For population 25 years and over in 60416:
High school or higher: 92.7%
Bachelor's degree or higher: 20.0%
Graduate or professional degree: 6.7%
Unemployed: 2.4%
Mean travel time to work (commute): 27.7 minutes
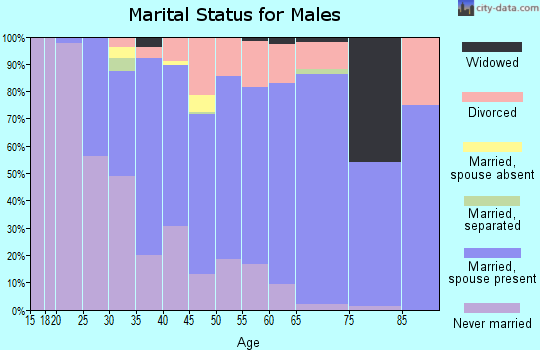
For population 15 years and over in 60416:
Never married: 28.1%
Now married: 49.5%
Separated: 1.0%
Widowed: 6.8%
Divorced: 14.6%
Zip code 60416 compared to state average:
Unemployed percentage below state average.
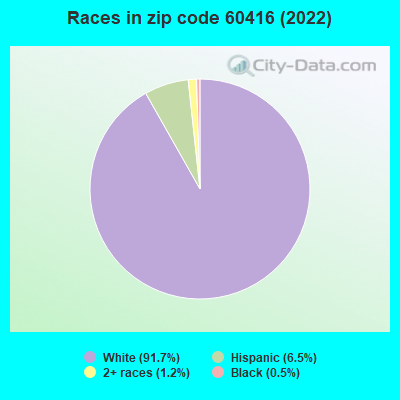
Black race population percentage significantly below state average.
Hispanic race population percentage below state average.
Foreign-born population percentage significantly below state average.
House age below state average.
Percentage of population with a bachelor's degree or higher below state average.
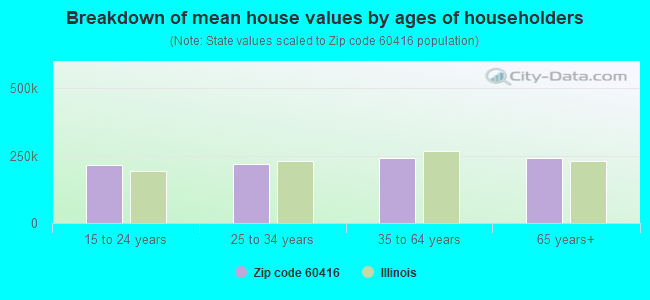
Estimated median house/condo value in 2022: $231,291
60416:
$231,291
Illinois:
$251,600
According to our research of Illinois and other state lists, there were 10 registered sex offenders living in 60416 zip code as of April 27, 2024. The ratio of all residents to sex offenders in zip code 60416 is 927 to 1. The ratio of registered sex offenders to all residents in this zip code is near the state average.
Median resident age:
This zip code:
40.8 years
Illinois median age:
39.1 years
Average household size:
This zip code:
2.4 people
Illinois:
2.4 people
Averages for the 2020 tax year for zip code 60416, filed in 2021:
Average Adjusted Gross Income (AGI) in 2020: $69,703 (Individual Income Tax Returns)
Here:
$69,703
State:
$82,626
Salary/wage: $59,339 (reported on 83.6% of returns)
Here:
$59,339
State:
$66,640
(% of AGI for various income ranges: 1082.0% for AGIs below $25k, 3192.3% for AGIs $25k-50k, 5485.0% for AGIs $50k-75k, 8065.0% for AGIs $75k-100k, 14833.4% for AGIs $100k-200k, 39528.6% for AGIs over 200k)
Taxable interest for individuals: $1,105 (reported on 26.7% of returns)
This zip code:
$1,105
Illinois:
$2,376
(% of AGI for various income ranges: 11.3% for AGIs below $25k, 19.0% for AGIs $25k-50k, 43.0% for AGIs $50k-75k, 45.0% for AGIs $75k-100k, 63.2% for AGIs $100k-200k, 351.4% for AGIs over 200k)
Ordinary dividends: $3,710 (reported on 21.0% of returns)
Here:
$3,710
State:
$9,061
(% of AGI for various income ranges: 24.6% for AGIs below $25k, 26.8% for AGIs $25k-50k, 101.1% for AGIs $50k-75k, 92.4% for AGIs $75k-100k, 195.1% for AGIs $100k-200k, 1274.3% for AGIs over 200k)
Net capital gain/loss in AGI: +$9,234 (reported on 16.8% of returns)
Here:
+$9,234
State:
+$31,684
(% of AGI for various income ranges: 4.7% for AGIs below $25k, 20.6% for AGIs $25k-50k, 63.7% for AGIs $50k-75k, 106.2% for AGIs $75k-100k, 218.0% for AGIs $100k-200k, 6871.4% for AGIs over 200k)
Profit/loss from business: +$8,245 (reported on 9.2% of returns)
Here:
+$8,245
State:
+$12,175
(% of AGI for various income ranges: 36.7% for AGIs below $25k, 54.3% for AGIs $25k-50k, 117.0% for AGIs $50k-75k, 176.7% for AGIs $75k-100k, 196.1% for AGIs $100k-200k)
Taxable individual retirement arrangement distribution: $22,281 (reported on 10.1% of returns)
60416:
$22,281
Illinois:
$21,613
(% of AGI for various income ranges: 55.9% for AGIs below $25k, 122.8% for AGIs $25k-50k, 203.9% for AGIs $50k-75k, 391.9% for AGIs $75k-100k, 565.6% for AGIs $100k-200k, 3234.3% for AGIs over 200k)
Total itemized deductions: $24,347 (reported on 6.3% of returns)
Here:
$24,347
State:
$34,948
(% of AGI for various income ranges: 109.3% for AGIs $25k-50k, 178.2% for AGIs $50k-75k, 246.9% for AGIs $75k-100k, 439.3% for AGIs $100k-200k, 1712.9% for AGIs over 200k)
Charity contributions: $5,205 (reported on 4.2% of returns)
Here:
$5,205
State:
$13,122
(% of AGI for various income ranges: 10.2% for AGIs $25k-50k, 7.1% for AGIs $50k-75k, 15.5% for AGIs $75k-100k, 77.0% for AGIs $100k-200k, 428.6% for AGIs over 200k)
Taxes paid: $7,850 (reported on 6.3% of returns)
60416:
$7,850
State:
$8,563
(% of AGI for various income ranges: 26.2% for AGIs $25k-50k, 47.9% for AGIs $50k-75k, 95.7% for AGIs $75k-100k, 153.4% for AGIs $100k-200k, 525.7% for AGIs over 200k)
Earned income credit: $2,109 (reported on 12.0% of returns)
Here:
$2,109
State:
$2,311
(% of AGI for various income ranges: 67.3% for AGIs below $25k, 60.8% for AGIs $25k-50k)
Percentage of individuals using paid preparers for their 2020 taxes: 95.0%
Here:
95%
State:
93%
(% for various income ranges: 92.5% for AGIs below $25k, 94.2% for AGIs $25k-50k, 97.1% for AGIs $50k-75k, 96.3% for AGIs $75k-100k, 96.9% for AGIs $100k-200k, 94.1% for AGIs over 200k)
Averages for the 2012 tax year for zip code 60416, filed in 2013:
Average Adjusted Gross Income (AGI) in 2012: $58,924 (Individual Income Tax Returns)
Here:
$58,924
State:
$68,058
Salary/wage: $53,843 (reported on 85.2% of returns)
Here:
$53,843
State:
$55,396
(% of AGI for various income ranges: 70.5% for AGIs below $25k, 75.1% for AGIs $25k-50k, 78.2% for AGIs $50k-75k, 81.6% for AGIs $75k-100k, 82.8% for AGIs $100k-200k, 56.1% for AGIs over 200k)
Taxable interest for individuals: $770 (reported on 34.8% of returns)
This zip code:
$770
Illinois:
$1,969
(% of AGI for various income ranges: 1.3% for AGIs below $25k, 0.7% for AGIs $25k-50k, 0.5% for AGIs $50k-75k, 0.3% for AGIs $75k-100k, 0.3% for AGIs $100k-200k, 0.5% for AGIs over 200k)
Ordinary dividends: $2,430 (reported on 22.7% of returns)
Here:
$2,430
State:
$7,786
(% of AGI for various income ranges: 1.9% for AGIs below $25k, 1.0% for AGIs $25k-50k, 1.2% for AGIs $50k-75k, 0.5% for AGIs $75k-100k, 0.9% for AGIs $100k-200k, 0.8% for AGIs over 200k)
Net capital gain/loss in AGI: +$1,511 (reported on 12.8% of returns)
Here:
+$1,511
State:
+$22,183
(% of AGI for various income ranges: 0.3% for AGIs $50k-75k, 0.5% for AGIs $100k-200k, 1.0% for AGIs over 200k)
Profit/loss from business: +$8,948 (reported on 9.9% of returns)
Here:
+$8,948
State:
+$12,903
(% of AGI for various income ranges: 3.8% for AGIs below $25k, 1.6% for AGIs $25k-50k, 0.9% for AGIs $50k-75k, 0.8% for AGIs $75k-100k, 2.0% for AGIs $100k-200k)
Taxable individual retirement arrangement distribution: $12,323 (reported on 10.8% of returns)
60416:
$12,323
Illinois:
$17,929
(% of AGI for various income ranges: 3.1% for AGIs below $25k, 3.6% for AGIs $25k-50k, 2.2% for AGIs $50k-75k, 2.4% for AGIs $75k-100k, 2.1% for AGIs $100k-200k)
Total itemized deductions: $19,204 (20% of AGI, reported on 38.0% of returns)
Here:
$19,204
State:
$26,433
Here:
19.8% of AGI
State:
19.2% of AGI
(% of AGI for various income ranges: 9.4% for AGIs below $25k, 9.3% for AGIs $25k-50k, 12.4% for AGIs $50k-75k, 13.7% for AGIs $75k-100k, 13.7% for AGIs $100k-200k, 10.3% for AGIs over 200k)
Charity contributions: $1,960 (reported on 29.4% of returns)
Here:
$1,960
State:
$4,525
(% of AGI for various income ranges: 0.5% for AGIs below $25k, 0.5% for AGIs $25k-50k, 0.9% for AGIs $50k-75k, 1.0% for AGIs $75k-100k, 1.3% for AGIs $100k-200k, 0.9% for AGIs over 200k)
Taxes paid: $7,800 (reported on 38.0% of returns)
60416:
$7,800
State:
$11,968
(% of AGI for various income ranges: 2.3% for AGIs below $25k, 3.1% for AGIs $25k-50k, 4.4% for AGIs $50k-75k, 5.5% for AGIs $75k-100k, 6.2% for AGIs $100k-200k, 5.3% for AGIs over 200k)
Earned income credit: $1,990 (reported on 13.0% of returns)
Here:
$1,990
State:
$2,349
(% of AGI for various income ranges: 5.0% for AGIs below $25k, 0.9% for AGIs $25k-50k)
Percentage of individuals using paid preparers for their 2012 taxes: 61.1%
Here:
61%
State:
57%
(% for various income ranges: 53.7% for AGIs below $25k, 57.1% for AGIs $25k-50k, 64.3% for AGIs $50k-75k, 65.5% for AGIs $75k-100k, 73.7% for AGIs $100k-200k, 66.7% for AGIs over 200k)
Averages for the 2004 tax year for zip code 60416, filed in 2005:
Average Adjusted Gross Income (AGI) in 2004: $48,363 (Individual Income Tax Returns)
Here:
$48,363
State:
$54,625
Salary/wage: $44,057 (reported on 86.0% of returns)
Here:
$44,057
State:
$46,811
(% of AGI for various income ranges: 81.8% for AGIs below $10k, 68.7% for AGIs $10k-25k, 75.4% for AGIs $25k-50k, 84.1% for AGIs $50k-75k, 87.1% for AGIs $75k-100k, 71.1% for AGIs over 100k)
Taxable interest for individuals: $1,267 (reported on 50.2% of returns)
This zip code:
$1,267
Illinois:
$2,101
(% of AGI for various income ranges: 6.3% for AGIs below $10k, 3.2% for AGIs $10k-25k, 1.7% for AGIs $25k-50k, 1.0% for AGIs $50k-75k, 0.7% for AGIs $75k-100k, 1.0% for AGIs over 100k)
Taxable dividends: $1,653 (reported on 26.9% of returns)
Here:
$1,653
State:
$4,306
(% of AGI for various income ranges: 1.8% for AGIs below $10k, 1.4% for AGIs $10k-25k, 1.0% for AGIs $25k-50k, 0.9% for AGIs $50k-75k, 0.7% for AGIs $75k-100k, 0.9% for AGIs over 100k)
Net capital gain/loss: +$8,582 (reported on 18.1% of returns)
Here:
+$8,582
State:
+$17,321
(% of AGI for various income ranges: -1.8% for AGIs below $10k, 0.0% for AGIs $10k-25k, 0.5% for AGIs $25k-50k, 0.1% for AGIs $50k-75k, 1.2% for AGIs $75k-100k, 10.1% for AGIs over 100k)
Profit/loss from business: +$8,479 (reported on 11.2% of returns)
Here:
+$8,479
State:
+$11,771
(% of AGI for various income ranges: 4.8% for AGIs below $10k, 3.2% for AGIs $10k-25k, 2.6% for AGIs $25k-50k, 0.8% for AGIs $50k-75k, 1.2% for AGIs $75k-100k, 2.6% for AGIs over 100k)
IRA payment deduction: $2,824 (reported on 1.8% of returns)
60416:
$2,824
Illinois:
$3,087
(% of AGI for various income ranges: 0.2% for AGIs $10k-25k, 0.2% for AGIs $25k-50k, 0.1% for AGIs $50k-75k, 0.2% for AGIs $75k-100k)
Total itemized deductions: $15,813 (21% of AGI, reported on 37.3% of returns)
Here:
$15,813
State:
$20,239
Here:
20.8% of AGI
State:
19.5% of AGI
(% of AGI for various income ranges: 12.3% for AGIs below $10k, 9.7% for AGIs $10k-25k, 11.0% for AGIs $25k-50k, 13.6% for AGIs $50k-75k, 12.7% for AGIs $75k-100k, 12.0% for AGIs over 100k)
Charity contributions deductions: $1,744 (2% of AGI, reported on 32.6% of returns)
Here:
$1,744
State:
$3,719
Here:
2.2% of AGI
State:
3.4% of AGI
(% of AGI for various income ranges: 0.2% for AGIs below $10k, 0.6% for AGIs $10k-25k, 0.9% for AGIs $25k-50k, 1.2% for AGIs $50k-75k, 1.3% for AGIs $75k-100k, 1.5% for AGIs over 100k)
Total tax: $6,210 (reported on 80.2% of returns)
60416:
$6,210
State:
$9,882
(% of AGI for various income ranges: 2.0% for AGIs below $10k, 4.2% for AGIs $10k-25k, 7.3% for AGIs $25k-50k, 8.7% for AGIs $50k-75k, 10.3% for AGIs $75k-100k, 15.5% for AGIs over 100k)
Earned income credit: $1,619 (reported on 9.7% of returns)
Here:
$1,619
State:
$1,788
Percentage of individuals using paid preparers for their 2004 taxes: 64.9%
Here:
65%
State:
61%
(% for various income ranges: 52.1% for AGIs below $10k, 64.0% for AGIs $10k-25k, 66.1% for AGIs $25k-50k, 66.8% for AGIs $50k-75k, 72.1% for AGIs $75k-100k, 73.3% for AGIs over 100k)
Likely homosexual households (counted as self-reported same-sex unmarried-partner households)
Lesbian couples: 0.3% of all households
Gay men: 0.0% of all households
Household received Food Stamps/SNAP in the past 12 months: 383 Household did not receive Food Stamps/SNAP in the past 12 months: 3,433
Women who had a birth in the past 12 months: 60 (24 now married, 35 unmarried) Women who did not have a birth in the past 12 months: 2,041 (809 now married, 1,232 unmarried)
Housing units in zip code 60416 with a mortgage: 1,676 (156 second mortgage, 35 home equity loan, 100 both second mortgage and home equity loan) Houses without a mortgage: 51
Median monthly owner costs for units with a mortgage: $1,676 Median monthly owner costs for units without a mortgage: $684
Residents with income below the poverty level in 2022:
This zip code:
7.5%
Whole state:
11.9%
Residents with income below 50% of the poverty level in 2022:
This zip code:
4.0%
Whole state:
5.7%
Median number of rooms in houses and condos:
Here:
6.2
State:
6.4
Median number of rooms in apartments:
Here:
4.2
State:
4.1
Notable locations in this zip code not listed on our city pages
Churches in zip code 60416 include: Assumption Catholic Church (A), First Baptist Church (B), New Hope Presbyterian Church (C), Christian Life Church (D). Display/hide their locations on the map
1,380 married couples with children.
668 single-parent households (321 men, 347 women).
96.7% of residents of 60416 zip code speak English at home.
1.9% of residents speak Spanish at home (93% very well, 7% well).
0.6% of residents speak other Indo-European language at home (61% very well, 18% well, 20% not well).
0.3% of residents speak Asian or Pacific Island language at home (100% very well).
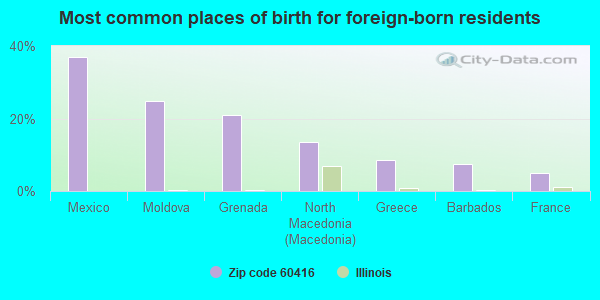
Foreign born population: 81 (0.9%) (100.0% of them are naturalized citizens)
This zip code:
0.9%
Whole state:
14.4%
37%Mexico
25%Moldova
21%Grenada
14%North Macedonia (Macedonia)
9%Greece
7%Barbados
5%France
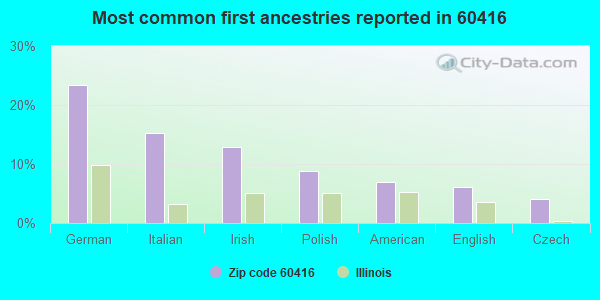
23%German
15%Italian
13%Irish
9%Polish
7%American
6%English
4%Czech
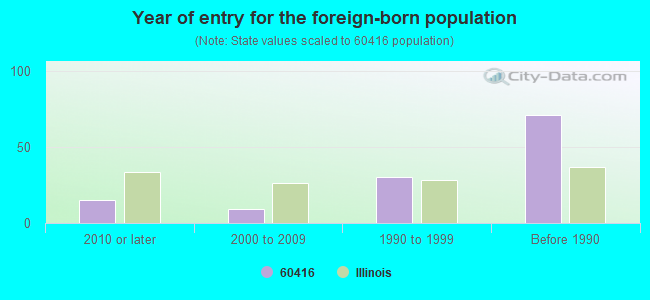
Year of entry for the foreign-born population
152010 or later
92000 to 2009
301990 to 1999
71Before 1990
Major facilities with environmental interests located in this zip code:
DEMERT & DOUGHERTY INC (1300 NORTH STREET in COAL CITY, IL)
STATE MASTER (Illinois EPA Project) - SOLID WASTE PROGRAM, HAZARDOUS WASTE PROGRAM, AIR PROGRAM AIR SYNTHETIC MINOR (AIRS/AFS) ENFORCEMENT/COMPLIANCE ACTIVITY (Integrated Compliance Information System) FORMAL ENFORCEMENT ACTION (Integrated Compliance Information System) COMPLIANCE ACTIVITY (Tracking inspections of insecticide, fungicide, and rodenticide, and toxic substances) CRITERIA AND HAZARDOUS AIR POLLUTANT INVENTORY (Inventory of air pollution sources) HAZARDOUS WASTE BIENNIAL REPORTER (Resource Conservation and Recovery Act (tracking hazardous waste)) Large Quantity Generators, more that 1000 kg of hazardous waste/month (Resource Conservation and Recovery Act (tracking hazardous waste)) - notification TSD (Resource Conservation and Recovery Act (tracking hazardous waste)) - notification TRI REPORTER (Tracking of toxic chemicals releasing facilities) Business SIC classification: PERFUMES, COSMETICS, AND OTHER TOILET PREPARATIONS; BUSINESS SERVICES Business NAICS classification: ALL OTHER MISCELLANEOUS CHEMICAL PRODUCT AND PREPARATION MANUFACTURING. Organizations: CA ACQUISITION LLC (CONTACT/OPERATOR)
Alternative names: CA ACQUISITION LLC, CHICAGO AEROSOL, CHICAGO AEROSOL, LLC
PRAIRIE OAKS ESTS HOMEOWNERS ASSN (PO BOX 125 in COAL CITY, IL)
STATE MASTER (Illinois EPA Project) - DRINKING WATER PROGRAM FORMAL ENFORCEMENT ACTION (Integrated Compliance Information System) - ICIS-05-2005-4815, ENFORCEMENT/COMPLIANCE ACTIVITY
COAL CITY STP (NORTH BROADWAY in COAL CITY, IL)
STATE MASTER (Illinois EPA Project) - National Pollutant Discharge Elimination System Permit National Pollutant Discharge Elimination System NON-MAJOR (Tracking pollutant discharge elimination systems) - permit National Pollutant Discharge Elimination System NON-MAJOR (Tracking pollutant discharge elimination systems) - permit Business SIC classification: SEWERAGE SYSTEMS Alternative names: COAL CITY STP, VILLAGE OF, COAL CITY, VILLAGE OF
NICOR GAS (ROUTE 113 in COAL CITY, IL)
STATE MASTER (Illinois EPA Project) - AIR PROGRAM AIR MINOR (AIRS/AFS) CRITERIA AND HAZARDOUS AIR POLLUTANT INVENTORY (Inventory of air pollution sources) Business SIC classification: NATURAL GAS DISTRIBUTION Alternative names: NORTHERN ILLinois GAS COmpany
COAL CITY READY MIX CO (BOX 116, W CHESTNUT in COAL CITY, IL)
STATE MASTER (Illinois EPA Project) - AIR PROGRAM AIR MINOR (AIRS/AFS) CRITERIA AND HAZARDOUS AIR POLLUTANT INVENTORY (Inventory of air pollution sources) Business SIC classification: READY-MIXED CONCRETE Business NAICS classification: READY-MIX CONCRETE MANUFACTURING.
COAL READY MIX CO (IL ST 1 BLK W MAIN DOWNTOWN in COAL CITY, IL)
STATE MASTER (Illinois EPA Project) - National Pollutant Discharge Elimination System Permit National Pollutant Discharge Elimination System NON-MAJOR (Tracking pollutant discharge elimination systems) - permit Organizations: COAL READY MIX CO. (CONTACT/OWNER)
PRAIRIE OAK ESTATES STP (DRESDEN ROAD AT CARPER ROAD in COAL CITY, IL)
STATE MASTER (Illinois EPA Project) - National Pollutant Discharge Elimination System Permit National Pollutant Discharge Elimination System NON-MAJOR (Tracking pollutant discharge elimination systems) - permit Business SIC classification: SEWERAGE SYSTEMS
DAVES AUTOBODY (2095 E HOUGH ST in COAL CITY, IL)
STATE MASTER (Illinois EPA Project) - HAZARDOUS WASTE PROGRAM Small Quantity Generators, between 100 kg and 1000 kg of hazardous waste/month (Resource Conservation and Recovery Act (tracking hazardous waste)) - notification Organizations: WILCOX DAVE (CONTACT/OWNER)
Alternative names: DAVES AUTO BODY
QUALITY AUTO BODY (97 N FIRST AVE in COAL CITY, IL)
STATE MASTER (Illinois EPA Project) - HAZARDOUS WASTE PROGRAM Small Quantity Generators, between 100 kg and 1000 kg of hazardous waste/month (Resource Conservation and Recovery Act (tracking hazardous waste)) - notification Organizations: SHAIN BILL (CONTACT/OWNER)
D CONSTRUCTION INC (1488 S BROADWAY in COAL CITY, IL)
STATE MASTER (Illinois EPA Project) - SOLID WASTE PROGRAM TRANSPORTER (Resource Conservation and Recovery Act (tracking hazardous waste))
COAL CITY HIGH SCHOOL (655 W DIVISION ST in COAL CITY, IL)
(Geographic Names Information System) (National Center for Education Statistics) - STATE ID-2403200100001 Organizations: COAL CITY C U SCHOOL DISTRICT 1 (SCHOOL DISTRICT)
COAL CITY MIDDLE SCHOOL (500 S CARBON HILL RD in COAL CITY, IL)
(Geographic Names Information System) (National Center for Education Statistics) - STATE ID-2403200101002 Organizations: COAL CITY C U SCHOOL DISTRICT 1 (SCHOOL DISTRICT)
Housing units lacking complete kitchen facilities: 2.2%
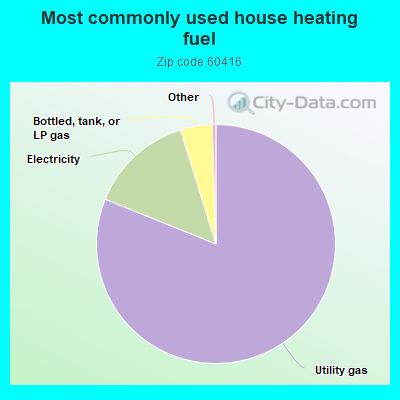
81.2%Utility gas
14.1%Electricity
4.3%Bottled, tank, or LP gas
Population in 1990: 6,248. Population change in the 1990s: +1,040 (+16.6%).
Place of birth for U.S.-born residents:
This state: 8,007
Northeast: 196
Midwest: 466
South: 240
West: 163
58% of the 60416 zip code residents lived in the same house 5 years ago. Out of people who lived in different houses, 46% lived in this county. Out of people who lived in different counties, 50% lived in Illinois.
94% of the 60416 zip code residents lived in the same house 1 year ago. Out of people who lived in different houses, 55% moved from this county. Out of people who lived in different houses, 32% moved from different county within same state. Out of people who lived in different houses, 13% moved from different state.
Private vs. public school enrollment:
Students in private schools in grades 1 to 8 (elementary and middle school): 4
Here:
0.4%
Illinois:
13.3%
Students in private schools in grades 9 to 12 (high school):
Here:
0.2%
Illinois:
9.9%
Students in private undergraduate colleges: 59
Here:
16.8%
Illinois:
27.4%
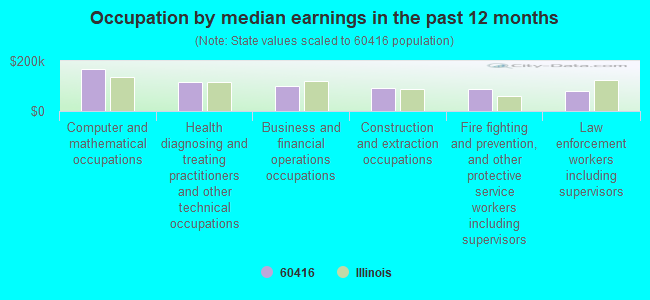
Occupation by median earnings in the past 12 months ($)
167,684Computer and mathematical occupations
114,015Health diagnosing and treating practitioners and other technical occupations
99,858Business and financial operations occupations
93,795Construction and extraction occupations
89,559Fire fighting and prevention, and other protective service workers including supervisors
81,319Law enforcement workers including supervisors
Top industries in this zip code by the number of employees in 2005:
Construction: Highway, Street, and Bridge Construction (100-249 employees: 1 establishment)
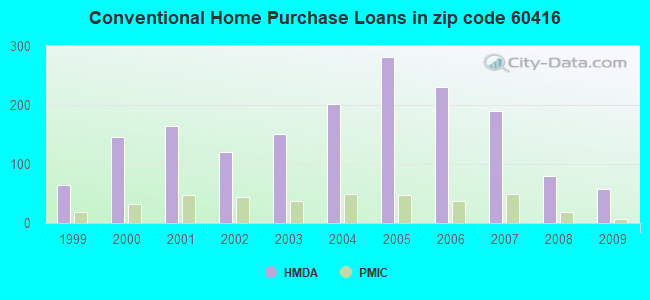
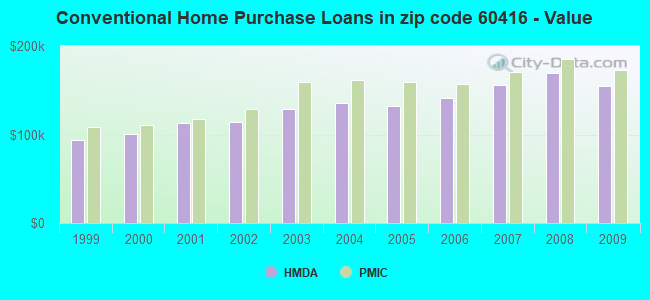
Detailed PMIC statistics for the following Tracts:0007.00
, 0008.00
2002 - 2018 National Fire Incident Reporting System (NFIRS) incidents
Based on the data from the years 2002 - 2018 the average number of fire incidents per year is 49. The highest number of fires - 86 took place in 2014, and the least - 18 in 2018. The data has a decreasing trend.
When looking into fire subcategories, the most incidents belonged to: Structure Fires (54.5%), and Outside Fires (34.3%).
Fire incident types reported to NFIRS in Zip Code 60416


 Nearest zip codes: 60407, 60408, 60474, 60444, 60424, 60410.
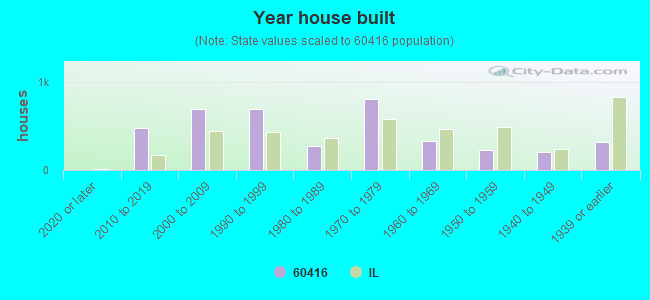


 Based on the data from the years 2002 - 2018 the average number of fire incidents per year is 49. The highest number of fires - 86 took place in 2014, and the least - 18 in 2018. The data has a decreasing trend.
 When looking into fire subcategories, the most incidents belonged to: Structure Fires (54.5%), and Outside Fires (34.3%).