Averages for the 2020 tax year for zip code 71023, filed in 2021:
Average Adjusted Gross Income (AGI) in 2020: $48,242 (Individual Income Tax Returns)
Here:
$48,242
State:
$60,757
Salary/wage: $43,667 (reported on 79.0% of returns)
Here:
$43,667
State:
$50,882
(% of AGI for various income ranges: 1143.0% for AGIs below $25k, 3485.2% for AGIs $25k-50k, 6879.2% for AGIs $50k-75k, 9216.7% for AGIs $75k-100k, 23410.0% for AGIs $100k-200k)
Taxable interest for individuals: $1,035 (reported on 25.9% of returns)
This zip code:
$1,035
Louisiana:
$1,576
(% of AGI for various income ranges: 7.4% for AGIs below $25k, 24.5% for AGIs $25k-50k, 27.7% for AGIs $50k-75k, 41.1% for AGIs $75k-100k, 288.6% for AGIs $100k-200k)
Ordinary dividends: $1,664 (reported on 9.8% of returns)
Here:
$1,664
State:
$7,743
(% of AGI for various income ranges: 8.8% for AGIs below $25k, 4.2% for AGIs $25k-50k, 60.0% for AGIs $50k-75k, 148.6% for AGIs $100k-200k)
Net capital gain/loss in AGI: +$2,577 (reported on 9.1% of returns)
Here:
+$2,577
State:
+$16,917
(% of AGI for various income ranges: 8.1% for AGIs below $25k, 76.9% for AGIs $50k-75k, 285.7% for AGIs $100k-200k)
Profit/loss from business: +$4,614 (reported on 15.4% of returns)
Here:
+$4,614
State:
+$7,679
(% of AGI for various income ranges: 43.0% for AGIs below $25k, 34.5% for AGIs $25k-50k, 312.3% for AGIs $50k-75k, 452.9% for AGIs $100k-200k)
Taxable individual retirement arrangement distribution: $20,689 (reported on 6.3% of returns)
71023:
$20,689
Louisiana:
$20,716
(% of AGI for various income ranges: 51.4% for AGIs below $25k, 115.2% for AGIs $25k-50k, 1426.7% for AGIs $75k-100k)
Total itemized deductions: $38,425 (reported on 2.8% of returns)
Here:
$38,425
State:
$36,265
(% of AGI for various income ranges: 2195.7% for AGIs $100k-200k)
Charity contributions: $21,333 (reported on 2.1% of returns)
Here:
$21,333
State:
$13,106
(% of AGI for various income ranges: 711.1% for AGIs $75k-100k)
Taxes paid: $5,375 (reported on 2.8% of returns)
71023:
$5,375
State:
$6,643
(% of AGI for various income ranges: 307.1% for AGIs $100k-200k)
Earned income credit: $2,485 (reported on 23.1% of returns)
Here:
$2,485
State:
$2,671
(% of AGI for various income ranges: 118.4% for AGIs below $25k, 100.3% for AGIs $25k-50k)
Percentage of individuals using paid preparers for their 2020 taxes: 93.0%
Here:
93%
State:
92%
(% for various income ranges: 91.2% for AGIs below $25k, 94.9% for AGIs $25k-50k, 94.7% for AGIs $50k-75k, 92.3% for AGIs $75k-100k, 107.7% for AGIs $100k-200k, 0.0% for AGIs over 200k)
Averages for the 2012 tax year for zip code 71023, filed in 2013:
Average Adjusted Gross Income (AGI) in 2012: $45,036 (Individual Income Tax Returns)
Here:
$45,036
State:
$56,730
Salary/wage: $39,624 (reported on 84.1% of returns)
Here:
$39,624
State:
$45,545
(% of AGI for various income ranges: 74.5% for AGIs below $25k, 80.9% for AGIs $25k-50k, 83.8% for AGIs $50k-75k, 77.0% for AGIs $75k-100k, 62.5% for AGIs $100k-200k)
Taxable interest for individuals: $782 (reported on 25.2% of returns)
This zip code:
$782
Louisiana:
$1,804
(% of AGI for various income ranges: 1.1% for AGIs below $25k, 0.5% for AGIs $25k-50k, 0.3% for AGIs $50k-75k, 0.2% for AGIs $75k-100k, 0.3% for AGIs $100k-200k)
Ordinary dividends: $1,343 (reported on 9.3% of returns)
Here:
$1,343
State:
$7,610
(% of AGI for various income ranges: 0.5% for AGIs below $25k, 0.1% for AGIs $25k-50k, 0.4% for AGIs $50k-75k, 0.2% for AGIs $75k-100k, 0.3% for AGIs $100k-200k)
Net capital gain/loss in AGI: +$2,900 (reported on 7.3% of returns)
Here:
+$2,900
State:
+$17,096
(% of AGI for various income ranges: 0.4% for AGIs $50k-75k, 1.2% for AGIs $100k-200k)
Profit/loss from business: +$6,964 (reported on 16.6% of returns)
Here:
+$6,964
State:
+$12,088
(% of AGI for various income ranges: 5.8% for AGIs below $25k, 2.2% for AGIs $25k-50k, 1.0% for AGIs $50k-75k, 2.6% for AGIs $75k-100k, 2.4% for AGIs $100k-200k)
Taxable individual retirement arrangement distribution: $10,256 (reported on 6.0% of returns)
71023:
$10,256
Louisiana:
$16,085
(% of AGI for various income ranges: 1.5% for AGIs below $25k, 1.9% for AGIs $25k-50k, 4.9% for AGIs $75k-100k)
Total itemized deductions: $21,534 (23% of AGI, reported on 19.2% of returns)
Here:
$21,534
State:
$23,585
Here:
22.6% of AGI
State:
18.1% of AGI
(% of AGI for various income ranges: 5.2% for AGIs below $25k, 7.0% for AGIs $25k-50k, 9.9% for AGIs $50k-75k, 10.7% for AGIs $75k-100k, 11.0% for AGIs $100k-200k)
Charity contributions: $7,014 (reported on 14.6% of returns)
Here:
$7,014
State:
$5,533
(% of AGI for various income ranges: 2.0% for AGIs $25k-50k, 2.1% for AGIs $50k-75k, 3.0% for AGIs $75k-100k, 3.1% for AGIs $100k-200k)
Taxes paid: $3,621 (reported on 19.2% of returns)
71023:
$3,621
State:
$6,282
(% of AGI for various income ranges: 0.4% for AGIs below $25k, 0.6% for AGIs $25k-50k, 1.4% for AGIs $50k-75k, 1.5% for AGIs $75k-100k, 2.7% for AGIs $100k-200k)
Earned income credit: $2,364 (reported on 25.8% of returns)
Here:
$2,364
State:
$2,633
(% of AGI for various income ranges: 8.6% for AGIs below $25k, 1.2% for AGIs $25k-50k)
Percentage of individuals using paid preparers for their 2012 taxes: 53.0%
Here:
53%
State:
57%
(% for various income ranges: 46.3% for AGIs below $25k, 52.6% for AGIs $25k-50k, 60.0% for AGIs $50k-75k, 61.5% for AGIs $75k-100k, 69.2% for AGIs $100k-200k)
Averages for the 2004 tax year for zip code 71023, filed in 2005:
Average Adjusted Gross Income (AGI) in 2004: $35,385 (Individual Income Tax Returns)
Here:
$35,385
State:
$39,411
Salary/wage: $32,519 (reported on 86.1% of returns)
Here:
$32,519
State:
$34,434
(% of AGI for various income ranges: 112.3% for AGIs below $10k, 76.8% for AGIs $10k-25k, 84.9% for AGIs $25k-50k, 83.1% for AGIs $50k-75k, 81.6% for AGIs $75k-100k, 60.4% for AGIs over 100k)
Taxable interest for individuals: $790 (reported on 31.5% of returns)
This zip code:
$790
Louisiana:
$1,606
(% of AGI for various income ranges: 1.0% for AGIs below $10k, 1.3% for AGIs $10k-25k, 0.4% for AGIs $25k-50k, 1.0% for AGIs $50k-75k, 0.3% for AGIs $75k-100k, 0.5% for AGIs over 100k)
Taxable dividends: $769 (reported on 11.9% of returns)
Here:
$769
State:
$3,235
(% of AGI for various income ranges: 0.2% for AGIs below $10k, 0.2% for AGIs $10k-25k, 0.3% for AGIs $25k-50k, 0.2% for AGIs $50k-75k, 0.4% for AGIs $75k-100k, 0.3% for AGIs over 100k)
Net capital gain/loss: +$4,316 (reported on 7.9% of returns)
Here:
+$4,316
State:
+$8,531
(% of AGI for various income ranges: 1.8% for AGIs below $10k, 0.2% for AGIs $10k-25k, 0.4% for AGIs $25k-50k, 0.8% for AGIs $50k-75k, 3.0% for AGIs $75k-100k, 0.9% for AGIs over 100k)
Profit/loss from business: +$3,117 (reported on 14.7% of returns)
Here:
+$3,117
State:
+$9,128
(% of AGI for various income ranges: 5.7% for AGIs below $10k, 2.9% for AGIs $10k-25k, 0.9% for AGIs $25k-50k, 0.7% for AGIs $50k-75k, 2.1% for AGIs $75k-100k)
IRA payment deduction: $1,727 (reported on 0.8% of returns)
71023:
$1,727
Louisiana:
$3,055
Total itemized deductions: $15,296 (21% of AGI, reported on 15.9% of returns)
Here:
$15,296
State:
$18,222
Here:
20.9% of AGI
State:
20.3% of AGI
(% of AGI for various income ranges: 3.7% for AGIs $10k-25k, 6.0% for AGIs $25k-50k, 6.3% for AGIs $50k-75k, 10.6% for AGIs $75k-100k, 9.6% for AGIs over 100k)
Charity contributions deductions: $4,825 (6% of AGI, reported on 11.4% of returns)
Here:
$4,825
State:
$4,190
Here:
6.0% of AGI
State:
4.4% of AGI
(% of AGI for various income ranges: 0.4% for AGIs $10k-25k, 1.2% for AGIs $25k-50k, 1.6% for AGIs $50k-75k, 2.5% for AGIs $75k-100k, 2.5% for AGIs over 100k)
Total tax: $4,502 (reported on 71.5% of returns)
71023:
$4,502
State:
$6,529
(% of AGI for various income ranges: 2.3% for AGIs below $10k, 3.3% for AGIs $10k-25k, 6.5% for AGIs $25k-50k, 9.3% for AGIs $50k-75k, 10.6% for AGIs $75k-100k, 17.6% for AGIs over 100k)
Earned income credit: $1,882 (reported on 23.9% of returns)
Here:
$1,882
State:
$2,103
Percentage of individuals using paid preparers for their 2004 taxes: 58.2%
Here:
58%
State:
61%
(% for various income ranges: 55.5% for AGIs below $10k, 58.8% for AGIs $10k-25k, 55.9% for AGIs $25k-50k, 59.6% for AGIs $50k-75k, 63.5% for AGIs $75k-100k, 66.1% for AGIs over 100k)
Household received Food Stamps/SNAP in the past 12 months: 254 Household did not receive Food Stamps/SNAP in the past 12 months: 1,036
Women who had a birth in the past 12 months: 4 (0 now married, 4 unmarried) Women who did not have a birth in the past 12 months: 471 (213 now married, 256 unmarried)
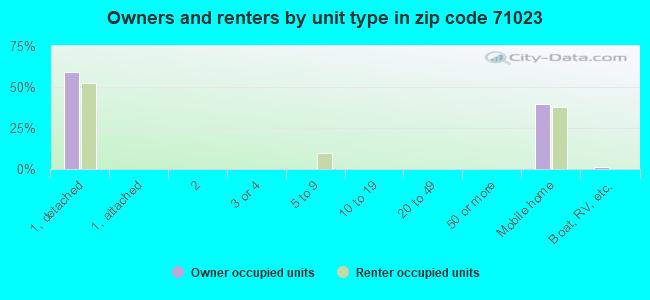
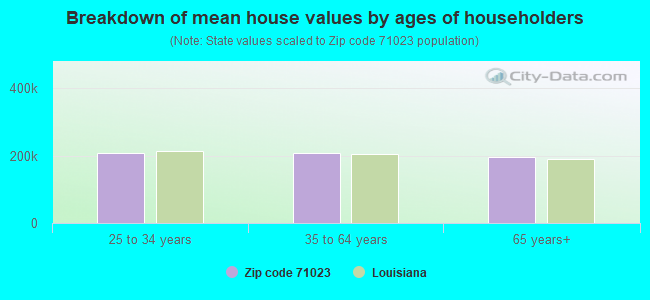
Housing units in zip code 71023 with a mortgage: 409 (14 second mortgage, 3 home equity loan, 11 both second mortgage and home equity loan) Median monthly owner costs for units with a mortgage: $1,056 Median monthly owner costs for units without a mortgage: $341
Residents with income below the poverty level in 2022:
This zip code:
26.6%
Whole state:
18.6%
Residents with income below 50% of the poverty level in 2022:
This zip code:
14.4%
Whole state:
10.1%
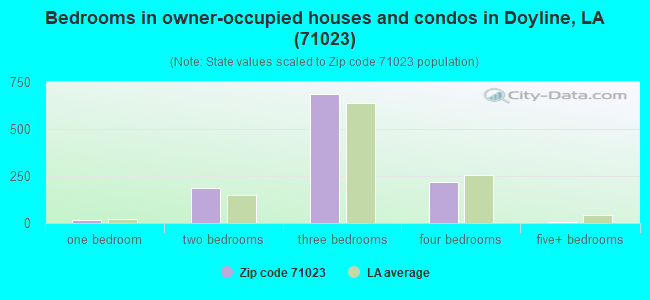
Median number of rooms in houses and condos:
Here:
6.1
State:
6.2
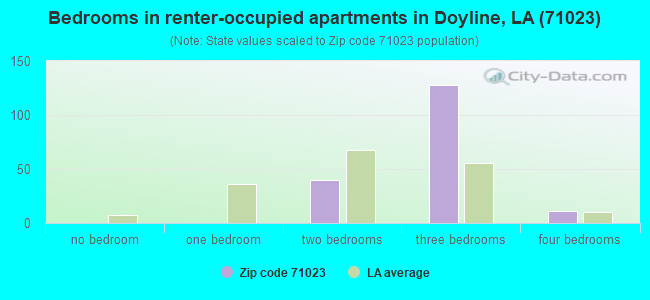
Median number of rooms in apartments:
Here:
5.4
State:
4.4
Notable locations in this zip code not listed on our city pages
Churches in zip code 71023 include: Point Chapel (A), New Zion Church (B), Pilgrim Rest Baptist Church (C), Kirk Chapel (D), Saint Marks Church (E), Saint Marys Church (F). Display/hide their locations on the map
Streams, rivers, and creeks: Caney Branch (A), Clarke Bayou (B), Boone Creek (C), Prairie Bayou (D), Foxskin Bayou (E). Display/hide their locations on the map
Size of family households: 475 2-persons, 141 3-persons, 131 4-persons, 59 5-persons, 13 6-persons, 1 7-or-more-persons
Size of nonfamily households: 401 1-person, 54 2-persons, 12 3-persons
348 married couples with children.
129 single-parent households (36 men, 93 women).
98.2% of residents of 71023 zip code speak English at home.
2.0% of residents speak Spanish at home (48% very well, 30% well, 21% not well).
0.4% of residents speak other Indo-European language at home (100% very well).
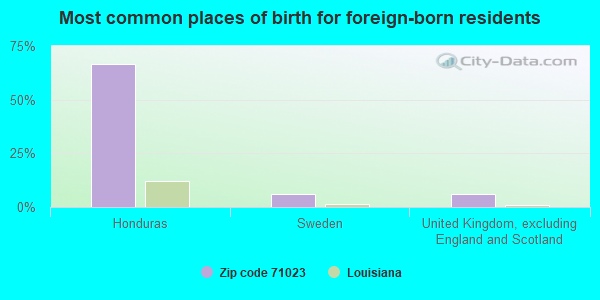
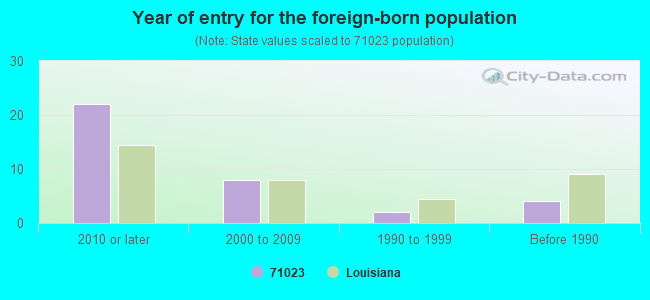
Foreign born population: 33 (1.1%) (71.2% of them are naturalized citizens)
This zip code:
1.1%
Whole state:
4.2%
67%Honduras
6%Sweden
6%United Kingdom, excluding England and Scotland
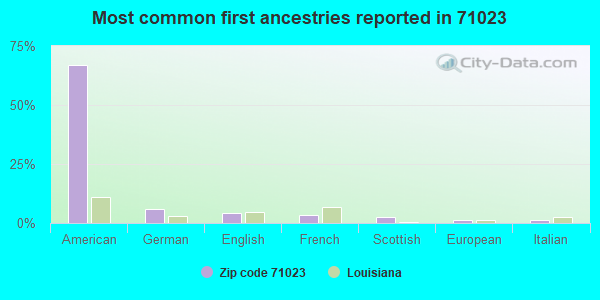
67%American
6%German
4%English
3%French
2%Scottish
1%European
1%Italian
Year of entry for the foreign-born population
222010 or later
82000 to 2009
21990 to 1999
4Before 1990
Facilities with environmental interests located in this zip code:
PINE COUNTRY EDUCATION CTR (SE AREA OF M1 in DOYLINE, LA)
National Pollutant Discharge Elimination System NON-MAJOR (Tracking pollutant discharge elimination systems) - permit
HICKORY HOLLOW MOBILE PARK (PARISH ROAD 178 in DOYLINE, LA)
National Pollutant Discharge Elimination System NON-MAJOR (Tracking pollutant discharge elimination systems) - permit Business SIC classification: SEWERAGE SYSTEMS Alternative names: HICKORY HOLLOW TRAI-, HICKORY HOLLOW TRAILER PARK
Housing units lacking complete plumbing facilities: 9.6% Housing units lacking complete kitchen facilities: 3.9%
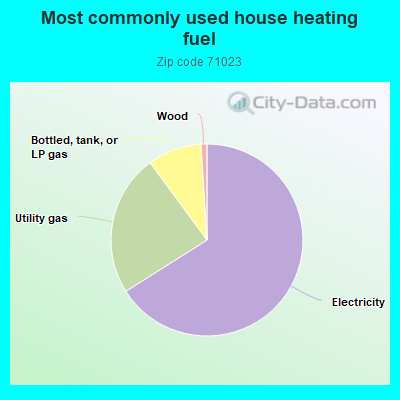
66.1%Electricity
23.9%Utility gas
9.1%Bottled, tank, or LP gas
1.0%Wood
Population in 1990: 3,065. Population change in the 1990s: +595 (+19.4%).
Place of birth for U.S.-born residents:
This state: 2,230
Northeast: 31
Midwest: 79
South: 429
West: 120
63% of the 71023 zip code residents lived in the same house 5 years ago. Out of people who lived in different houses, 32% lived in this county. Out of people who lived in different counties, 50% lived in Louisiana.
97% of the 71023 zip code residents lived in the same house 1 year ago. Out of people who lived in different houses, 82% moved from this county. Out of people who lived in different houses, 25% moved from different county within same state.
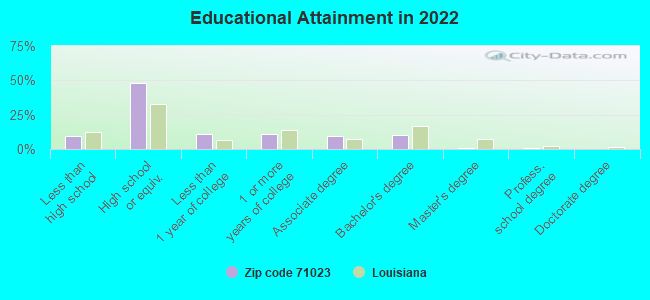
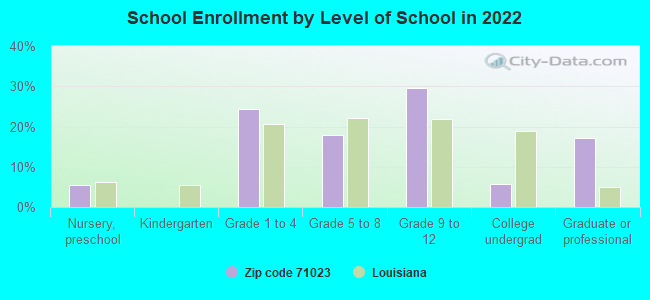
Private vs. public school enrollment:
Students in private schools in grades 1 to 8 (elementary and middle school): 1
Here:
0.9%
Louisiana:
19.6%
Students in private schools in grades 9 to 12 (high school): 12
Here:
8.4%
Louisiana:
18.3%
Students in private undergraduate colleges: 3
Here:
12.2%
Louisiana:
17.4%
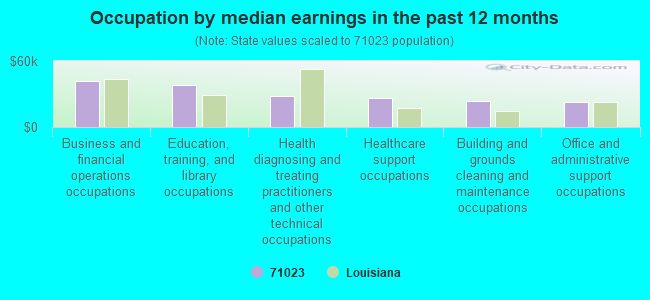
Occupation by median earnings in the past 12 months ($)
41,512Business and financial operations occupations
38,410Education, training, and library occupations
27,951Health diagnosing and treating practitioners and other technical occupations
26,792Healthcare support occupations
23,262Building and grounds cleaning and maintenance occupations
22,352Office and administrative support occupations
Top industries in this zip code by the number of employees in 2005:
Other Services (except Public Administration): Religious Organizations (10-19: 1, 1-4: 1)
Accommodation and Food Services: Full-Service Restaurants (10-19: 1)
Construction: Roofing Contractors (10-19: 1)
Construction: Electrical Contractors (1-4: 1)
Other Services (except Public Administration): Commercial and Industrial Machinery and Equipment (except Automotive and Electronic) Repair and Maintenance (1-4: 1)
Construction: Residential Remodelers (1-4: 1)
Fatal accident statistics in 2010:
Fatal accident count: 1
Vehicles involved in fatal accidents: 1
Fatal accidents caused by drunken drivers: 1
Fatalities: 1
Persons involved in fatal accidents: 2
Pedestrians involved in fatal accidents: 0
Home Mortgage Disclosure Act Aggregated Statistics For Year 2003 (Based on 2 partial tracts)
A) FHA, FSA/RHS & VA Home Purchase Loans
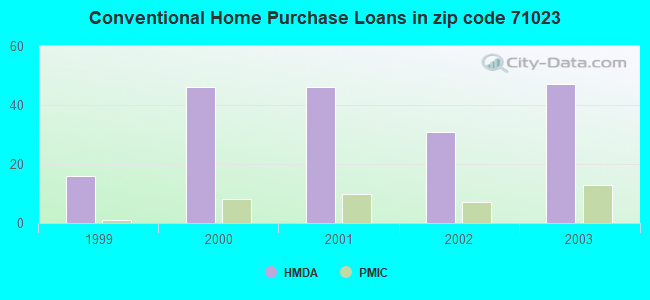
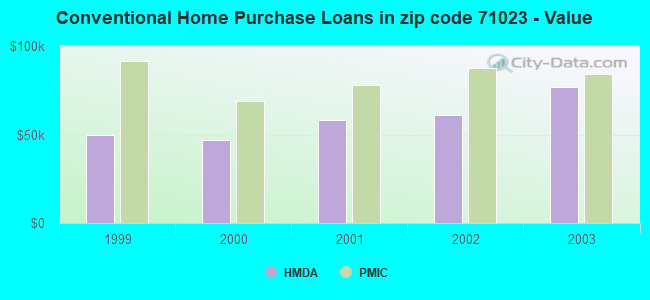
B) Conventional Home Purchase Loans
C) Refinancings
D) Home Improvement Loans
F) Non-occupant Loans on < 5 Family Dwellings (A B C & D)
Number
Average Value
Number
Average Value
Number
Average Value
Number
Average Value
Number
Average Value
LOANS ORIGINATED
8
$99,770
47
$76,706
110
$80,805
10
$19,845
14
$88,470
APPLICATIONS APPROVED, NOT ACCEPTED
2
$72,680
8
$35,360
18
$109,622
2
$23,935
3
$25,823
APPLICATIONS DENIED
2
$70,065
25
$51,319
50
$73,967
22
$17,843
2
$39,605
APPLICATIONS WITHDRAWN
1
$35,690
9
$55,899
27
$87,330
2
$46,565
2
$68,760
FILES CLOSED FOR INCOMPLETENESS
1
$78,340
1
$54,840
2
$70,940
0
$0
1
$47,870
Aggregated Statistics For Year 2002 (Based on 2 partial tracts)
A) FHA, FSA/RHS & VA Home Purchase Loans
B) Conventional Home Purchase Loans
C) Refinancings
D) Home Improvement Loans
F) Non-occupant Loans on < 5 Family Dwellings (A B C & D)
Number
Average Value
Number
Average Value
Number
Average Value
Number
Average Value
Number
Average Value
LOANS ORIGINATED
6
$75,145
31
$60,844
71
$74,021
16
$14,851
9
$41,199
APPLICATIONS APPROVED, NOT ACCEPTED
2
$68,760
10
$52,311
13
$82,889
0
$0
1
$13,060
APPLICATIONS DENIED
2
$80,510
37
$44,273
37
$62,998
23
$11,656
4
$24,370
APPLICATIONS WITHDRAWN
2
$105,755
3
$60,927
16
$98,628
1
$17,410
0
$0
FILES CLOSED FOR INCOMPLETENESS
0
$0
2
$33,075
3
$90,813
0
$0
0
$0
Aggregated Statistics For Year 2001 (Based on 2 partial tracts)
A) FHA, FSA/RHS & VA Home Purchase Loans
B) Conventional Home Purchase Loans
C) Refinancings
D) Home Improvement Loans
F) Non-occupant Loans on < 5 Family Dwellings (A B C & D)
Number
Average Value
Number
Average Value
Number
Average Value
Number
Average Value
Number
Average Value
LOANS ORIGINATED
6
$106,623
46
$58,317
84
$63,508
16
$11,859
8
$33,292
APPLICATIONS APPROVED, NOT ACCEPTED
1
$59,190
17
$51,456
17
$62,003
1
$5,220
0
$0
APPLICATIONS DENIED
2
$77,900
49
$46,025
49
$51,816
16
$11,751
7
$56,700
APPLICATIONS WITHDRAWN
1
$122,730
11
$52,620
22
$56,695
3
$28,143
1
$47,870
FILES CLOSED FOR INCOMPLETENESS
0
$0
0
$0
7
$51,479
0
$0
0
$0
Aggregated Statistics For Year 2000 (Based on 2 partial tracts)
A) FHA, FSA/RHS & VA Home Purchase Loans
B) Conventional Home Purchase Loans
C) Refinancings
D) Home Improvement Loans
F) Non-occupant Loans on < 5 Family Dwellings (A B C & D)
Number
Average Value
Number
Average Value
Number
Average Value
Number
Average Value
Number
Average Value
LOANS ORIGINATED
4
$81,165
46
$46,831
37
$59,352
15
$11,141
7
$43,396
APPLICATIONS APPROVED, NOT ACCEPTED
3
$46,710
29
$38,508
10
$61,189
2
$12,620
3
$19,730
APPLICATIONS DENIED
2
$48,740
42
$36,702
37
$41,050
17
$7,782
2
$8,705
APPLICATIONS WITHDRAWN
0
$0
1
$48,740
24
$41,634
0
$0
2
$35,250
FILES CLOSED FOR INCOMPLETENESS
1
$44,390
3
$59,767
3
$74,273
0
$0
1
$48,740
Aggregated Statistics For Year 1999 (Based on 1 partial tract)
A) FHA, FSA/RHS & VA Home Purchase Loans
B) Conventional Home Purchase Loans
C) Refinancings
D) Home Improvement Loans
F) Non-occupant Loans on < 5 Family Dwellings (A B C & D)
Detailed PMIC statistics for the following Tracts:0315.00
2002 - 2018 National Fire Incident Reporting System (NFIRS) incidents
Based on the data from the years 2002 - 2018 the average number of fire incidents per year is 23. The highest number of fires - 62 took place in 2002, and the least - 4 in 2017. The data has a dropping trend.
When looking into fire subcategories, the most reports belonged to: Outside Fires (59.4%), and Structure Fires (30.0%).
Fire incident types reported to NFIRS in Zip Code 71023
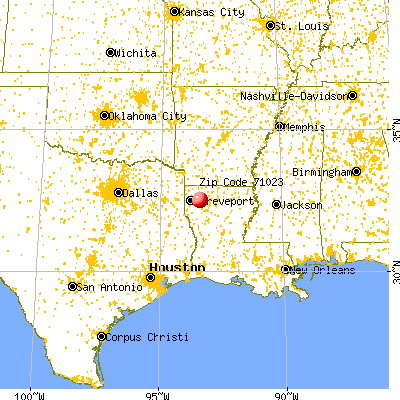


 Nearest zip codes: 71037, 71073, 71039, 71067, 71051, 71110.


 Based on the data from the years 2002 - 2018 the average number of fire incidents per year is 23. The highest number of fires - 62 took place in 2002, and the least - 4 in 2017. The data has a dropping trend.
 When looking into fire subcategories, the most reports belonged to: Outside Fires (59.4%), and Structure Fires (30.0%).