Cities: Midlothian, TX (50.21%) ,
Grand Prairie, TX (3.32%) ,
Waxahachie, TX (1.39%) ,
Mansfield, TX (1.31%) ,
Cedar Hill, TX (0.61%) ,
Ovilla, TX (0.07%) County: Ellis County, TX Estimated zip code population in 2022: 43,555
Zip code population in 2010: 28,986
Zip code population in 2000: 16,521
Houses and condos: 15,243
Renter-occupied apartments: 2,338
% of renters here:
16%State:
38%
March 2022 cost of living index in zip code 76065: 94.8
(less than average, U.S. average is 100)
Land area: 98.4
sq. mi.
Water area: 1.3
sq. mi.
Population density: 442 people per square mile (low).
OSM Map
General Map
Google Map
MSN Map
OSM Map
General Map
Google Map
MSN Map
OSM Map
General Map
Google Map
MSN Map
OSM Map
General Map
Google Map
MSN Map
Please wait while loading the map...
Real estate property taxes paid for housing units in 2022:
This zip code:
1.5% ($5,985)Texas:
1.5% ($4,050)
Median real estate property taxes paid for housing units with mortgages in 2022: $6,660 (1.6%)
Median real estate property taxes paid for housing units with no mortgage in 2022: $3,914 (1.3%)
Profiles of local businesses
Business Search - 14 Million verified businesses
Males: 21,319 Females: 22,235
For population 25 years and over in 76065:
High school or higher: 94.9%Bachelor's degree or higher: 39.1%Graduate or professional degree: 12.5%Unemployed: 2.4%Mean travel time to work (commute): 31.2 minutes
For population 15 years and over in 76065:
Never married: 24.9%Now married: 61.2%Separated: 1.3%Widowed: 3.8%Divorced: 8.8%
Zip code 76065 compared to state average:
Median household income above state average. Unemployed percentage below state average. Hispanic race population percentage below state average. Foreign-born population percentage significantly below state average. Renting percentage significantly below state average. Number of rooms per house above state average. House age significantly below state average. 29,789 68.4% White 7,956 18.3% Hispanic or Latino 4,003 9.2% Black 1,386 3.2% Two or more races 206 0.5% Asian 184 0.4% Some other race 27 0.06% American Indian
Data:
Median household income ($)
Median household income (% change since 2000)
Household income diversity
Ratio of average income to average house value (%)
Ratio of average income to average rent
Median household income ($) - White
Median household income ($) - Black or African American
Median household income ($) - Asian
Median household income ($) - Hispanic or Latino
Median household income ($) - American Indian and Alaska Native
Median household income ($) - Multirace
Median household income ($) - Other Race
Median household income for houses/condos with a mortgage ($)
Median household income for apartments without a mortgage ($)
Races - White alone (%)
Races - White alone (% change since 2000)
Races - Black alone (%)
Races - Black alone (% change since 2000)
Races - American Indian alone (%)
Races - American Indian alone (% change since 2000)
Races - Asian alone (%)
Races - Asian alone (% change since 2000)
Races - Hispanic (%)
Races - Hispanic (% change since 2000)
Races - Native Hawaiian and Other Pacific Islander alone (%)
Races - Native Hawaiian and Other Pacific Islander alone (% change since 2000)
Races - Two or more races (%)
Races - Two or more races (% change since 2000)
Races - Other race alone (%)
Races - Other race alone (% change since 2000)
Racial diversity
Unemployment (%)
Unemployment (% change since 2000)
Unemployment (%) - White
Unemployment (%) - Black or African American
Unemployment (%) - Asian
Unemployment (%) - Hispanic or Latino
Unemployment (%) - American Indian and Alaska Native
Unemployment (%) - Multirace
Unemployment (%) - Other Race
Population density (people per square mile)
Population - Males (%)
Population - Females (%)
Population - Males (%) - White
Population - Males (%) - Black or African American
Population - Males (%) - Asian
Population - Males (%) - Hispanic or Latino
Population - Males (%) - American Indian and Alaska Native
Population - Males (%) - Multirace
Population - Males (%) - Other Race
Population - Females (%) - White
Population - Females (%) - Black or African American
Population - Females (%) - Asian
Population - Females (%) - Hispanic or Latino
Population - Females (%) - American Indian and Alaska Native
Population - Females (%) - Multirace
Population - Females (%) - Other Race
Coronavirus confirmed cases (Apr 27, 2024)
Deaths caused by coronavirus (Apr 27, 2024)
Coronavirus confirmed cases (per 100k population) (Apr 27, 2024)
Deaths caused by coronavirus (per 100k population) (Apr 27, 2024)
Daily increase in number of cases (Apr 27, 2024)
Weekly increase in number of cases (Apr 27, 2024)
Cases doubled (in days) (Apr 27, 2024)
Hospitalized patients (Apr 18, 2022)
Negative test results (Apr 18, 2022)
Total test results (Apr 18, 2022)
COVID Vaccine doses distributed (per 100k population) (Sep 19, 2023)
COVID Vaccine doses administered (per 100k population) (Sep 19, 2023)
COVID Vaccine doses distributed (Sep 19, 2023)
COVID Vaccine doses administered (Sep 19, 2023)
Likely homosexual households (%)
Likely homosexual households (% change since 2000)
Likely homosexual households - Lesbian couples (%)
Likely homosexual households - Lesbian couples (% change since 2000)
Likely homosexual households - Gay men (%)
Likely homosexual households - Gay men (% change since 2000)
Cost of living index
Median gross rent ($)
Median contract rent ($)
Median monthly housing costs ($)
Median house or condo value ($)
Median house or condo value ($ change since 2000)
Mean house or condo value by units in structure - 1, detached ($)
Mean house or condo value by units in structure - 1, attached ($)
Mean house or condo value by units in structure - 2 ($)
Mean house or condo value by units in structure by units in structure - 3 or 4 ($)
Mean house or condo value by units in structure - 5 or more ($)
Mean house or condo value by units in structure - Boat, RV, van, etc. ($)
Mean house or condo value by units in structure - Mobile home ($)
Median house or condo value ($) - White
Median house or condo value ($) - Black or African American
Median house or condo value ($) - Asian
Median house or condo value ($) - Hispanic or Latino
Median house or condo value ($) - American Indian and Alaska Native
Median house or condo value ($) - Multirace
Median house or condo value ($) - Other Race
Median resident age
Resident age diversity
Median resident age - Males
Median resident age - Females
Median resident age - White
Median resident age - Black or African American
Median resident age - Asian
Median resident age - Hispanic or Latino
Median resident age - American Indian and Alaska Native
Median resident age - Multirace
Median resident age - Other Race
Median resident age - Males - White
Median resident age - Males - Black or African American
Median resident age - Males - Asian
Median resident age - Males - Hispanic or Latino
Median resident age - Males - American Indian and Alaska Native
Median resident age - Males - Multirace
Median resident age - Males - Other Race
Median resident age - Females - White
Median resident age - Females - Black or African American
Median resident age - Females - Asian
Median resident age - Females - Hispanic or Latino
Median resident age - Females - American Indian and Alaska Native
Median resident age - Females - Multirace
Median resident age - Females - Other Race
Commute - mean travel time to work (minutes)
Travel time to work - Less than 5 minutes (%)
Travel time to work - Less than 5 minutes (% change since 2000)
Travel time to work - 5 to 9 minutes (%)
Travel time to work - 5 to 9 minutes (% change since 2000)
Travel time to work - 10 to 19 minutes (%)
Travel time to work - 10 to 19 minutes (% change since 2000)
Travel time to work - 20 to 29 minutes (%)
Travel time to work - 20 to 29 minutes (% change since 2000)
Travel time to work - 30 to 39 minutes (%)
Travel time to work - 30 to 39 minutes (% change since 2000)
Travel time to work - 40 to 59 minutes (%)
Travel time to work - 40 to 59 minutes (% change since 2000)
Travel time to work - 60 to 89 minutes (%)
Travel time to work - 60 to 89 minutes (% change since 2000)
Travel time to work - 90 or more minutes (%)
Travel time to work - 90 or more minutes (% change since 2000)
Marital status - Never married (%)
Marital status - Now married (%)
Marital status - Separated (%)
Marital status - Widowed (%)
Marital status - Divorced (%)
Median family income ($)
Median family income (% change since 2000)
Median non-family income ($)
Median non-family income (% change since 2000)
Median per capita income ($)
Median per capita income (% change since 2000)
Median family income ($) - White
Median family income ($) - Black or African American
Median family income ($) - Asian
Median family income ($) - Hispanic or Latino
Median family income ($) - American Indian and Alaska Native
Median family income ($) - Multirace
Median family income ($) - Other Race
Median year house/condo built
Median year apartment built
Year house built - Built 2005 or later (%)
Year house built - Built 2000 to 2004 (%)
Year house built - Built 1990 to 1999 (%)
Year house built - Built 1980 to 1989 (%)
Year house built - Built 1970 to 1979 (%)
Year house built - Built 1960 to 1969 (%)
Year house built - Built 1950 to 1959 (%)
Year house built - Built 1940 to 1949 (%)
Year house built - Built 1939 or earlier (%)
Average household size
Household density (households per square mile)
Average household size - White
Average household size - Black or African American
Average household size - Asian
Average household size - Hispanic or Latino
Average household size - American Indian and Alaska Native
Average household size - Multirace
Average household size - Other Race
Occupied housing units (%)
Vacant housing units (%)
Owner occupied housing units (%)
Renter occupied housing units (%)
Vacancy status - For rent (%)
Vacancy status - For sale only (%)
Vacancy status - Rented or sold, not occupied (%)
Vacancy status - For seasonal, recreational, or occasional use (%)
Vacancy status - For migrant workers (%)
Vacancy status - Other vacant (%)
Residents with income below the poverty level (%)
Residents with income below 50% of the poverty level (%)
Children below poverty level (%)
Poor families by family type - Married-couple family (%)
Poor families by family type - Male, no wife present (%)
Poor families by family type - Female, no husband present (%)
Poverty status for native-born residents (%)
Poverty status for foreign-born residents (%)
Poverty among high school graduates not in families (%)
Poverty among people who did not graduate high school not in families (%)
Residents with income below the poverty level (%) - White
Residents with income below the poverty level (%) - Black or African American
Residents with income below the poverty level (%) - Asian
Residents with income below the poverty level (%) - Hispanic or Latino
Residents with income below the poverty level (%) - American Indian and Alaska Native
Residents with income below the poverty level (%) - Multirace
Residents with income below the poverty level (%) - Other Race
Air pollution - Air Quality Index (AQI)
Air pollution - CO
Air pollution - NO2
Air pollution - SO2
Air pollution - Ozone
Air pollution - PM10
Air pollution - PM25
Air pollution - Pb
Crime - Murders per 100,000 population
Crime - Rapes per 100,000 population
Crime - Robberies per 100,000 population
Crime - Assaults per 100,000 population
Crime - Burglaries per 100,000 population
Crime - Thefts per 100,000 population
Crime - Auto thefts per 100,000 population
Crime - Arson per 100,000 population
Crime - City-data.com crime index
Crime - Violent crime index
Crime - Property crime index
Crime - Murders per 100,000 population (5 year average)
Crime - Rapes per 100,000 population (5 year average)
Crime - Robberies per 100,000 population (5 year average)
Crime - Assaults per 100,000 population (5 year average)
Crime - Burglaries per 100,000 population (5 year average)
Crime - Thefts per 100,000 population (5 year average)
Crime - Auto thefts per 100,000 population (5 year average)
Crime - Arson per 100,000 population (5 year average)
Crime - City-data.com crime index (5 year average)
Crime - Violent crime index (5 year average)
Crime - Property crime index (5 year average)
1996 Presidential Elections Results (%) - Democratic Party (Clinton)
1996 Presidential Elections Results (%) - Republican Party (Dole)
1996 Presidential Elections Results (%) - Other
2000 Presidential Elections Results (%) - Democratic Party (Gore)
2000 Presidential Elections Results (%) - Republican Party (Bush)
2000 Presidential Elections Results (%) - Other
2004 Presidential Elections Results (%) - Democratic Party (Kerry)
2004 Presidential Elections Results (%) - Republican Party (Bush)
2004 Presidential Elections Results (%) - Other
2008 Presidential Elections Results (%) - Democratic Party (Obama)
2008 Presidential Elections Results (%) - Republican Party (McCain)
2008 Presidential Elections Results (%) - Other
2012 Presidential Elections Results (%) - Democratic Party (Obama)
2012 Presidential Elections Results (%) - Republican Party (Romney)
2012 Presidential Elections Results (%) - Other
2016 Presidential Elections Results (%) - Democratic Party (Clinton)
2016 Presidential Elections Results (%) - Republican Party (Trump)
2016 Presidential Elections Results (%) - Other
2020 Presidential Elections Results (%) - Democratic Party (Biden)
2020 Presidential Elections Results (%) - Republican Party (Trump)
2020 Presidential Elections Results (%) - Other
Ancestries Reported - Arab (%)
Ancestries Reported - Czech (%)
Ancestries Reported - Danish (%)
Ancestries Reported - Dutch (%)
Ancestries Reported - English (%)
Ancestries Reported - French (%)
Ancestries Reported - French Canadian (%)
Ancestries Reported - German (%)
Ancestries Reported - Greek (%)
Ancestries Reported - Hungarian (%)
Ancestries Reported - Irish (%)
Ancestries Reported - Italian (%)
Ancestries Reported - Lithuanian (%)
Ancestries Reported - Norwegian (%)
Ancestries Reported - Polish (%)
Ancestries Reported - Portuguese (%)
Ancestries Reported - Russian (%)
Ancestries Reported - Scotch-Irish (%)
Ancestries Reported - Scottish (%)
Ancestries Reported - Slovak (%)
Ancestries Reported - Subsaharan African (%)
Ancestries Reported - Swedish (%)
Ancestries Reported - Swiss (%)
Ancestries Reported - Ukrainian (%)
Ancestries Reported - United States (%)
Ancestries Reported - Welsh (%)
Ancestries Reported - West Indian (%)
Ancestries Reported - Other (%)
Educational Attainment - No schooling completed (%)
Educational Attainment - Less than high school (%)
Educational Attainment - High school or equivalent (%)
Educational Attainment - Less than 1 year of college (%)
Educational Attainment - 1 or more years of college (%)
Educational Attainment - Associate degree (%)
Educational Attainment - Bachelor's degree (%)
Educational Attainment - Master's degree (%)
Educational Attainment - Professional school degree (%)
Educational Attainment - Doctorate degree (%)
School Enrollment - Nursery, preschool (%)
School Enrollment - Kindergarten (%)
School Enrollment - Grade 1 to 4 (%)
School Enrollment - Grade 5 to 8 (%)
School Enrollment - Grade 9 to 12 (%)
School Enrollment - College undergrad (%)
School Enrollment - Graduate or professional (%)
School Enrollment - Not enrolled in school (%)
School enrollment - Public schools (%)
School enrollment - Private schools (%)
School enrollment - Not enrolled (%)
Median number of rooms in houses and condos
Median number of rooms in apartments
Housing units lacking complete plumbing facilities (%)
Housing units lacking complete kitchen facilities (%)
Density of houses
Urban houses (%)
Rural houses (%)
Households with people 60 years and over (%)
Households with people 65 years and over (%)
Households with people 75 years and over (%)
Households with one or more nonrelatives (%)
Households with no nonrelatives (%)
Population in households (%)
Family households (%)
Nonfamily households (%)
Population in families (%)
Family households with own children (%)
Median number of bedrooms in owner occupied houses
Mean number of bedrooms in owner occupied houses
Median number of bedrooms in renter occupied houses
Mean number of bedrooms in renter occupied houses
Median number of vehichles in owner occupied houses
Mean number of vehichles in owner occupied houses
Median number of vehichles in renter occupied houses
Mean number of vehichles in renter occupied houses
Mortgage status - with mortgage (%)
Mortgage status - with second mortgage (%)
Mortgage status - with home equity loan (%)
Mortgage status - with both second mortgage and home equity loan (%)
Mortgage status - without a mortgage (%)
Average family size
Average family size - White
Average family size - Black or African American
Average family size - Asian
Average family size - Hispanic or Latino
Average family size - American Indian and Alaska Native
Average family size - Multirace
Average family size - Other Race
Geographical mobility - Same house 1 year ago (%)
Geographical mobility - Moved within same county (%)
Geographical mobility - Moved from different county within same state (%)
Geographical mobility - Moved from different state (%)
Geographical mobility - Moved from abroad (%)
Place of birth - Born in state of residence (%)
Place of birth - Born in other state (%)
Place of birth - Native, outside of US (%)
Place of birth - Foreign born (%)
Housing units in structures - 1, detached (%)
Housing units in structures - 1, attached (%)
Housing units in structures - 2 (%)
Housing units in structures - 3 or 4 (%)
Housing units in structures - 5 to 9 (%)
Housing units in structures - 10 to 19 (%)
Housing units in structures - 20 to 49 (%)
Housing units in structures - 50 or more (%)
Housing units in structures - Mobile home (%)
Housing units in structures - Boat, RV, van, etc. (%)
House/condo owner moved in on average (years ago)
Renter moved in on average (years ago)
Year householder moved into unit - Moved in 1999 to March 2000 (%)
Year householder moved into unit - Moved in 1995 to 1998 (%)
Year householder moved into unit - Moved in 1990 to 1994 (%)
Year householder moved into unit - Moved in 1980 to 1989 (%)
Year householder moved into unit - Moved in 1970 to 1979 (%)
Year householder moved into unit - Moved in 1969 or earlier (%)
Means of transportation to work - Drove car alone (%)
Means of transportation to work - Carpooled (%)
Means of transportation to work - Public transportation (%)
Means of transportation to work - Bus or trolley bus (%)
Means of transportation to work - Streetcar or trolley car (%)
Means of transportation to work - Subway or elevated (%)
Means of transportation to work - Railroad (%)
Means of transportation to work - Ferryboat (%)
Means of transportation to work - Taxicab (%)
Means of transportation to work - Motorcycle (%)
Means of transportation to work - Bicycle (%)
Means of transportation to work - Walked (%)
Means of transportation to work - Other means (%)
Working at home (%)
Industry diversity
Most Common Industries - Agriculture, forestry, fishing and hunting, and mining (%)
Most Common Industries - Agriculture, forestry, fishing and hunting (%)
Most Common Industries - Mining, quarrying, and oil and gas extraction (%)
Most Common Industries - Construction (%)
Most Common Industries - Manufacturing (%)
Most Common Industries - Wholesale trade (%)
Most Common Industries - Retail trade (%)
Most Common Industries - Transportation and warehousing, and utilities (%)
Most Common Industries - Transportation and warehousing (%)
Most Common Industries - Utilities (%)
Most Common Industries - Information (%)
Most Common Industries - Finance and insurance, and real estate and rental and leasing (%)
Most Common Industries - Finance and insurance (%)
Most Common Industries - Real estate and rental and leasing (%)
Most Common Industries - Professional, scientific, and management, and administrative and waste management services (%)
Most Common Industries - Professional, scientific, and technical services (%)
Most Common Industries - Management of companies and enterprises (%)
Most Common Industries - Administrative and support and waste management services (%)
Most Common Industries - Educational services, and health care and social assistance (%)
Most Common Industries - Educational services (%)
Most Common Industries - Health care and social assistance (%)
Most Common Industries - Arts, entertainment, and recreation, and accommodation and food services (%)
Most Common Industries - Arts, entertainment, and recreation (%)
Most Common Industries - Accommodation and food services (%)
Most Common Industries - Other services, except public administration (%)
Most Common Industries - Public administration (%)
Occupation diversity
Most Common Occupations - Management, business, science, and arts occupations (%)
Most Common Occupations - Management, business, and financial occupations (%)
Most Common Occupations - Management occupations (%)
Most Common Occupations - Business and financial operations occupations (%)
Most Common Occupations - Computer, engineering, and science occupations (%)
Most Common Occupations - Computer and mathematical occupations (%)
Most Common Occupations - Architecture and engineering occupations (%)
Most Common Occupations - Life, physical, and social science occupations (%)
Most Common Occupations - Education, legal, community service, arts, and media occupations (%)
Most Common Occupations - Community and social service occupations (%)
Most Common Occupations - Legal occupations (%)
Most Common Occupations - Education, training, and library occupations (%)
Most Common Occupations - Arts, design, entertainment, sports, and media occupations (%)
Most Common Occupations - Healthcare practitioners and technical occupations (%)
Most Common Occupations - Health diagnosing and treating practitioners and other technical occupations (%)
Most Common Occupations - Health technologists and technicians (%)
Most Common Occupations - Service occupations (%)
Most Common Occupations - Healthcare support occupations (%)
Most Common Occupations - Protective service occupations (%)
Most Common Occupations - Fire fighting and prevention, and other protective service workers including supervisors (%)
Most Common Occupations - Law enforcement workers including supervisors (%)
Most Common Occupations - Food preparation and serving related occupations (%)
Most Common Occupations - Building and grounds cleaning and maintenance occupations (%)
Most Common Occupations - Personal care and service occupations (%)
Most Common Occupations - Sales and office occupations (%)
Most Common Occupations - Sales and related occupations (%)
Most Common Occupations - Office and administrative support occupations (%)
Most Common Occupations - Natural resources, construction, and maintenance occupations (%)
Most Common Occupations - Farming, fishing, and forestry occupations (%)
Most Common Occupations - Construction and extraction occupations (%)
Most Common Occupations - Installation, maintenance, and repair occupations (%)
Most Common Occupations - Production, transportation, and material moving occupations (%)
Most Common Occupations - Production occupations (%)
Most Common Occupations - Transportation occupations (%)
Most Common Occupations - Material moving occupations (%)
People in Group quarters - Institutionalized population (%)
People in Group quarters - Correctional institutions (%)
People in Group quarters - Federal prisons and detention centers (%)
People in Group quarters - Halfway houses (%)
People in Group quarters - Local jails and other confinement facilities (including police lockups) (%)
People in Group quarters - Military disciplinary barracks (%)
People in Group quarters - State prisons (%)
People in Group quarters - Other types of correctional institutions (%)
People in Group quarters - Nursing homes (%)
People in Group quarters - Hospitals/wards, hospices, and schools for the handicapped (%)
People in Group quarters - Hospitals/wards and hospices for chronically ill (%)
People in Group quarters - Hospices or homes for chronically ill (%)
People in Group quarters - Military hospitals or wards for chronically ill (%)
People in Group quarters - Other hospitals or wards for chronically ill (%)
People in Group quarters - Hospitals or wards for drug/alcohol abuse (%)
People in Group quarters - Mental (Psychiatric) hospitals or wards (%)
People in Group quarters - Schools, hospitals, or wards for the mentally retarded (%)
People in Group quarters - Schools, hospitals, or wards for the physically handicapped (%)
People in Group quarters - Institutions for the deaf (%)
People in Group quarters - Institutions for the blind (%)
People in Group quarters - Orthopedic wards and institutions for the physically handicapped (%)
People in Group quarters - Wards in general hospitals for patients who have no usual home elsewhere (%)
People in Group quarters - Wards in military hospitals for patients who have no usual home elsewhere (%)
People in Group quarters - Juvenile institutions (%)
People in Group quarters - Long-term care (%)
People in Group quarters - Homes for abused, dependent, and neglected children (%)
People in Group quarters - Residential treatment centers for emotionally disturbed children (%)
People in Group quarters - Training schools for juvenile delinquents (%)
People in Group quarters - Short-term care, detention or diagnostic centers for delinquent children (%)
People in Group quarters - Type of juvenile institution unknown (%)
People in Group quarters - Noninstitutionalized population (%)
People in Group quarters - College dormitories (includes college quarters off campus) (%)
People in Group quarters - Military quarters (%)
People in Group quarters - On base (%)
People in Group quarters - Barracks, unaccompanied personnel housing (UPH), (Enlisted/Officer), ;and similar group living quarters for military personnel (%)
People in Group quarters - Transient quarters for temporary residents (%)
People in Group quarters - Military ships (%)
People in Group quarters - Group homes (%)
People in Group quarters - Homes or halfway houses for drug/alcohol abuse (%)
People in Group quarters - Homes for the mentally ill (%)
People in Group quarters - Homes for the mentally retarded (%)
People in Group quarters - Homes for the physically handicapped (%)
People in Group quarters - Other group homes (%)
People in Group quarters - Religious group quarters (%)
People in Group quarters - Dormitories (%)
People in Group quarters - Agriculture workers' dormitories on farms (%)
People in Group quarters - Job Corps and vocational training facilities (%)
People in Group quarters - Other workers' dormitories (%)
People in Group quarters - Crews of maritime vessels (%)
People in Group quarters - Other nonhousehold living situations (%)
People in Group quarters - Other noninstitutional group quarters (%)
Residents speaking English at home (%)
Residents speaking English at home - Born in the United States (%)
Residents speaking English at home - Native, born elsewhere (%)
Residents speaking English at home - Foreign born (%)
Residents speaking Spanish at home (%)
Residents speaking Spanish at home - Born in the United States (%)
Residents speaking Spanish at home - Native, born elsewhere (%)
Residents speaking Spanish at home - Foreign born (%)
Residents speaking other language at home (%)
Residents speaking other language at home - Born in the United States (%)
Residents speaking other language at home - Native, born elsewhere (%)
Residents speaking other language at home - Foreign born (%)
Class of Workers - Employee of private company (%)
Class of Workers - Self-employed in own incorporated business (%)
Class of Workers - Private not-for-profit wage and salary workers (%)
Class of Workers - Local government workers (%)
Class of Workers - State government workers (%)
Class of Workers - Federal government workers (%)
Class of Workers - Self-employed workers in own not incorporated business and Unpaid family workers (%)
House heating fuel used in houses and condos - Utility gas (%)
House heating fuel used in houses and condos - Bottled, tank, or LP gas (%)
House heating fuel used in houses and condos - Electricity (%)
House heating fuel used in houses and condos - Fuel oil, kerosene, etc. (%)
House heating fuel used in houses and condos - Coal or coke (%)
House heating fuel used in houses and condos - Wood (%)
House heating fuel used in houses and condos - Solar energy (%)
House heating fuel used in houses and condos - Other fuel (%)
House heating fuel used in houses and condos - No fuel used (%)
House heating fuel used in apartments - Utility gas (%)
House heating fuel used in apartments - Bottled, tank, or LP gas (%)
House heating fuel used in apartments - Electricity (%)
House heating fuel used in apartments - Fuel oil, kerosene, etc. (%)
House heating fuel used in apartments - Coal or coke (%)
House heating fuel used in apartments - Wood (%)
House heating fuel used in apartments - Solar energy (%)
House heating fuel used in apartments - Other fuel (%)
House heating fuel used in apartments - No fuel used (%)
Armed forces status - In Armed Forces (%)
Armed forces status - Civilian (%)
Armed forces status - Civilian - Veteran (%)
Armed forces status - Civilian - Nonveteran (%)
Fatal accidents locations in years 2005-2021
Fatal accidents locations in 2005
Fatal accidents locations in 2006
Fatal accidents locations in 2007
Fatal accidents locations in 2008
Fatal accidents locations in 2009
Fatal accidents locations in 2010
Fatal accidents locations in 2011
Fatal accidents locations in 2012
Fatal accidents locations in 2013
Fatal accidents locations in 2014
Fatal accidents locations in 2015
Fatal accidents locations in 2016
Fatal accidents locations in 2017
Fatal accidents locations in 2018
Fatal accidents locations in 2019
Fatal accidents locations in 2020
Fatal accidents locations in 2021
Alcohol use - People drinking some alcohol every month (%)
Alcohol use - People not drinking at all (%)
Alcohol use - Average days/month drinking alcohol
Alcohol use - Average drinks/week
Alcohol use - Average days/year people drink much
Audiometry - Average condition of hearing (%)
Audiometry - People that can hear a whisper from across a quiet room (%)
Audiometry - People that can hear normal voice from across a quiet room (%)
Audiometry - Ears ringing, roaring, buzzing (%)
Audiometry - Had a job exposure to loud noise (%)
Audiometry - Had off-work exposure to loud noise (%)
Blood Pressure & Cholesterol - Has high blood pressure (%)
Blood Pressure & Cholesterol - Checking blood pressure at home (%)
Blood Pressure & Cholesterol - Frequently checking blood cholesterol (%)
Blood Pressure & Cholesterol - Has high cholesterol level (%)
Consumer Behavior - Money monthly spent on food at supermarket/grocery store
Consumer Behavior - Money monthly spent on food at other stores
Consumer Behavior - Money monthly spent on eating out
Consumer Behavior - Money monthly spent on carryout/delivered foods
Consumer Behavior - Income spent on food at supermarket/grocery store (%)
Consumer Behavior - Income spent on food at other stores (%)
Consumer Behavior - Income spent on eating out (%)
Consumer Behavior - Income spent on carryout/delivered foods (%)
Current Health Status - General health condition (%)
Current Health Status - Blood donors (%)
Current Health Status - Has blood ever tested for HIV virus (%)
Current Health Status - Left-handed people (%)
Dermatology - People using sunscreen (%)
Diabetes - Diabetics (%)
Diabetes - Had a blood test for high blood sugar (%)
Diabetes - People taking insulin (%)
Diet Behavior & Nutrition - Diet health (%)
Diet Behavior & Nutrition - Milk product consumption (# of products/month)
Diet Behavior & Nutrition - Meals not home prepared (#/week)
Diet Behavior & Nutrition - Meals from fast food or pizza place (#/week)
Diet Behavior & Nutrition - Ready-to-eat foods (#/month)
Diet Behavior & Nutrition - Frozen meals/pizza (#/month)
Drug Use - People that ever used marijuana or hashish (%)
Drug Use - Ever used hard drugs (%)
Drug Use - Ever used any form of cocaine (%)
Drug Use - Ever used heroin (%)
Drug Use - Ever used methamphetamine (%)
Health Insurance - People covered by health insurance (%)
Kidney Conditions-Urology - Avg. # of times urinating at night
Medical Conditions - People with asthma (%)
Medical Conditions - People with anemia (%)
Medical Conditions - People with psoriasis (%)
Medical Conditions - People with overweight (%)
Medical Conditions - Elderly people having difficulties in thinking or remembering (%)
Medical Conditions - People who ever received blood transfusion (%)
Medical Conditions - People having trouble seeing even with glass/contacts (%)
Medical Conditions - People with arthritis (%)
Medical Conditions - People with gout (%)
Medical Conditions - People with congestive heart failure (%)
Medical Conditions - People with coronary heart disease (%)
Medical Conditions - People with angina pectoris (%)
Medical Conditions - People who ever had heart attack (%)
Medical Conditions - People who ever had stroke (%)
Medical Conditions - People with emphysema (%)
Medical Conditions - People with thyroid problem (%)
Medical Conditions - People with chronic bronchitis (%)
Medical Conditions - People with any liver condition (%)
Medical Conditions - People who ever had cancer or malignancy (%)
Mental Health - People who have little interest in doing things (%)
Mental Health - People feeling down, depressed, or hopeless (%)
Mental Health - People who have trouble sleeping or sleeping too much (%)
Mental Health - People feeling tired or having little energy (%)
Mental Health - People with poor appetite or overeating (%)
Mental Health - People feeling bad about themself (%)
Mental Health - People who have trouble concentrating on things (%)
Mental Health - People moving or speaking slowly or too fast (%)
Mental Health - People having thoughts they would be better off dead (%)
Oral Health - Average years since last visit a dentist
Oral Health - People embarrassed because of mouth (%)
Oral Health - People with gum disease (%)
Oral Health - General health of teeth and gums (%)
Oral Health - Average days a week using dental floss/device
Oral Health - Average days a week using mouthwash for dental problem
Oral Health - Average number of teeth
Pesticide Use - Households using pesticides to control insects (%)
Pesticide Use - Households using pesticides to kill weeds (%)
Physical Activity - People doing vigorous-intensity work activities (%)
Physical Activity - People doing moderate-intensity work activities (%)
Physical Activity - People walking or bicycling (%)
Physical Activity - People doing vigorous-intensity recreational activities (%)
Physical Activity - People doing moderate-intensity recreational activities (%)
Physical Activity - Average hours a day doing sedentary activities
Physical Activity - Average hours a day watching TV or videos
Physical Activity - Average hours a day using computer
Physical Functioning - People having limitations keeping them from working (%)
Physical Functioning - People limited in amount of work they can do (%)
Physical Functioning - People that need special equipment to walk (%)
Physical Functioning - People experiencing confusion/memory problems (%)
Physical Functioning - People requiring special healthcare equipment (%)
Prescription Medications - Average number of prescription medicines taking
Preventive Aspirin Use - Adults 40+ taking low-dose aspirin (%)
Reproductive Health - Vaginal deliveries (%)
Reproductive Health - Cesarean deliveries (%)
Reproductive Health - Deliveries resulted in a live birth (%)
Reproductive Health - Pregnancies resulted in a delivery (%)
Reproductive Health - Women breastfeeding newborns (%)
Reproductive Health - Women that had a hysterectomy (%)
Reproductive Health - Women that had both ovaries removed (%)
Reproductive Health - Women that have ever taken birth control pills (%)
Reproductive Health - Women taking birth control pills (%)
Reproductive Health - Women that have ever used Depo-Provera or injectables (%)
Reproductive Health - Women that have ever used female hormones (%)
Sexual Behavior - People 18+ that ever had sex (vaginal, anal, or oral) (%)
Sexual Behavior - Males 18+ that ever had vaginal sex with a woman (%)
Sexual Behavior - Males 18+ that ever performed oral sex on a woman (%)
Sexual Behavior - Males 18+ that ever had anal sex with a woman (%)
Sexual Behavior - Males 18+ that ever had any sex with a man (%)
Sexual Behavior - Females 18+ that ever had vaginal sex with a man (%)
Sexual Behavior - Females 18+ that ever performed oral sex on a man (%)
Sexual Behavior - Females 18+ that ever had anal sex with a man (%)
Sexual Behavior - Females 18+ that ever had any kind of sex with a woman (%)
Sexual Behavior - Average age people first had sex
Sexual Behavior - Average number of female sex partners in lifetime (males 18+)
Sexual Behavior - Average number of female vaginal sex partners in lifetime (males 18+)
Sexual Behavior - Average age people first performed oral sex on a woman (18+)
Sexual Behavior - Average number of woman performed oral sex on in lifetime (18+)
Sexual Behavior - Average number of male sex partners in lifetime (males 18+)
Sexual Behavior - Average number of male anal sex partners in lifetime (males 18+)
Sexual Behavior - Average age people first performed oral sex on a man (18+)
Sexual Behavior - Average number of male oral sex partners in lifetime (18+)
Sexual Behavior - People using protection when performing oral sex (%)
Sexual Behavior - Average number of times people have vaginal or anal sex a year
Sexual Behavior - People having sex without condom (%)
Sexual Behavior - Average number of male sex partners in lifetime (females 18+)
Sexual Behavior - Average number of male vaginal sex partners in lifetime (females 18+)
Sexual Behavior - Average number of female sex partners in lifetime (females 18+)
Sexual Behavior - Circumcised males 18+ (%)
Sleep Disorders - Average hours sleeping at night
Sleep Disorders - People that has trouble sleeping (%)
Smoking-Cigarette Use - People smoking cigarettes (%)
Taste & Smell - People 40+ having problems with smell (%)
Taste & Smell - People 40+ having problems with taste (%)
Taste & Smell - People 40+ that ever had wisdom teeth removed (%)
Taste & Smell - People 40+ that ever had tonsils teeth removed (%)
Taste & Smell - People 40+ that ever had a loss of consciousness because of a head injury (%)
Taste & Smell - People 40+ that ever had a broken nose or other serious injury to face or skull (%)
Taste & Smell - People 40+ that ever had two or more sinus infections (%)
Weight - Average height (inches)
Weight - Average weight (pounds)
Weight - Average BMI
Weight - People that are obese (%)
Weight - People that ever were obese (%)
Weight - People trying to lose weight (%)
Urban population: 24,707
Rural population: 18,847
Estimated median house/condo value in 2022: $397,131
76065:
$397,131Texas:
$275,400
According to our research of Texas and other state lists, there were 51 registered sex offenders living in 76065 zip code as of April 27, 2024 . The ratio of all residents to sex offenders in zip code 76065 is 643 to 1.The ratio of registered sex offenders to all residents in this zip code is lower than the state average.
Median resident age: This zip code:
36.8 yearsTexas median age:
35.6 years
Average household size: This zip code:
2.9 peopleTexas:
2.6 people
Averages for the 2020 tax year for zip code 76065, filed in 2021:
Average Adjusted Gross Income (AGI) in 2020: $89,359 (Individual Income Tax Returns) Here:
$89,359State:
$77,054
Salary/wage: $79,095 (reported on 85.5% of returns )Here:
$79,095State:
$62,766
(% of AGI for various income ranges: 1187.5% for AGIs below $25k , 3638.3% for AGIs $25k-50k , 6413.4% for AGIs $50k-75k , 9704.2% for AGIs $75k-100k , 18848.8% for AGIs $100k-200k , 59890.0% for AGIs over 200k ) Taxable interest for individuals: $1,364 (reported on 29.2% of returns )This zip code:
$1,364Texas:
$2,665
(% of AGI for various income ranges: 11.8% for AGIs below $25k , 24.3% for AGIs $25k-50k , 25.9% for AGIs $50k-75k , 38.9% for AGIs $75k-100k , 77.2% for AGIs $100k-200k , 561.5% for AGIs over 200k ) Ordinary dividends: $3,927 (reported on 15.8% of returns )(% of AGI for various income ranges: 19.3% for AGIs below $25k , 24.2% for AGIs $25k-50k , 50.4% for AGIs $50k-75k , 69.7% for AGIs $75k-100k , 146.2% for AGIs $100k-200k , 754.0% for AGIs over 200k ) Net capital gain/loss in AGI: +$17,638 (reported on 15.9% of returns )Here:
+$17,638State:
+$39,590
(% of AGI for various income ranges: 6.6% for AGIs below $25k , 18.2% for AGIs $25k-50k , 65.1% for AGIs $50k-75k , 81.6% for AGIs $75k-100k , 279.1% for AGIs $100k-200k , 7393.4% for AGIs over 200k ) Profit/loss from business: +$11,042 (reported on 20.9% of returns )Here:
+$11,042State:
+$10,888
(% of AGI for various income ranges: 67.6% for AGIs below $25k , 45.6% for AGIs $25k-50k , 112.8% for AGIs $50k-75k , 377.4% for AGIs $75k-100k , 470.0% for AGIs $100k-200k , 3357.1% for AGIs over 200k ) Taxable individual retirement arrangement distribution: $20,857 (reported on 8.2% of returns )76065:
$20,857Texas:
$24,740
(% of AGI for various income ranges: 47.0% for AGIs below $25k , 92.5% for AGIs $25k-50k , 212.2% for AGIs $50k-75k , 269.4% for AGIs $75k-100k , 428.5% for AGIs $100k-200k , 1416.6% for AGIs over 200k ) Self-employed (Keogh) retirement plans: $21,789 (reported on 0.4% of returns )76065:
$21,789Texas:
$29,298
(% of AGI for various income ranges: 17.7% for AGIs $100k-200k , 228.7% for AGIs over 200k ) Total itemized deductions: $36,675 (reported on 13.5% of returns )Here:
$36,675State:
$40,428
(% of AGI for various income ranges: 58.0% for AGIs below $25k , 190.6% for AGIs $25k-50k , 410.9% for AGIs $50k-75k , 688.9% for AGIs $75k-100k , 1164.1% for AGIs $100k-200k , 6265.0% for AGIs over 200k ) Charity contributions: $15,027 (reported on 11.3% of returns )Here:
$15,027State:
$18,201
(% of AGI for various income ranges: 6.6% for AGIs below $25k , 34.9% for AGIs $25k-50k , 78.2% for AGIs $50k-75k , 163.9% for AGIs $75k-100k , 351.1% for AGIs $100k-200k , 3022.6% for AGIs over 200k ) Taxes paid: $8,057 (reported on 13.3% of returns )(% of AGI for various income ranges: 11.2% for AGIs below $25k , 36.3% for AGIs $25k-50k , 99.4% for AGIs $50k-75k , 169.9% for AGIs $75k-100k , 298.6% for AGIs $100k-200k , 1073.4% for AGIs over 200k ) Earned income credit: $2,328 (reported on 10.2% of returns )(% of AGI for various income ranges: 71.5% for AGIs below $25k , 65.1% for AGIs $25k-50k , 1.3% for AGIs $50k-75k ) Percentage of individuals using paid preparers for their 2020 taxes: 93.4%(% for various income ranges: 92.6% for AGIs below $25k , 93.3% for AGIs $25k-50k , 93.1% for AGIs $50k-75k , 93.1% for AGIs $75k-100k , 94.4% for AGIs $100k-200k , 94.4% for AGIs over 200k )
Averages for the 2012 tax year for zip code 76065, filed in 2013:
Average Adjusted Gross Income (AGI) in 2012: $70,067 (Individual Income Tax Returns) Here:
$70,067State:
$65,384
Salary/wage: $62,233 (reported on 88.5% of returns )Here:
$62,233State:
$52,524
(% of AGI for various income ranges: 80.2% for AGIs below $25k , 82.3% for AGIs $25k-50k , 80.8% for AGIs $50k-75k , 82.2% for AGIs $75k-100k , 83.8% for AGIs $100k-200k , 61.4% for AGIs over 200k ) Taxable interest for individuals: $1,037 (reported on 33.4% of returns )This zip code:
$1,037Texas:
$2,372
(% of AGI for various income ranges: 0.9% for AGIs below $25k , 0.6% for AGIs $25k-50k , 0.4% for AGIs $50k-75k , 0.3% for AGIs $75k-100k , 0.4% for AGIs $100k-200k , 0.7% for AGIs over 200k ) Ordinary dividends: $2,825 (reported on 15.3% of returns )(% of AGI for various income ranges: 1.1% for AGIs below $25k , 0.6% for AGIs $25k-50k , 0.5% for AGIs $50k-75k , 0.5% for AGIs $75k-100k , 0.5% for AGIs $100k-200k , 0.9% for AGIs over 200k ) Net capital gain/loss in AGI: +$8,107 (reported on 12.9% of returns )Here:
+$8,107State:
+$35,319
(% of AGI for various income ranges: 0.1% for AGIs $25k-50k , 0.1% for AGIs $50k-75k , 0.2% for AGIs $75k-100k , 0.7% for AGIs $100k-200k , 6.3% for AGIs over 200k ) Profit/loss from business: +$14,414 (reported on 19.7% of returns )Here:
+$14,414State:
+$13,732
(% of AGI for various income ranges: 8.1% for AGIs below $25k , 3.7% for AGIs $25k-50k , 4.3% for AGIs $50k-75k , 3.2% for AGIs $75k-100k , 3.1% for AGIs $100k-200k , 5.6% for AGIs over 200k ) Taxable individual retirement arrangement distribution: $17,393 (reported on 8.7% of returns )76065:
$17,393Texas:
$19,511
(% of AGI for various income ranges: 2.6% for AGIs below $25k , 2.0% for AGIs $25k-50k , 2.6% for AGIs $50k-75k , 2.0% for AGIs $75k-100k , 2.3% for AGIs $100k-200k , 1.6% for AGIs over 200k ) Self-employment retirement plans: $16,986 (reported on 0.5% of returns )76065:
$16,986Texas:
$23,938
Total itemized deductions: $21,318 (19% of AGI, reported on 37.8% of returns )Here:
$21,318State:
$24,724
Here:
18.6% of AGIState:
15.9% of AGI
(% of AGI for various income ranges: 8.2% for AGIs below $25k , 10.4% for AGIs $25k-50k , 12.2% for AGIs $50k-75k , 12.3% for AGIs $75k-100k , 12.9% for AGIs $100k-200k , 9.0% for AGIs over 200k ) Charity contributions: $5,209 (reported on 30.0% of returns )(% of AGI for various income ranges: 0.8% for AGIs below $25k , 1.3% for AGIs $25k-50k , 1.8% for AGIs $50k-75k , 2.1% for AGIs $75k-100k , 2.5% for AGIs $100k-200k , 2.9% for AGIs over 200k ) Taxes paid: $6,048 (reported on 37.3% of returns )(% of AGI for various income ranges: 1.9% for AGIs below $25k , 2.7% for AGIs $25k-50k , 3.3% for AGIs $50k-75k , 3.5% for AGIs $75k-100k , 3.8% for AGIs $100k-200k , 2.4% for AGIs over 200k ) Earned income credit: $2,287 (reported on 13.3% of returns )(% of AGI for various income ranges: 6.4% for AGIs below $25k , 1.2% for AGIs $25k-50k ) Percentage of individuals using paid preparers for their 2012 taxes: 46.5%(% for various income ranges: 41.9% for AGIs below $25k , 44.6% for AGIs $25k-50k , 48.3% for AGIs $50k-75k , 47.5% for AGIs $75k-100k , 49.8% for AGIs $100k-200k , 66.0% for AGIs over 200k )
Averages for the 2004 tax year for zip code 76065, filed in 2005:
Average Adjusted Gross Income (AGI) in 2004: $54,946 (Individual Income Tax Returns) Here:
$54,946State:
$47,881
Salary/wage: $52,041 (reported on 89.0% of returns )Here:
$52,041State:
$41,947
(% of AGI for various income ranges: 226.1% for AGIs below $10k , 78.5% for AGIs $10k-25k , 84.8% for AGIs $25k-50k , 86.9% for AGIs $50k-75k , 89.2% for AGIs $75k-100k , 78.7% for AGIs over 100k ) Taxable interest for individuals: $1,263 (reported on 43.4% of returns )This zip code:
$1,263Texas:
$2,255
(% of AGI for various income ranges: 8.9% for AGIs below $10k , 2.3% for AGIs $10k-25k , 1.1% for AGIs $25k-50k , 0.9% for AGIs $50k-75k , 0.5% for AGIs $75k-100k , 1.0% for AGIs over 100k ) Taxable dividends: $1,377 (reported on 19.7% of returns )(% of AGI for various income ranges: 3.1% for AGIs below $10k , 0.9% for AGIs $10k-25k , 0.5% for AGIs $25k-50k , 0.3% for AGIs $50k-75k , 0.3% for AGIs $75k-100k , 0.6% for AGIs over 100k ) Net capital gain/loss: +$8,608 (reported on 16.9% of returns )Here:
+$8,608State:
+$16,110
(% of AGI for various income ranges: -3.8% for AGIs below $10k , 0.0% for AGIs $10k-25k , 0.4% for AGIs $25k-50k , 0.5% for AGIs $50k-75k , 1.2% for AGIs $75k-100k , 5.9% for AGIs over 100k ) Profit/loss from business: +$10,791 (reported on 20.4% of returns )Here:
+$10,791State:
+$11,013
(% of AGI for various income ranges: 9.4% for AGIs below $10k , 9.1% for AGIs $10k-25k , 4.5% for AGIs $25k-50k , 2.6% for AGIs $50k-75k , 2.8% for AGIs $75k-100k , 4.5% for AGIs over 100k ) IRA payment deduction: $3,083 (reported on 2.8% of returns )(% of AGI for various income ranges: 0.3% for AGIs $10k-25k , 0.3% for AGIs $25k-50k , 0.1% for AGIs $50k-75k , 0.1% for AGIs $75k-100k , 0.1% for AGIs over 100k ) Self-employed pension: $15,192 (reported on 0.5% of returns )Here:
$15,192Texas:
$16,401
Total itemized deductions: $18,121 (21% of AGI, reported on 42.2% of returns )Here:
$18,121State:
$19,631
Here:
21.2% of AGIState:
18.9% of AGI
(% of AGI for various income ranges: 18.8% for AGIs below $10k , 10.0% for AGIs $10k-25k , 13.8% for AGIs $25k-50k , 14.6% for AGIs $50k-75k , 15.1% for AGIs $75k-100k , 13.4% for AGIs over 100k ) Charity contributions deductions: $3,883 (4% of AGI, reported on 34.9% of returns )Here:
4.3% of AGIState:
4.2% of AGI
(% of AGI for various income ranges: 1.3% for AGIs below $10k , 1.3% for AGIs $10k-25k , 1.9% for AGIs $25k-50k , 2.2% for AGIs $50k-75k , 2.4% for AGIs $75k-100k , 3.1% for AGIs over 100k ) Total tax: $7,713 (reported on 79.7% of returns )(% of AGI for various income ranges: 6.4% for AGIs below $10k , 4.7% for AGIs $10k-25k , 6.5% for AGIs $25k-50k , 8.2% for AGIs $50k-75k , 9.9% for AGIs $75k-100k , 16.3% for AGIs over 100k ) Earned income credit: $1,756 (reported on 11.1% of returns )Percentage of individuals using paid preparers for their 2004 taxes: 50.9%(% for various income ranges: 40.4% for AGIs below $10k , 54.4% for AGIs $10k-25k , 53.1% for AGIs $25k-50k , 52.3% for AGIs $50k-75k , 48.2% for AGIs $75k-100k , 56.4% for AGIs over 100k )
Estimated median household income in 2022: This zip code:
$119,818Texas:
$72,284
Nearest zip codes: 76084 ,
75104 ,
75054 ,
75167 ,
75249 ,
76064 .
Waxahachie Zip Code Map
Percentage of family households: This zip code:
65.0%Texas:
50.5%
Percentage of households with unmarried partners: This zip code:
2.8%Texas:
48.7%
Likely homosexual households (counted as self-reported same-sex unmarried-partner households)
Lesbian couples: 0.3% of all households Gay men: 0.1% of all households
Household received Food Stamps/SNAP in the past 12 months: 589Household did not receive Food Stamps/SNAP in the past 12 months: 14,168
Women who had a birth in the past 12 months: 468 (415 now married , 58 unmarried) Women who did not have a birth in the past 12 months: 10,190 (5,363 now married , 4,798 unmarried)
Housing units in zip code 76065 with a mortgage: 8,873 (463
second mortgage , 215
both second mortgage and home equity loan )
Houses without a mortgage: 213
Median monthly owner costs for units with a mortgage: $2,316
Median monthly owner costs for units without a mortgage: $749
Residents with income below the poverty level in 2022:
This zip code:
5.4%Whole state:
14.0%
Residents with income below 50% of the poverty level in 2022:
This zip code:
3.5%Whole state:
7.4%
Median number of rooms in houses and condos: Median number of rooms in apartments: Notable locations in this zip code not listed on our city pages
Click to draw/clear zip code borders Notable locations in zip code 76065: (A) , Diamond J Ranch (B) , Singleton Farm (C) , Midlothian Fire Department (D) , Midlothian Fire Department Station 2 (E) . Display/hide their locations on the map
Churches in zip code 76065 include: (A) , Power House Church of God and Christ (B) , Mount Pleasant Baptist Church (C) , Meadow View Baptist Church (D) , Greater Unity Missionary Baptist Church (E) , Shiloh Cumberland Church (F) , True Vine Church (G) , Hopewell Church (H) . Display/hide their locations on the map
Cemeteries: (1) , Mount Zion Cemetery (2) , Newton Cemetery (3) , Shiloh Cemetery (4) . Display/hide their locations on the map
Lakes and reservoirs: (A) , Soil Conservation Service Site 8 Reservoir (B) , Soil Conservation Service Site 1 Reservoir (C) , Soil Conservation Service Site 2b Reservoir (D) , Soil Conservation Service Site 11 Reservoir (E) , Gifford-Hill Lake (F) , Cement Plant Lake (G) , Crossroads Lake (H) . Display/hide their locations on the map
Streams, rivers, and creeks: (A) , Shiloh Branch (B) , Sanders Branch (C) , Powers Branch (D) , North Prong Creek (E) , Newton Branch (F) , Lone Elm Branch (G) , Cottonwood Creek (H) . Display/hide their locations on the map
Park in zip code 76065: (1) . Display/hide its location on the map
Year house built (houses)
299 2020 or later5,164 2010 to 20194,850 2000 to 20091,773 1990 to 19991,417 1980 to 1989968 1970 to 1979515 1960 to 1969210 1950 to 195987 1940 to 1949235 1939 or earlier
Zip code 76065 household income distribution in 2022 252 Less than $10,000210 $10,000 to $14,99971 $15,000 to $19,999124 $20,000 to $24,999760 $25,000 to $29,999309 $30,000 to $34,999226 $35,000 to $39,999205 $40,000 to $44,999253 $45,000 to $49,999711 $50,000 to $59,9991,040 $60,000 to $74,9991,725 $75,000 to $99,9991,697 $100,000 to $124,9991,776 $125,000 to $149,9992,887 $150,000 to $199,9992,451 $200,000 or moreEstimate of home value of owner-occupied houses/condos in 2022 in zip code 76065 74 Less than $10,000116 $15,000 to $19,99970 $20,000 to $24,99915 $25,000 to $29,99912 $30,000 to $34,99911 $35,000 to $39,99940 $40,000 to $49,99947 $50,000 to $59,9997 $60,000 to $69,99924 $70,000 to $79,99963 $80,000 to $89,99935 $90,000 to $99,999203 $100,000 to $124,999163 $125,000 to $149,999300 $150,000 to $174,999551 $175,000 to $199,9991,084 $200,000 to $249,9991,531 $250,000 to $299,9993,859 $300,000 to $399,9992,405 $400,000 to $499,9992,206 $500,000 to $749,999443 $750,000 to $999,999268 $1,000,000 to $1,499,99913 $1,500,000 to $1,999,999100 $2,000,000 or moreRent paid by renters in 2022 in zip code 76065 4 $250 to $29915 $500 to $5497 $550 to $59918 $650 to $6996 $700 to $749173 $800 to $899200 $900 to $999335 $1,000 to $1,249537 $1,250 to $1,499580 $1,500 to $1,999350 $2,000 to $2,49933 $2,500 to $2,99926 $3,000 to $3,499131 No cash rent
Median gross rent in 2022: $1,569.
Median price asked for vacant for-sale houses and condos in 2022: $353,039.
Estimated median house (or condo) value in 2022 for: White Non-Hispanic householders: $441,428Black or African American householders: $233,425American Indian or Alaska Native householders: $250,373Some other race householders: $296,981Two or more races householders: $433,339Hispanic or Latino householders: $298,137Estimated median house or condo value in 2022: $397,131
76065:
$397,131Texas:
$275,400
Lower value quartile - upper value quartile: $283,501 - $521,741
Housing units in structures:
One, detached: 13,041One, attached: 254Two: 1273 or 4: 865 to 9: 33610 to 19: 13920 to 49: 23250 or more: 407Mobile homes: 557Boats, RVs, vans, etc.: 35Unemployment : 2.4%
Means of transportation to work in zip code 76065 75.6% 17,241 Drove a car alone7.0% 1,604 Carpooled0.1% 31 Bus or trolley bus0.1% 21 Motorcycle0.0% 7 Bicycle0.5% 116 Walked0.8% 174 Other means15.9% 3,626 Worked at homeTravel time to work (commute) in zip code 76065 503 Less than 5 minutes1,409 5 to 9 minutes1,205 10 to 14 minutes2,283 15 to 19 minutes2,025 20 to 24 minutes1,434 25 to 29 minutes3,203 30 to 34 minutes1,199 35 to 39 minutes1,160 40 to 44 minutes2,822 45 to 59 minutes1,640 60 to 89 minutes388 90 or more minutes
Percentage of zip code residents living and working in this county: 46.5%
Household type by relationship:
Households: 43,555
Male householders: 7,484 (671 living alone ), Female householders: 7,330 (1,145 living alone )9,609 spouses (9,586 opposite-sex spouses ), 982 unmarried partners , (868 opposite-sex unmarried partners ), 14,644 children (13,261 natural , 677 adopted , 711 stepchildren ), 1,106 grandchildren , 230 brothers or sisters , 567 parents , 8 foster children , 871 other relatives , 719 non-relatives In group quarters: 34 (-1 institutionalized population )
Size of family households: 4,967 2-persons , 2,714 3-persons , 3,027 4-persons , 1,032 5-persons , 486 6-persons , 230 7-or-more-persons
Size of nonfamily households: 1,814 1-person , 433 2-persons
8,193 married couples with children. single-parent households (596 men , 1,947 women ).
89.9% of residents of 76065 zip code speak English at home. of residents speak Spanish at home (72% very well, 16% well, 11% not well, 1% not at all ).of residents speak other Indo-European language at home (80% very well, 17% well, 4% not well ).of residents speak Asian or Pacific Island language at home (80% very well, 20% well ).of residents speak other language at home (80% very well, 20% not well ).
Foreign born population: 2,029 (4.7%)
(50.5%
of them are naturalized citizens )
This zip code:
4.7%Whole state:
17.2%
50% Honduras 4% Sweden 4% United Kingdom, excluding England and Scotland 4% El Salvador 3% Costa Rica 3% Belgium 3% Bolivia 20% American 11% English 7% German 5% Irish 3% European 2% Italian 1% Scottish
Year of entry for the foreign-born population
788 2010 or later 544 2000 to 2009 514 1990 to 1999 647 Before 1990
Facilities with environmental interests located in this zip code:
AIR PRODUCTS INC. CORP. (310 WARD RD. in MIDLOTHIAN, TX)
(Resource Conservation and Recovery Act (tracking hazardous waste)) TRI REPORTER (Tracking of toxic chemicals releasing facilities) Business SIC classification: INDUSTRIAL GASESOrganizations: AIR PRODUCTS LP (CONTACT/OPERATOR)
AMERICAN TELEPHONE AND TELEGRAPH CORPORA (3.5M SW L432340 in MIDLOTHIAN, TX)
(Resource Conservation and Recovery Act (tracking hazardous waste)) Alternative names: AMERICAN TEL & TEL CO LONG LINES, AMERICAN TEL & TEL CO LONG LINES
AMERICAN STEEL TRANSPORT (280 WARD RD in MIDLOTHIAN, TX)
(Resource Conservation and Recovery Act (tracking hazardous waste)) Organizations: TXI (CONTACT/OWNER)
Alternative names: AMERICA STEEL TRANSPORT INC
Housing units lacking complete plumbing facilities: 2.6%
Housing units lacking complete kitchen facilities: 1.7%
80.2% Electricity 14.1% Utility gas 5.0% Bottled, tank, or LP gas
Population in 1990: 10,271. Population change in the 1990s: +6,250 (+60.9%).
Place of birth for U.S.-born residents:
This state: 28,916Northeast: 1,210Midwest: 3,590South: 4,060West: 3,195
49% of the 76065 zip code residents lived in the same house 5 years ago.
Out of people who lived in different houses, 29% lived in this county.
Out of people who lived in different counties, 50% lived in Texas.
90% of the 76065 zip code residents lived in the same house 1 year ago.
Out of people who lived in different houses, 25% moved from this county.
Out of people who lived in different houses, 56% moved from different county within same state.
Out of people who lived in different houses, 19% moved from different state.
Out of people who lived in different houses, 3% moved from abroad.
Private vs. public school enrollment:
Students in private schools in grades 1 to 8 (elementary and middle school): 381
Students in private schools in grades 9 to 12 (high school): 160
Students in private undergraduate colleges: 154
Occupation by median earnings in the past 12 months ($)
106,571 Life, physical, and social science occupations 105,154 Computer and mathematical occupations 97,653 Law enforcement workers including supervisors 92,782 Fire fighting and prevention, and other protective service workers including supervisors 90,372 Management occupations 88,183 Legal occupations
Companies with federal contracts located in this zip code (MIDLOTHIAN, TX):
CHAPARRAL STEEL MIDLOTHIAN LP (300 WARD RD)
$186,204 with U.S. Army Corps of Engineers - civil program financing only for Iron and Steel Primary and Semifinished Products. Signed on 2003-03-29. Completion date: 2003-06-27.
VISIONARY PRODUCTS (3950 JOE WILSON RD; small business)
$29,400 with Defense Logistics Agency for Switches. Signed on 2004-09-10. Completion date: 2004-09-19.
SAFE TIRE DISPOSAL CORP OF TEX (3351 S WYATT RD; small business) in 3 contracts in 1999
$9,506 with Air Force for Trash/Garbage Collection Services - Including Portable Sanitation Services. Signed on 1999-10-01. Completion date: 2000-09-30.
, same as above. Signed on 1999-11-30. Completion date: 1999-11-30.
, same as above. Signed on 1999-11-30. Completion date: 1999-11-30.
FEEMSTER, JIMMY GROVER (2895 E HIGHWAY 287; small business)
$6,874 with Army for Prefabricated and Portable Buildings. Signed on 2004-04-14. Completion date: 2004-05-14.
SHAW DOLORES (1191 BRYSON LANE; small business)
$3,636 with Army for Recreation Site Maintenance Services (non-construction). Signed on 2004-03-17. Completion date: 2004-04-01.
CARLISLE, KAREN (2009 HIGHRIDGE LN; small business)
$3,144 with Defense Logistics Agency for Nuts and Washers. Signed on 2005-10-17. Completion date: 2005-11-07.
Top industries in this zip code by the number of employees in 2005:
Accommodation and Food Services: Full-Service Restaurants (50-99 employees: 2 establishments, 20-49 employees: 3 establishments, 5-9 employees: 5 establishments, 1-4 employees: 1 establishment)Other Services (except Public Administration): Religious Organizations (50-99: 1, 20-49: 2, 10-19: 3, 5-9: 3, 1-4: 5)Management of Companies and Enterprises: Corporate, Subsidiary, and Regional Managing Offices (100-249: 1, 1-4: 2)Accommodation and Food Services: Limited-Service Restaurants (20-49: 4, 10-19: 1, 5-9: 1, 1-4: 6)Health Care and Social Assistance: Child Day Care Services (20-49: 4, 10-19: 1, 5-9: 1, 1-4: 1)
People in group quarters in 2010:
6 people in residential treatment centers for adults
Fatal accident statistics in 2014:
Fatal accident count: 4Vehicles involved in fatal accidents: 7Fatal accidents caused by drunken drivers: 1Fatalities: 4Persons involved in fatal accidents: 7Pedestrians involved in fatal accidents: 0
Fatal accident statistics in 2013:
Fatal accident count: 4Vehicles involved in fatal accidents: 7Fatal accidents caused by drunken drivers: 0Fatalities: 4Persons involved in fatal accidents: 7Pedestrians involved in fatal accidents: 0
Home Mortgage Disclosure Act Aggregated Statistics For Year 2009(Based on 2 full and 6 partial tracts) A) FHA, FSA/RHS & VA B) Conventional C) Refinancings D) Home Improvement Loans F) Non-occupant Loans on G) Loans On Manufactured Number Average Value Number Average Value Number Average Value Number Average Value Number Average Value Number Average Value
LOANS ORIGINATED 412 $163,398 298 $171,608 865 $167,602 72 $59,645 73 $126,621 12 $74,791 APPLICATIONS APPROVED, NOT ACCEPTED 18 $185,383 22 $184,246 94 $175,904 13 $27,473 4 $99,712 8 $47,850 APPLICATIONS DENIED 61 $161,815 53 $172,867 346 $157,418 80 $54,468 23 $100,407 21 $44,717 APPLICATIONS WITHDRAWN 42 $180,898 42 $225,894 217 $180,971 13 $42,623 12 $116,773 0 $0 FILES CLOSED FOR INCOMPLETENESS 5 $169,354 8 $174,969 54 $183,106 5 $101,566 2 $130,065 2 $37,365
Aggregated Statistics For Year 2008(Based on 2 full and 6 partial tracts) A) FHA, FSA/RHS & VA B) Conventional C) Refinancings D) Home Improvement Loans E) Loans on Dwellings For 5+ Families F) Non-occupant Loans on G) Loans On Manufactured Number Average Value Number Average Value Number Average Value Number Average Value Number Average Value Number Average Value Number Average Value
LOANS ORIGINATED 320 $162,201 509 $166,687 498 $159,112 130 $47,291 0 $0 103 $124,264 21 $70,799 APPLICATIONS APPROVED, NOT ACCEPTED 14 $172,904 75 $182,585 85 $159,544 22 $86,528 2 $214,875 11 $112,446 16 $74,154 APPLICATIONS DENIED 58 $164,310 151 $224,737 336 $155,736 141 $38,759 0 $0 36 $120,585 23 $66,603 APPLICATIONS WITHDRAWN 32 $164,654 74 $188,392 144 $158,662 23 $55,997 0 $0 7 $170,206 4 $61,868 FILES CLOSED FOR INCOMPLETENESS 15 $152,179 26 $335,459 33 $150,271 2 $27,025 0 $0 11 $272,146 0 $0
Aggregated Statistics For Year 2007(Based on 2 full and 6 partial tracts) A) FHA, FSA/RHS & VA B) Conventional C) Refinancings D) Home Improvement Loans E) Loans on Dwellings For 5+ Families F) Non-occupant Loans on G) Loans On Manufactured Number Average Value Number Average Value Number Average Value Number Average Value Number Average Value Number Average Value Number Average Value
LOANS ORIGINATED 199 $145,811 1,162 $153,911 497 $167,986 158 $53,620 2 $4,999,500 154 $120,797 35 $82,895 APPLICATIONS APPROVED, NOT ACCEPTED 15 $136,352 200 $162,831 117 $159,412 44 $63,686 0 $0 13 $86,670 19 $62,119 APPLICATIONS DENIED 22 $122,481 357 $203,277 438 $159,429 156 $39,124 0 $0 50 $124,027 24 $59,137 APPLICATIONS WITHDRAWN 14 $158,312 151 $179,820 201 $145,921 17 $50,108 0 $0 25 $218,822 3 $126,060 FILES CLOSED FOR INCOMPLETENESS 2 $109,235 45 $226,043 62 $166,190 8 $35,766 0 $0 5 $93,552 0 $0
Aggregated Statistics For Year 2006(Based on 2 full and 6 partial tracts) A) FHA, FSA/RHS & VA B) Conventional C) Refinancings D) Home Improvement Loans F) Non-occupant Loans on G) Loans On Manufactured Number Average Value Number Average Value Number Average Value Number Average Value Number Average Value Number Average Value
LOANS ORIGINATED 202 $148,386 1,677 $119,178 482 $147,746 136 $46,276 222 $95,164 31 $72,088 APPLICATIONS APPROVED, NOT ACCEPTED 10 $130,342 234 $117,446 93 $125,130 38 $40,922 28 $130,673 27 $66,720 APPLICATIONS DENIED 24 $133,400 422 $132,418 424 $120,861 139 $45,126 71 $100,272 48 $64,425 APPLICATIONS WITHDRAWN 52 $127,974 219 $119,545 268 $140,957 16 $83,444 30 $89,952 4 $55,522 FILES CLOSED FOR INCOMPLETENESS 0 $0 29 $143,937 115 $142,000 6 $68,393 4 $141,268 0 $0
Aggregated Statistics For Year 2005(Based on 2 full and 6 partial tracts) A) FHA, FSA/RHS & VA B) Conventional C) Refinancings D) Home Improvement Loans E) Loans on Dwellings For 5+ Families F) Non-occupant Loans on G) Loans On Manufactured Number Average Value Number Average Value Number Average Value Number Average Value Number Average Value Number Average Value Number Average Value
LOANS ORIGINATED 231 $132,766 1,540 $109,453 681 $139,004 139 $83,497 4 $1,211,880 180 $84,214 42 $81,848 APPLICATIONS APPROVED, NOT ACCEPTED 13 $140,223 215 $100,615 102 $124,754 51 $30,454 0 $0 22 $81,944 33 $49,491 APPLICATIONS DENIED 42 $110,470 394 $110,250 554 $118,979 153 $41,263 0 $0 85 $105,278 66 $60,733 APPLICATIONS WITHDRAWN 32 $130,973 179 $128,426 368 $139,269 50 $177,838 0 $0 25 $121,891 12 $83,588 FILES CLOSED FOR INCOMPLETENESS 3 $135,790 42 $112,898 191 $147,272 7 $75,344 0 $0 10 $146,527 0 $0
Aggregated Statistics For Year 2004(Based on 2 full and 6 partial tracts) A) FHA, FSA/RHS & VA B) Conventional C) Refinancings D) Home Improvement Loans F) Non-occupant Loans on G) Loans On Manufactured Number Average Value Number Average Value Number Average Value Number Average Value Number Average Value Number Average Value
LOANS ORIGINATED 268 $133,650 1,137 $112,043 862 $132,803 141 $46,256 132 $93,437 44 $86,325 APPLICATIONS APPROVED, NOT ACCEPTED 16 $93,453 103 $109,166 113 $137,947 36 $37,570 17 $106,454 16 $69,883 APPLICATIONS DENIED 34 $105,501 182 $114,600 589 $114,138 132 $44,297 60 $87,796 38 $63,447 APPLICATIONS WITHDRAWN 48 $128,079 142 $108,134 363 $120,561 20 $56,273 11 $122,711 16 $82,527 FILES CLOSED FOR INCOMPLETENESS 1 $100,960 51 $123,085 235 $138,718 2 $101,290 16 $101,272 0 $0
Aggregated Statistics For Year 2003(Based on 2 full and 6 partial tracts) A) FHA, FSA/RHS & VA B) Conventional C) Refinancings D) Home Improvement Loans E) Loans on Dwellings For 5+ Families F) Non-occupant Loans on Number Average Value Number Average Value Number Average Value Number Average Value Number Average Value Number Average Value
LOANS ORIGINATED 273 $124,879 743 $122,207 1,823 $121,383 133 $35,748 0 $0 93 $81,952 APPLICATIONS APPROVED, NOT ACCEPTED 11 $125,223 96 $118,042 207 $108,909 32 $37,202 0 $0 7 $99,967 APPLICATIONS DENIED 29 $119,084 131 $97,034 655 $109,622 106 $32,577 4 $1,019,588 22 $82,553 APPLICATIONS WITHDRAWN 33 $112,142 150 $112,065 359 $114,484 13 $48,072 0 $0 19 $76,595 FILES CLOSED FOR INCOMPLETENESS 12 $118,547 48 $126,145 68 $127,312 5 $76,028 0 $0 4 $62,210
Aggregated Statistics For Year 2002(Based on 2 full and 4 partial tracts) A) FHA, FSA/RHS & VA B) Conventional C) Refinancings D) Home Improvement Loans F) Non-occupant Loans on Number Average Value Number Average Value Number Average Value Number Average Value Number Average Value
LOANS ORIGINATED 373 $116,404 666 $105,775 810 $115,165 144 $28,136 72 $82,065 APPLICATIONS APPROVED, NOT ACCEPTED 11 $106,205 63 $95,321 99 $90,026 46 $37,938 6 $66,448 APPLICATIONS DENIED 25 $116,066 99 $78,469 233 $91,879 89 $23,997 17 $60,141 APPLICATIONS WITHDRAWN 38 $109,737 98 $98,242 185 $108,018 10 $9,988 8 $57,281 FILES CLOSED FOR INCOMPLETENESS 23 $110,747 52 $94,741 114 $104,588 0 $0 2 $66,995
Aggregated Statistics For Year 2001(Based on 2 full and 4 partial tracts) A) FHA, FSA/RHS & VA B) Conventional C) Refinancings D) Home Improvement Loans E) Loans on Dwellings For 5+ Families F) Non-occupant Loans on Number Average Value Number Average Value Number Average Value Number Average Value Number Average Value Number Average Value
LOANS ORIGINATED 329 $107,092 526 $90,525 631 $111,457 108 $22,124 2 $549,945 49 $76,742 APPLICATIONS APPROVED, NOT ACCEPTED 22 $117,263 76 $79,261 52 $109,427 17 $30,361 0 $0 2 $108,340 APPLICATIONS DENIED 30 $108,814 160 $62,641 153 $83,230 69 $17,809 0 $0 8 $35,759 APPLICATIONS WITHDRAWN 28 $106,759 60 $104,787 110 $87,182 4 $15,512 2 $25,995 3 $141,530 FILES CLOSED FOR INCOMPLETENESS 5 $121,260 30 $74,643 35 $115,134 0 $0 0 $0 2 $50,820
Aggregated Statistics For Year 2000(Based on 2 full and 4 partial tracts) A) FHA, FSA/RHS & VA B) Conventional C) Refinancings D) Home Improvement Loans E) Loans on Dwellings For 5+ Families F) Non-occupant Loans on Number Average Value Number Average Value Number Average Value Number Average Value Number Average Value Number Average Value
LOANS ORIGINATED 276 $105,676 596 $94,152 177 $102,593 137 $24,506 7 $1,759,336 42 $56,611 APPLICATIONS APPROVED, NOT ACCEPTED 11 $96,355 118 $79,818 41 $119,747 48 $18,797 0 $0 4 $39,622 APPLICATIONS DENIED 13 $70,038 253 $50,091 101 $78,403 96 $18,728 0 $0 4 $98,898 APPLICATIONS WITHDRAWN 23 $98,284 69 $99,798 65 $94,702 4 $11,445 0 $0 7 $32,840 FILES CLOSED FOR INCOMPLETENESS 2 $97,060 15 $85,796 29 $89,637 0 $0 0 $0 3 $98,557
Aggregated Statistics For Year 1999(Based on 1 full and 3 partial tracts) A) FHA, FSA/RHS & VA B) Conventional C) Refinancings D) Home Improvement Loans F) Non-occupant Loans on Number Average Value Number Average Value Number Average Value Number Average Value Number Average Value
LOANS ORIGINATED 127 $95,951 357 $98,460 226 $96,259 72 $21,141 22 $60,793 APPLICATIONS APPROVED, NOT ACCEPTED 2 $137,640 97 $68,633 58 $136,921 34 $17,726 10 $51,565 APPLICATIONS DENIED 14 $99,602 298 $51,702 62 $91,269 64 $17,386 22 $49,810 APPLICATIONS WITHDRAWN 12 $91,204 39 $93,747 68 $80,905 5 $24,526 1 $44,320 FILES CLOSED FOR INCOMPLETENESS 3 $70,343 9 $111,604 18 $106,428 3 $15,673 0 $0
Detailed HMDA statistics for the following Tracts:
0602.05
,
0607.00 ,
0608.00 ,
0609.00
Private Mortgage Insurance Companies Aggregated Statistics For Year 2009(Based on 2 full and 6 partial tracts) A) Conventional B) Refinancings C) Non-occupant Loans on Number Average Value Number Average Value Number Average Value
LOANS ORIGINATED 59 $204,029 43 $208,065 1 $118,230 APPLICATIONS APPROVED, NOT ACCEPTED 21 $205,330 11 $222,395 1 $172,320 APPLICATIONS DENIED 18 $344,429 16 $221,144 0 $0 APPLICATIONS WITHDRAWN 12 $268,081 2 $303,425 0 $0 FILES CLOSED FOR INCOMPLETENESS 1 $260,370 1 $96,310 0 $0
Aggregated Statistics For Year 2008(Based on 2 full and 6 partial tracts) A) Conventional B) Refinancings C) Non-occupant Loans on D) Loans On Manufactured Number Average Value Number Average Value Number Average Value Number Average Value
LOANS ORIGINATED 194 $185,330 50 $194,176 30 $143,136 0 $0 APPLICATIONS APPROVED, NOT ACCEPTED 62 $267,134 34 $189,896 11 $126,257 4 $73,728 APPLICATIONS DENIED 18 $231,293 3 $250,940 7 $198,739 0 $0 APPLICATIONS WITHDRAWN 4 $161,098 0 $0 0 $0 0 $0 FILES CLOSED FOR INCOMPLETENESS 4 $180,938 2 $214,015 0 $0 0 $0
Aggregated Statistics For Year 2007(Based on 2 full and 6 partial tracts) A) Conventional B) Refinancings C) Non-occupant Loans on Number Average Value Number Average Value Number Average Value
LOANS ORIGINATED 259 $175,374 46 $172,094 25 $156,473 APPLICATIONS APPROVED, NOT ACCEPTED 33 $169,118 15 $251,824 1 $118,230 APPLICATIONS DENIED 7 $131,110 1 $209,220 0 $0 APPLICATIONS WITHDRAWN 17 $189,294 1 $285,060 0 $0 FILES CLOSED FOR INCOMPLETENESS 0 $0 0 $0 0 $0
Aggregated Statistics For Year 2006(Based on 2 full and 6 partial tracts) A) Conventional B) Refinancings C) Non-occupant Loans on Number Average Value Number Average Value Number Average Value
LOANS ORIGINATED 110 $165,814 30 $194,360 10 $89,167 APPLICATIONS APPROVED, NOT ACCEPTED 24 $229,787 13 $184,021 4 $82,410 APPLICATIONS DENIED 9 $217,570 2 $157,290 0 $0 APPLICATIONS WITHDRAWN 4 $317,148 4 $230,050 2 $266,975 FILES CLOSED FOR INCOMPLETENESS 2 $120,330 0 $0 0 $0
Aggregated Statistics For Year 2005(Based on 2 full and 6 partial tracts) A) Conventional B) Refinancings C) Non-occupant Loans on D) Loans On Manufactured Number Average Value Number Average Value Number Average Value Number Average Value
LOANS ORIGINATED 107 $157,216 41 $155,813 17 $86,421 4 $71,120 APPLICATIONS APPROVED, NOT ACCEPTED 26 $153,283 8 $232,934 3 $110,553 2 $98,990 APPLICATIONS DENIED 5 $201,826 4 $113,068 1 $217,170 0 $0 APPLICATIONS WITHDRAWN 7 $151,369 4 $187,522 2 $63,605 0 $0 FILES CLOSED FOR INCOMPLETENESS 1 $83,690 1 $257,690 1 $147,430 0 $0
Aggregated Statistics For Year 2004(Based on 2 full and 6 partial tracts) A) Conventional B) Refinancings C) Non-occupant Loans on D) Loans On Manufactured Number Average Value Number Average Value Number Average Value Number Average Value
LOANS ORIGINATED 150 $148,058 71 $145,394 22 $121,446 6 $85,405 APPLICATIONS APPROVED, NOT ACCEPTED 21 $176,718 29 $158,828 1 $65,860 2 $103,365 APPLICATIONS DENIED 0 $0 0 $0 0 $0 0 $0 APPLICATIONS WITHDRAWN 1 $228,240 4 $167,328 1 $149,440 0 $0 FILES CLOSED FOR INCOMPLETENESS 2 $163,985 2 $164,735 0 $0 0 $0
Aggregated Statistics For Year 2003(Based on 2 full and 6 partial tracts) A) Conventional B) Refinancings C) Non-occupant Loans on Number Average Value Number Average Value Number Average Value
LOANS ORIGINATED 161 $144,495 171 $147,942 16 $75,126 APPLICATIONS APPROVED, NOT ACCEPTED 29 $144,893 44 $164,872 7 $94,046 APPLICATIONS DENIED 0 $0 3 $199,617 0 $0 APPLICATIONS WITHDRAWN 8 $129,792 12 $181,355 3 $130,897 FILES CLOSED FOR INCOMPLETENESS 0 $0 2 $111,760 0 $0
Aggregated Statistics For Year 2002(Based on 2 full and 4 partial tracts) A) Conventional B) Refinancings C) Non-occupant Loans on Number Average Value Number Average Value Number Average Value
LOANS ORIGINATED 159 $124,361 88 $156,461 12 $65,301 APPLICATIONS APPROVED, NOT ACCEPTED 17 $120,709 8 $122,895 0 $0 APPLICATIONS DENIED 4 $91,118 5 $91,450 5 $91,450 APPLICATIONS WITHDRAWN 9 $169,592 10 $155,907 0 $0 FILES CLOSED FOR INCOMPLETENESS 0 $0 0 $0 0 $0
Aggregated Statistics For Year 2001(Based on 2 full and 4 partial tracts) A) Conventional B) Refinancings C) Non-occupant Loans on Number Average Value Number Average Value Number Average Value
LOANS ORIGINATED 110 $111,198 64 $139,128 11 $94,953 APPLICATIONS APPROVED, NOT ACCEPTED 13 $106,800 22 $126,074 3 $69,907 APPLICATIONS DENIED 2 $91,990 2 $98,805 0 $0 APPLICATIONS WITHDRAWN 2 $88,045 4 $86,992 0 $0 FILES CLOSED FOR INCOMPLETENESS 2 $47,415 2 $95,405 0 $0
Aggregated Statistics For Year 2000(Based on 2 full and 4 partial tracts) A) Conventional B) Refinancings C) Non-occupant Loans on Number Average Value Number Average Value Number Average Value
LOANS ORIGINATED 138 $112,156 19 $137,407 6 $51,567 APPLICATIONS APPROVED, NOT ACCEPTED 22 $108,372 7 $149,164 0 $0 APPLICATIONS DENIED 2 $168,065 5 $135,114 0 $0 APPLICATIONS WITHDRAWN 4 $173,760 2 $99,735 0 $0 FILES CLOSED FOR INCOMPLETENESS 2 $174,480 2 $93,610 0 $0
Aggregated Statistics For Year 1999(Based on 1 full and 3 partial tracts) A) Conventional B) Refinancings C) Non-occupant Loans on Number Average Value Number Average Value Number Average Value
LOANS ORIGINATED 92 $126,946 37 $130,884 1 $77,300 APPLICATIONS APPROVED, NOT ACCEPTED 4 $128,292 8 $161,088 0 $0 APPLICATIONS DENIED 5 $87,050 2 $234,950 0 $0 APPLICATIONS WITHDRAWN 5 $117,022 4 $131,375 0 $0 FILES CLOSED FOR INCOMPLETENESS 2 $97,525 1 $204,860 0 $0
Detailed PMIC statistics for the following Tracts:
0602.05
,
0607.00 ,
0608.00 ,
0609.00
2002 - 2018 National Fire Incident Reporting System (NFIRS) incidents See full 2006 National Fire Incident Reporting System statistics for zip code 76065, Texas
Most common first names in zip code 76065 among deceased individuals Name Count Lived (average)
Mary 66 78.2 years James 60 74.9 years William 53 75.9 years John 42 77.6 years Robert 34 69.3 years George 25 78.9 years Dorothy 24 74.5 years Charles 24 74.7 years Ruby 21 83.8 years Helen 17 77.6 years
Most common last names in zip code 76065 among deceased individuals Last name Count Lived (average)
Smith 26 72.4 years Hayes 20 80.0 years Brown 16 78.2 years Jones 15 78.3 years Davis 13 72.2 years Witherspoon 12 84.4 years Anderson 12 79.1 years Williams 11 63.4 years Johnson 11 79.2 years West 11 75.1 years
Businesses in zip code 76065
Name Count Name Count
Ace Hardware 1 Lane Furniture 1 Arby's 1 Little Caesars Pizza 1 AutoZone 1 McDonald's 1 Blockbuster 1 Penske 1 CVS 1 Pizza Hut 1 Church's Chicken 1 SONIC Drive-In 2 Curves 1 Sprint Nextel 1 Dairy Queen 1 Starbucks 1 Domino's Pizza 1 Subway 1 FedEx 4 T-Mobile 1 GameStop 1 Taco Bell 1 H&R Block 1 U-Haul 3 Jack In The Box 1 UPS 2 Jones New York 1 Walgreens 1 KFC 1 Walmart 1

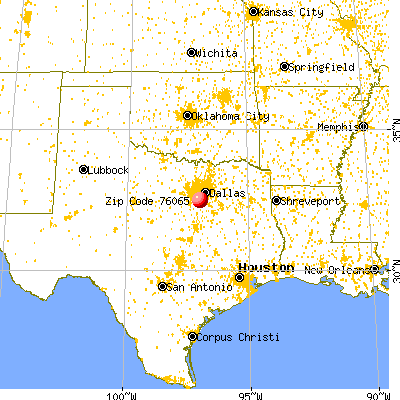


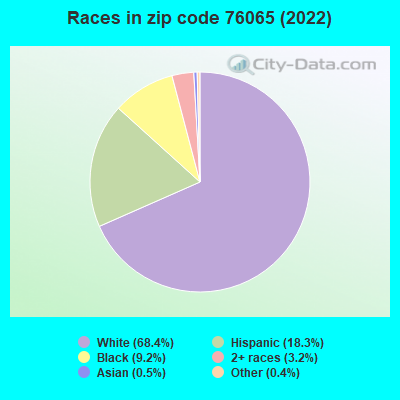


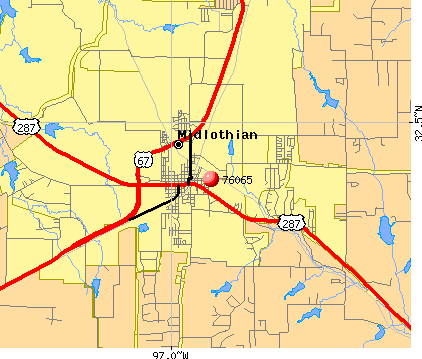 Nearest zip codes: 76084, 75104, 75054, 75167, 75249, 76064.
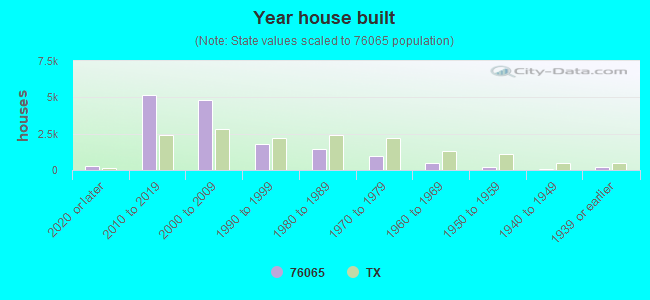

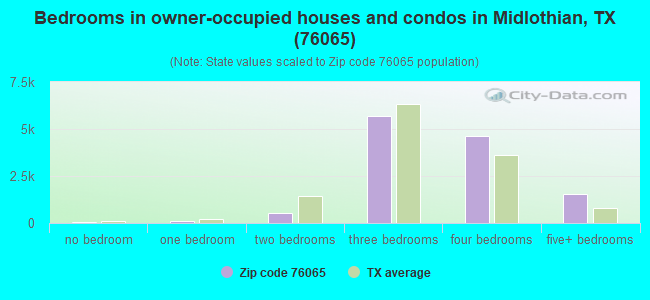
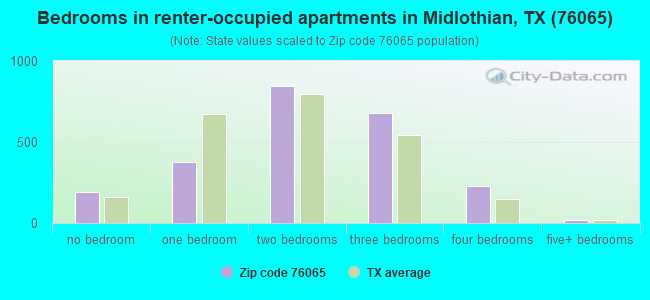
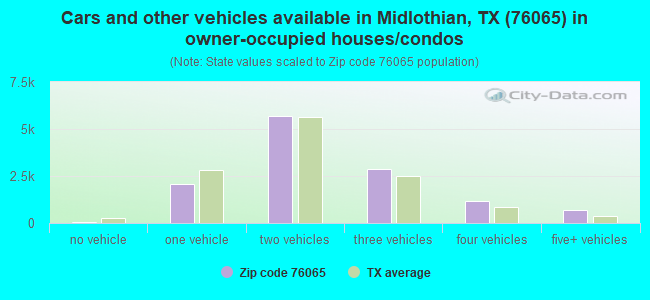
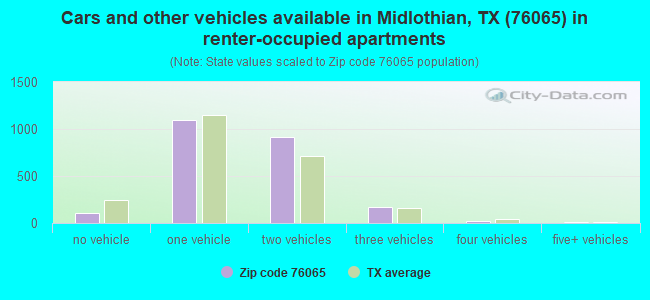


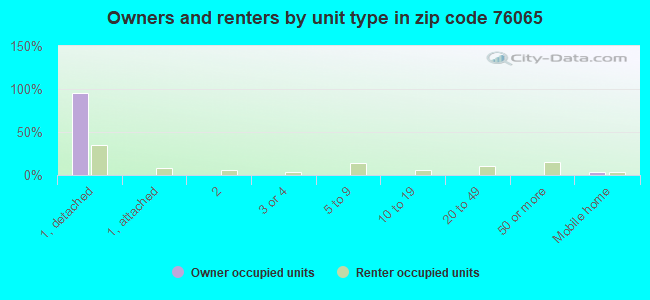
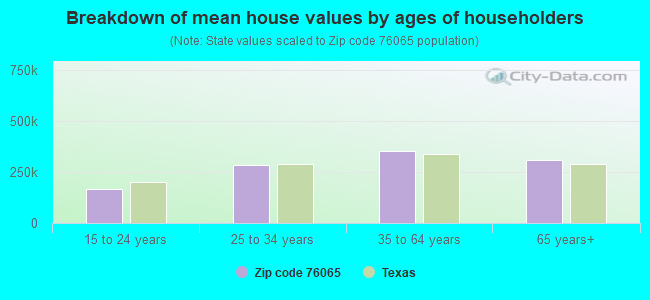


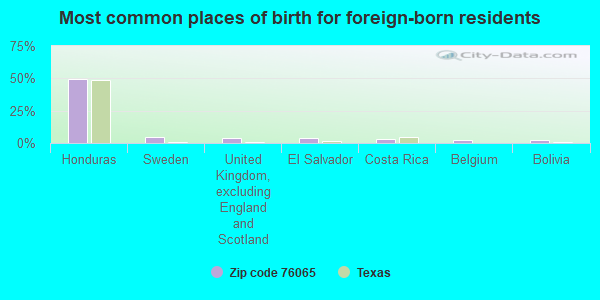
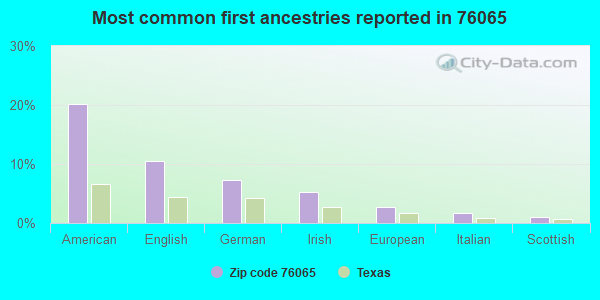
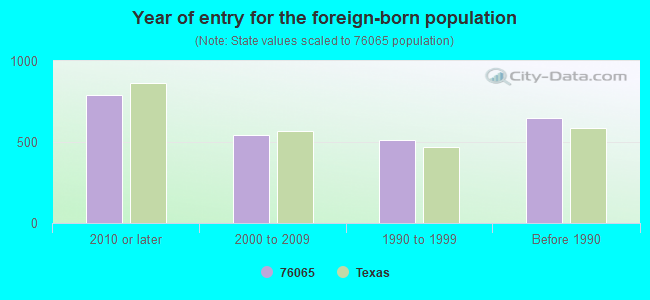

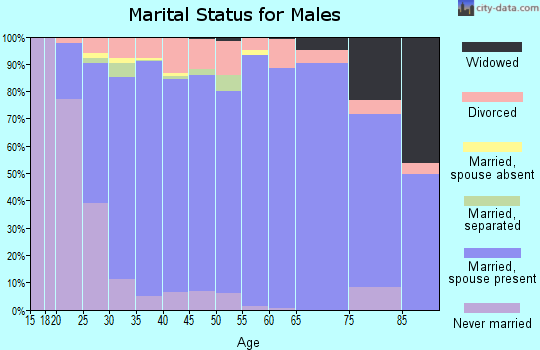

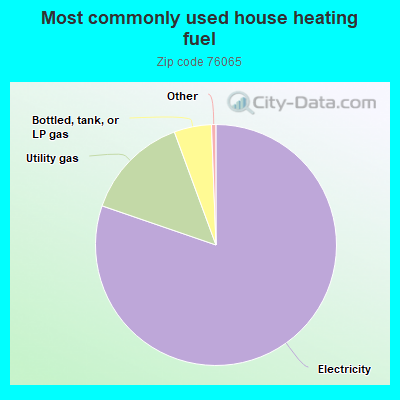
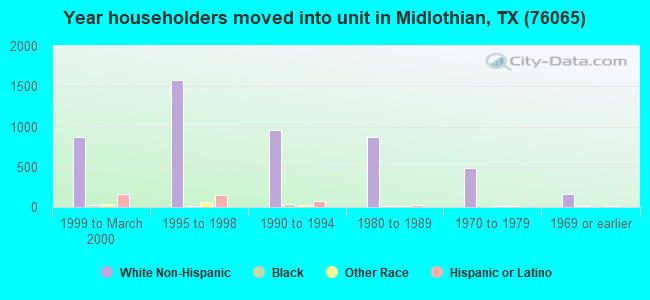
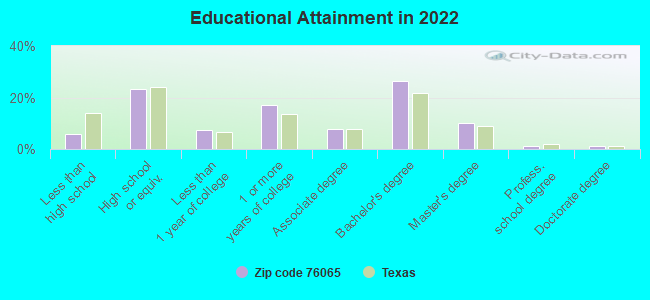
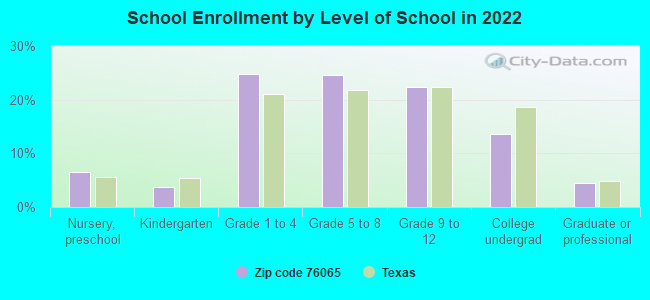
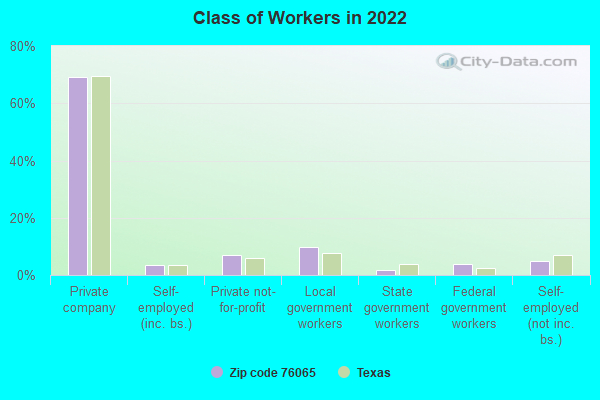
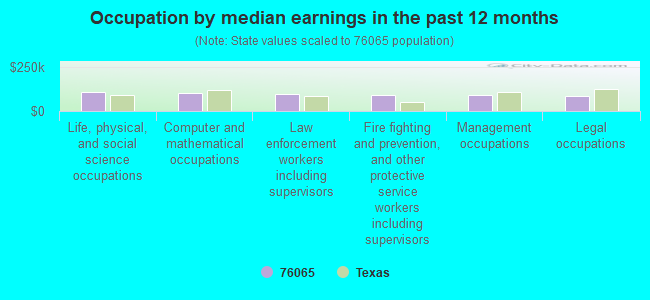
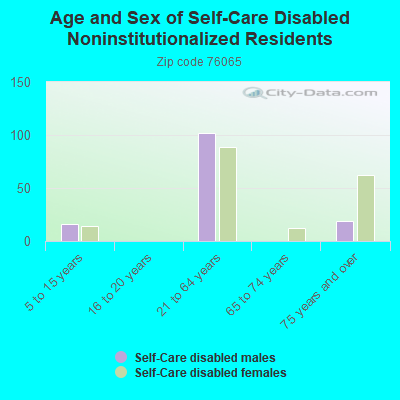
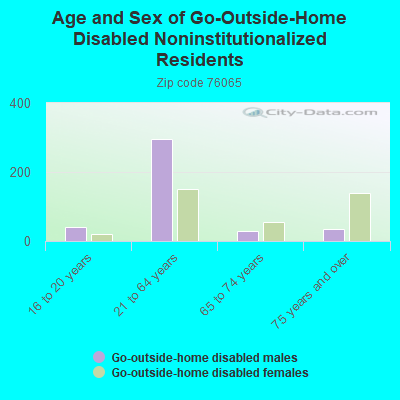
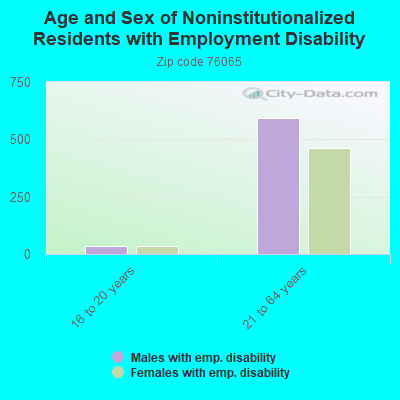
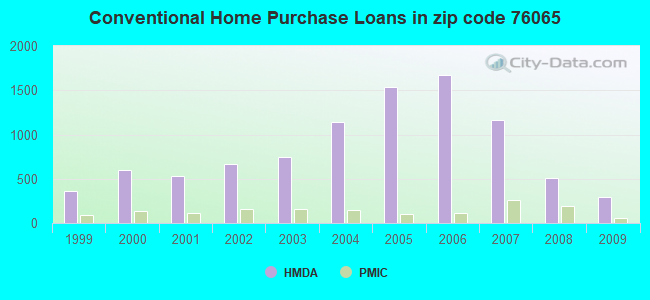
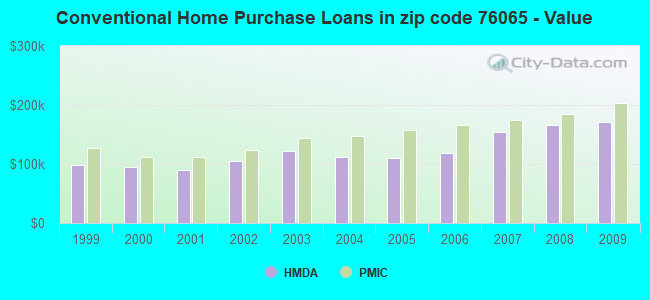
 According to the data from the years 2002 - 2018 the average number of fires per year is 154. The highest number of reported fires - 228 took place in 2011, and the least - 105 in 2015. The data has an increasing trend.
 When looking into fire subcategories, the most reports belonged to: Outside Fires (57.8%), and Structure Fires (28.6%).