Waxahachie, Texas Submit your own pictures of this city and show them to the world
OSM Map
General Map
Google Map
MSN Map
OSM Map
General Map
Google Map
MSN Map
OSM Map
General Map
Google Map
MSN Map
OSM Map
General Map
Google Map
MSN Map
Please wait while loading the map...
Population in 2022: 45,476 (89% urban, 11% rural). Population change since 2000: +112.2%Males: 21,917 Females: 23,559
March 2022 cost of living index in Waxahachie: 95.2 (less than average, U.S. average is 100) Percentage of residents living in poverty in 2022: 9.3%for White Non-Hispanic residents , 25.1% for Black residents , 8.1% for Hispanic or Latino residents , 5.0% for American Indian residents , 81.7% for Native Hawaiian and other Pacific Islander residents , 15.1% for other race residents , 6.6% for two or more races residents )
Profiles of local businesses
Business Search - 14 Million verified businesses
Data:
Median household income ($)
Median household income (% change since 2000)
Household income diversity
Ratio of average income to average house value (%)
Ratio of average income to average rent
Median household income ($) - White
Median household income ($) - Black or African American
Median household income ($) - Asian
Median household income ($) - Hispanic or Latino
Median household income ($) - American Indian and Alaska Native
Median household income ($) - Multirace
Median household income ($) - Other Race
Median household income for houses/condos with a mortgage ($)
Median household income for apartments without a mortgage ($)
Races - White alone (%)
Races - White alone (% change since 2000)
Races - Black alone (%)
Races - Black alone (% change since 2000)
Races - American Indian alone (%)
Races - American Indian alone (% change since 2000)
Races - Asian alone (%)
Races - Asian alone (% change since 2000)
Races - Hispanic (%)
Races - Hispanic (% change since 2000)
Races - Native Hawaiian and Other Pacific Islander alone (%)
Races - Native Hawaiian and Other Pacific Islander alone (% change since 2000)
Races - Two or more races (%)
Races - Two or more races (% change since 2000)
Races - Other race alone (%)
Races - Other race alone (% change since 2000)
Racial diversity
Unemployment (%)
Unemployment (% change since 2000)
Unemployment (%) - White
Unemployment (%) - Black or African American
Unemployment (%) - Asian
Unemployment (%) - Hispanic or Latino
Unemployment (%) - American Indian and Alaska Native
Unemployment (%) - Multirace
Unemployment (%) - Other Race
Population density (people per square mile)
Population - Males (%)
Population - Females (%)
Population - Males (%) - White
Population - Males (%) - Black or African American
Population - Males (%) - Asian
Population - Males (%) - Hispanic or Latino
Population - Males (%) - American Indian and Alaska Native
Population - Males (%) - Multirace
Population - Males (%) - Other Race
Population - Females (%) - White
Population - Females (%) - Black or African American
Population - Females (%) - Asian
Population - Females (%) - Hispanic or Latino
Population - Females (%) - American Indian and Alaska Native
Population - Females (%) - Multirace
Population - Females (%) - Other Race
Coronavirus confirmed cases (Apr 27, 2024)
Deaths caused by coronavirus (Apr 27, 2024)
Coronavirus confirmed cases (per 100k population) (Apr 27, 2024)
Deaths caused by coronavirus (per 100k population) (Apr 27, 2024)
Daily increase in number of cases (Apr 27, 2024)
Weekly increase in number of cases (Apr 27, 2024)
Cases doubled (in days) (Apr 27, 2024)
Hospitalized patients (Apr 18, 2022)
Negative test results (Apr 18, 2022)
Total test results (Apr 18, 2022)
COVID Vaccine doses distributed (per 100k population) (Sep 19, 2023)
COVID Vaccine doses administered (per 100k population) (Sep 19, 2023)
COVID Vaccine doses distributed (Sep 19, 2023)
COVID Vaccine doses administered (Sep 19, 2023)
Likely homosexual households (%)
Likely homosexual households (% change since 2000)
Likely homosexual households - Lesbian couples (%)
Likely homosexual households - Lesbian couples (% change since 2000)
Likely homosexual households - Gay men (%)
Likely homosexual households - Gay men (% change since 2000)
Cost of living index
Median gross rent ($)
Median contract rent ($)
Median monthly housing costs ($)
Median house or condo value ($)
Median house or condo value ($ change since 2000)
Mean house or condo value by units in structure - 1, detached ($)
Mean house or condo value by units in structure - 1, attached ($)
Mean house or condo value by units in structure - 2 ($)
Mean house or condo value by units in structure by units in structure - 3 or 4 ($)
Mean house or condo value by units in structure - 5 or more ($)
Mean house or condo value by units in structure - Boat, RV, van, etc. ($)
Mean house or condo value by units in structure - Mobile home ($)
Median house or condo value ($) - White
Median house or condo value ($) - Black or African American
Median house or condo value ($) - Asian
Median house or condo value ($) - Hispanic or Latino
Median house or condo value ($) - American Indian and Alaska Native
Median house or condo value ($) - Multirace
Median house or condo value ($) - Other Race
Median resident age
Resident age diversity
Median resident age - Males
Median resident age - Females
Median resident age - White
Median resident age - Black or African American
Median resident age - Asian
Median resident age - Hispanic or Latino
Median resident age - American Indian and Alaska Native
Median resident age - Multirace
Median resident age - Other Race
Median resident age - Males - White
Median resident age - Males - Black or African American
Median resident age - Males - Asian
Median resident age - Males - Hispanic or Latino
Median resident age - Males - American Indian and Alaska Native
Median resident age - Males - Multirace
Median resident age - Males - Other Race
Median resident age - Females - White
Median resident age - Females - Black or African American
Median resident age - Females - Asian
Median resident age - Females - Hispanic or Latino
Median resident age - Females - American Indian and Alaska Native
Median resident age - Females - Multirace
Median resident age - Females - Other Race
Commute - mean travel time to work (minutes)
Travel time to work - Less than 5 minutes (%)
Travel time to work - Less than 5 minutes (% change since 2000)
Travel time to work - 5 to 9 minutes (%)
Travel time to work - 5 to 9 minutes (% change since 2000)
Travel time to work - 10 to 19 minutes (%)
Travel time to work - 10 to 19 minutes (% change since 2000)
Travel time to work - 20 to 29 minutes (%)
Travel time to work - 20 to 29 minutes (% change since 2000)
Travel time to work - 30 to 39 minutes (%)
Travel time to work - 30 to 39 minutes (% change since 2000)
Travel time to work - 40 to 59 minutes (%)
Travel time to work - 40 to 59 minutes (% change since 2000)
Travel time to work - 60 to 89 minutes (%)
Travel time to work - 60 to 89 minutes (% change since 2000)
Travel time to work - 90 or more minutes (%)
Travel time to work - 90 or more minutes (% change since 2000)
Marital status - Never married (%)
Marital status - Now married (%)
Marital status - Separated (%)
Marital status - Widowed (%)
Marital status - Divorced (%)
Median family income ($)
Median family income (% change since 2000)
Median non-family income ($)
Median non-family income (% change since 2000)
Median per capita income ($)
Median per capita income (% change since 2000)
Median family income ($) - White
Median family income ($) - Black or African American
Median family income ($) - Asian
Median family income ($) - Hispanic or Latino
Median family income ($) - American Indian and Alaska Native
Median family income ($) - Multirace
Median family income ($) - Other Race
Median year house/condo built
Median year apartment built
Year house built - Built 2005 or later (%)
Year house built - Built 2000 to 2004 (%)
Year house built - Built 1990 to 1999 (%)
Year house built - Built 1980 to 1989 (%)
Year house built - Built 1970 to 1979 (%)
Year house built - Built 1960 to 1969 (%)
Year house built - Built 1950 to 1959 (%)
Year house built - Built 1940 to 1949 (%)
Year house built - Built 1939 or earlier (%)
Average household size
Household density (households per square mile)
Average household size - White
Average household size - Black or African American
Average household size - Asian
Average household size - Hispanic or Latino
Average household size - American Indian and Alaska Native
Average household size - Multirace
Average household size - Other Race
Occupied housing units (%)
Vacant housing units (%)
Owner occupied housing units (%)
Renter occupied housing units (%)
Vacancy status - For rent (%)
Vacancy status - For sale only (%)
Vacancy status - Rented or sold, not occupied (%)
Vacancy status - For seasonal, recreational, or occasional use (%)
Vacancy status - For migrant workers (%)
Vacancy status - Other vacant (%)
Residents with income below the poverty level (%)
Residents with income below 50% of the poverty level (%)
Children below poverty level (%)
Poor families by family type - Married-couple family (%)
Poor families by family type - Male, no wife present (%)
Poor families by family type - Female, no husband present (%)
Poverty status for native-born residents (%)
Poverty status for foreign-born residents (%)
Poverty among high school graduates not in families (%)
Poverty among people who did not graduate high school not in families (%)
Residents with income below the poverty level (%) - White
Residents with income below the poverty level (%) - Black or African American
Residents with income below the poverty level (%) - Asian
Residents with income below the poverty level (%) - Hispanic or Latino
Residents with income below the poverty level (%) - American Indian and Alaska Native
Residents with income below the poverty level (%) - Multirace
Residents with income below the poverty level (%) - Other Race
Air pollution - Air Quality Index (AQI)
Air pollution - CO
Air pollution - NO2
Air pollution - SO2
Air pollution - Ozone
Air pollution - PM10
Air pollution - PM25
Air pollution - Pb
Crime - Murders per 100,000 population
Crime - Rapes per 100,000 population
Crime - Robberies per 100,000 population
Crime - Assaults per 100,000 population
Crime - Burglaries per 100,000 population
Crime - Thefts per 100,000 population
Crime - Auto thefts per 100,000 population
Crime - Arson per 100,000 population
Crime - City-data.com crime index
Crime - Violent crime index
Crime - Property crime index
Crime - Murders per 100,000 population (5 year average)
Crime - Rapes per 100,000 population (5 year average)
Crime - Robberies per 100,000 population (5 year average)
Crime - Assaults per 100,000 population (5 year average)
Crime - Burglaries per 100,000 population (5 year average)
Crime - Thefts per 100,000 population (5 year average)
Crime - Auto thefts per 100,000 population (5 year average)
Crime - Arson per 100,000 population (5 year average)
Crime - City-data.com crime index (5 year average)
Crime - Violent crime index (5 year average)
Crime - Property crime index (5 year average)
1996 Presidential Elections Results (%) - Democratic Party (Clinton)
1996 Presidential Elections Results (%) - Republican Party (Dole)
1996 Presidential Elections Results (%) - Other
2000 Presidential Elections Results (%) - Democratic Party (Gore)
2000 Presidential Elections Results (%) - Republican Party (Bush)
2000 Presidential Elections Results (%) - Other
2004 Presidential Elections Results (%) - Democratic Party (Kerry)
2004 Presidential Elections Results (%) - Republican Party (Bush)
2004 Presidential Elections Results (%) - Other
2008 Presidential Elections Results (%) - Democratic Party (Obama)
2008 Presidential Elections Results (%) - Republican Party (McCain)
2008 Presidential Elections Results (%) - Other
2012 Presidential Elections Results (%) - Democratic Party (Obama)
2012 Presidential Elections Results (%) - Republican Party (Romney)
2012 Presidential Elections Results (%) - Other
2016 Presidential Elections Results (%) - Democratic Party (Clinton)
2016 Presidential Elections Results (%) - Republican Party (Trump)
2016 Presidential Elections Results (%) - Other
2020 Presidential Elections Results (%) - Democratic Party (Biden)
2020 Presidential Elections Results (%) - Republican Party (Trump)
2020 Presidential Elections Results (%) - Other
Ancestries Reported - Arab (%)
Ancestries Reported - Czech (%)
Ancestries Reported - Danish (%)
Ancestries Reported - Dutch (%)
Ancestries Reported - English (%)
Ancestries Reported - French (%)
Ancestries Reported - French Canadian (%)
Ancestries Reported - German (%)
Ancestries Reported - Greek (%)
Ancestries Reported - Hungarian (%)
Ancestries Reported - Irish (%)
Ancestries Reported - Italian (%)
Ancestries Reported - Lithuanian (%)
Ancestries Reported - Norwegian (%)
Ancestries Reported - Polish (%)
Ancestries Reported - Portuguese (%)
Ancestries Reported - Russian (%)
Ancestries Reported - Scotch-Irish (%)
Ancestries Reported - Scottish (%)
Ancestries Reported - Slovak (%)
Ancestries Reported - Subsaharan African (%)
Ancestries Reported - Swedish (%)
Ancestries Reported - Swiss (%)
Ancestries Reported - Ukrainian (%)
Ancestries Reported - United States (%)
Ancestries Reported - Welsh (%)
Ancestries Reported - West Indian (%)
Ancestries Reported - Other (%)
Educational Attainment - No schooling completed (%)
Educational Attainment - Less than high school (%)
Educational Attainment - High school or equivalent (%)
Educational Attainment - Less than 1 year of college (%)
Educational Attainment - 1 or more years of college (%)
Educational Attainment - Associate degree (%)
Educational Attainment - Bachelor's degree (%)
Educational Attainment - Master's degree (%)
Educational Attainment - Professional school degree (%)
Educational Attainment - Doctorate degree (%)
School Enrollment - Nursery, preschool (%)
School Enrollment - Kindergarten (%)
School Enrollment - Grade 1 to 4 (%)
School Enrollment - Grade 5 to 8 (%)
School Enrollment - Grade 9 to 12 (%)
School Enrollment - College undergrad (%)
School Enrollment - Graduate or professional (%)
School Enrollment - Not enrolled in school (%)
School enrollment - Public schools (%)
School enrollment - Private schools (%)
School enrollment - Not enrolled (%)
Median number of rooms in houses and condos
Median number of rooms in apartments
Housing units lacking complete plumbing facilities (%)
Housing units lacking complete kitchen facilities (%)
Density of houses
Urban houses (%)
Rural houses (%)
Households with people 60 years and over (%)
Households with people 65 years and over (%)
Households with people 75 years and over (%)
Households with one or more nonrelatives (%)
Households with no nonrelatives (%)
Population in households (%)
Family households (%)
Nonfamily households (%)
Population in families (%)
Family households with own children (%)
Median number of bedrooms in owner occupied houses
Mean number of bedrooms in owner occupied houses
Median number of bedrooms in renter occupied houses
Mean number of bedrooms in renter occupied houses
Median number of vehichles in owner occupied houses
Mean number of vehichles in owner occupied houses
Median number of vehichles in renter occupied houses
Mean number of vehichles in renter occupied houses
Mortgage status - with mortgage (%)
Mortgage status - with second mortgage (%)
Mortgage status - with home equity loan (%)
Mortgage status - with both second mortgage and home equity loan (%)
Mortgage status - without a mortgage (%)
Average family size
Average family size - White
Average family size - Black or African American
Average family size - Asian
Average family size - Hispanic or Latino
Average family size - American Indian and Alaska Native
Average family size - Multirace
Average family size - Other Race
Geographical mobility - Same house 1 year ago (%)
Geographical mobility - Moved within same county (%)
Geographical mobility - Moved from different county within same state (%)
Geographical mobility - Moved from different state (%)
Geographical mobility - Moved from abroad (%)
Place of birth - Born in state of residence (%)
Place of birth - Born in other state (%)
Place of birth - Native, outside of US (%)
Place of birth - Foreign born (%)
Housing units in structures - 1, detached (%)
Housing units in structures - 1, attached (%)
Housing units in structures - 2 (%)
Housing units in structures - 3 or 4 (%)
Housing units in structures - 5 to 9 (%)
Housing units in structures - 10 to 19 (%)
Housing units in structures - 20 to 49 (%)
Housing units in structures - 50 or more (%)
Housing units in structures - Mobile home (%)
Housing units in structures - Boat, RV, van, etc. (%)
House/condo owner moved in on average (years ago)
Renter moved in on average (years ago)
Year householder moved into unit - Moved in 1999 to March 2000 (%)
Year householder moved into unit - Moved in 1995 to 1998 (%)
Year householder moved into unit - Moved in 1990 to 1994 (%)
Year householder moved into unit - Moved in 1980 to 1989 (%)
Year householder moved into unit - Moved in 1970 to 1979 (%)
Year householder moved into unit - Moved in 1969 or earlier (%)
Means of transportation to work - Drove car alone (%)
Means of transportation to work - Carpooled (%)
Means of transportation to work - Public transportation (%)
Means of transportation to work - Bus or trolley bus (%)
Means of transportation to work - Streetcar or trolley car (%)
Means of transportation to work - Subway or elevated (%)
Means of transportation to work - Railroad (%)
Means of transportation to work - Ferryboat (%)
Means of transportation to work - Taxicab (%)
Means of transportation to work - Motorcycle (%)
Means of transportation to work - Bicycle (%)
Means of transportation to work - Walked (%)
Means of transportation to work - Other means (%)
Working at home (%)
Industry diversity
Most Common Industries - Agriculture, forestry, fishing and hunting, and mining (%)
Most Common Industries - Agriculture, forestry, fishing and hunting (%)
Most Common Industries - Mining, quarrying, and oil and gas extraction (%)
Most Common Industries - Construction (%)
Most Common Industries - Manufacturing (%)
Most Common Industries - Wholesale trade (%)
Most Common Industries - Retail trade (%)
Most Common Industries - Transportation and warehousing, and utilities (%)
Most Common Industries - Transportation and warehousing (%)
Most Common Industries - Utilities (%)
Most Common Industries - Information (%)
Most Common Industries - Finance and insurance, and real estate and rental and leasing (%)
Most Common Industries - Finance and insurance (%)
Most Common Industries - Real estate and rental and leasing (%)
Most Common Industries - Professional, scientific, and management, and administrative and waste management services (%)
Most Common Industries - Professional, scientific, and technical services (%)
Most Common Industries - Management of companies and enterprises (%)
Most Common Industries - Administrative and support and waste management services (%)
Most Common Industries - Educational services, and health care and social assistance (%)
Most Common Industries - Educational services (%)
Most Common Industries - Health care and social assistance (%)
Most Common Industries - Arts, entertainment, and recreation, and accommodation and food services (%)
Most Common Industries - Arts, entertainment, and recreation (%)
Most Common Industries - Accommodation and food services (%)
Most Common Industries - Other services, except public administration (%)
Most Common Industries - Public administration (%)
Occupation diversity
Most Common Occupations - Management, business, science, and arts occupations (%)
Most Common Occupations - Management, business, and financial occupations (%)
Most Common Occupations - Management occupations (%)
Most Common Occupations - Business and financial operations occupations (%)
Most Common Occupations - Computer, engineering, and science occupations (%)
Most Common Occupations - Computer and mathematical occupations (%)
Most Common Occupations - Architecture and engineering occupations (%)
Most Common Occupations - Life, physical, and social science occupations (%)
Most Common Occupations - Education, legal, community service, arts, and media occupations (%)
Most Common Occupations - Community and social service occupations (%)
Most Common Occupations - Legal occupations (%)
Most Common Occupations - Education, training, and library occupations (%)
Most Common Occupations - Arts, design, entertainment, sports, and media occupations (%)
Most Common Occupations - Healthcare practitioners and technical occupations (%)
Most Common Occupations - Health diagnosing and treating practitioners and other technical occupations (%)
Most Common Occupations - Health technologists and technicians (%)
Most Common Occupations - Service occupations (%)
Most Common Occupations - Healthcare support occupations (%)
Most Common Occupations - Protective service occupations (%)
Most Common Occupations - Fire fighting and prevention, and other protective service workers including supervisors (%)
Most Common Occupations - Law enforcement workers including supervisors (%)
Most Common Occupations - Food preparation and serving related occupations (%)
Most Common Occupations - Building and grounds cleaning and maintenance occupations (%)
Most Common Occupations - Personal care and service occupations (%)
Most Common Occupations - Sales and office occupations (%)
Most Common Occupations - Sales and related occupations (%)
Most Common Occupations - Office and administrative support occupations (%)
Most Common Occupations - Natural resources, construction, and maintenance occupations (%)
Most Common Occupations - Farming, fishing, and forestry occupations (%)
Most Common Occupations - Construction and extraction occupations (%)
Most Common Occupations - Installation, maintenance, and repair occupations (%)
Most Common Occupations - Production, transportation, and material moving occupations (%)
Most Common Occupations - Production occupations (%)
Most Common Occupations - Transportation occupations (%)
Most Common Occupations - Material moving occupations (%)
People in Group quarters - Institutionalized population (%)
People in Group quarters - Correctional institutions (%)
People in Group quarters - Federal prisons and detention centers (%)
People in Group quarters - Halfway houses (%)
People in Group quarters - Local jails and other confinement facilities (including police lockups) (%)
People in Group quarters - Military disciplinary barracks (%)
People in Group quarters - State prisons (%)
People in Group quarters - Other types of correctional institutions (%)
People in Group quarters - Nursing homes (%)
People in Group quarters - Hospitals/wards, hospices, and schools for the handicapped (%)
People in Group quarters - Hospitals/wards and hospices for chronically ill (%)
People in Group quarters - Hospices or homes for chronically ill (%)
People in Group quarters - Military hospitals or wards for chronically ill (%)
People in Group quarters - Other hospitals or wards for chronically ill (%)
People in Group quarters - Hospitals or wards for drug/alcohol abuse (%)
People in Group quarters - Mental (Psychiatric) hospitals or wards (%)
People in Group quarters - Schools, hospitals, or wards for the mentally retarded (%)
People in Group quarters - Schools, hospitals, or wards for the physically handicapped (%)
People in Group quarters - Institutions for the deaf (%)
People in Group quarters - Institutions for the blind (%)
People in Group quarters - Orthopedic wards and institutions for the physically handicapped (%)
People in Group quarters - Wards in general hospitals for patients who have no usual home elsewhere (%)
People in Group quarters - Wards in military hospitals for patients who have no usual home elsewhere (%)
People in Group quarters - Juvenile institutions (%)
People in Group quarters - Long-term care (%)
People in Group quarters - Homes for abused, dependent, and neglected children (%)
People in Group quarters - Residential treatment centers for emotionally disturbed children (%)
People in Group quarters - Training schools for juvenile delinquents (%)
People in Group quarters - Short-term care, detention or diagnostic centers for delinquent children (%)
People in Group quarters - Type of juvenile institution unknown (%)
People in Group quarters - Noninstitutionalized population (%)
People in Group quarters - College dormitories (includes college quarters off campus) (%)
People in Group quarters - Military quarters (%)
People in Group quarters - On base (%)
People in Group quarters - Barracks, unaccompanied personnel housing (UPH), (Enlisted/Officer), ;and similar group living quarters for military personnel (%)
People in Group quarters - Transient quarters for temporary residents (%)
People in Group quarters - Military ships (%)
People in Group quarters - Group homes (%)
People in Group quarters - Homes or halfway houses for drug/alcohol abuse (%)
People in Group quarters - Homes for the mentally ill (%)
People in Group quarters - Homes for the mentally retarded (%)
People in Group quarters - Homes for the physically handicapped (%)
People in Group quarters - Other group homes (%)
People in Group quarters - Religious group quarters (%)
People in Group quarters - Dormitories (%)
People in Group quarters - Agriculture workers' dormitories on farms (%)
People in Group quarters - Job Corps and vocational training facilities (%)
People in Group quarters - Other workers' dormitories (%)
People in Group quarters - Crews of maritime vessels (%)
People in Group quarters - Other nonhousehold living situations (%)
People in Group quarters - Other noninstitutional group quarters (%)
Residents speaking English at home (%)
Residents speaking English at home - Born in the United States (%)
Residents speaking English at home - Native, born elsewhere (%)
Residents speaking English at home - Foreign born (%)
Residents speaking Spanish at home (%)
Residents speaking Spanish at home - Born in the United States (%)
Residents speaking Spanish at home - Native, born elsewhere (%)
Residents speaking Spanish at home - Foreign born (%)
Residents speaking other language at home (%)
Residents speaking other language at home - Born in the United States (%)
Residents speaking other language at home - Native, born elsewhere (%)
Residents speaking other language at home - Foreign born (%)
Class of Workers - Employee of private company (%)
Class of Workers - Self-employed in own incorporated business (%)
Class of Workers - Private not-for-profit wage and salary workers (%)
Class of Workers - Local government workers (%)
Class of Workers - State government workers (%)
Class of Workers - Federal government workers (%)
Class of Workers - Self-employed workers in own not incorporated business and Unpaid family workers (%)
House heating fuel used in houses and condos - Utility gas (%)
House heating fuel used in houses and condos - Bottled, tank, or LP gas (%)
House heating fuel used in houses and condos - Electricity (%)
House heating fuel used in houses and condos - Fuel oil, kerosene, etc. (%)
House heating fuel used in houses and condos - Coal or coke (%)
House heating fuel used in houses and condos - Wood (%)
House heating fuel used in houses and condos - Solar energy (%)
House heating fuel used in houses and condos - Other fuel (%)
House heating fuel used in houses and condos - No fuel used (%)
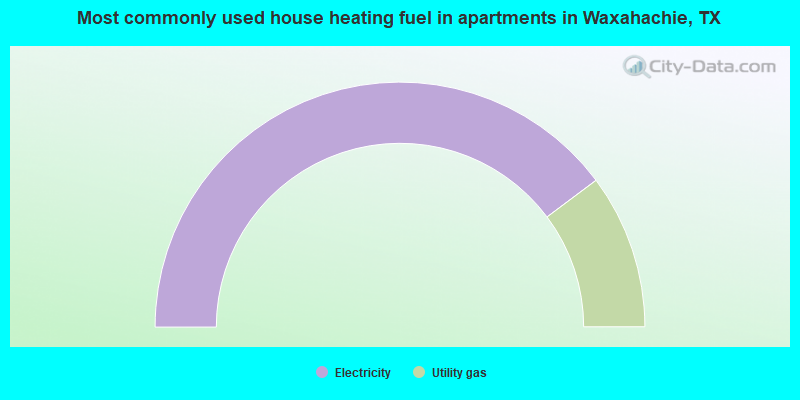
House heating fuel used in apartments - Utility gas (%)
House heating fuel used in apartments - Bottled, tank, or LP gas (%)
House heating fuel used in apartments - Electricity (%)
House heating fuel used in apartments - Fuel oil, kerosene, etc. (%)
House heating fuel used in apartments - Coal or coke (%)
House heating fuel used in apartments - Wood (%)
House heating fuel used in apartments - Solar energy (%)
House heating fuel used in apartments - Other fuel (%)
House heating fuel used in apartments - No fuel used (%)
Armed forces status - In Armed Forces (%)
Armed forces status - Civilian (%)
Armed forces status - Civilian - Veteran (%)
Armed forces status - Civilian - Nonveteran (%)
Fatal accidents locations in years 2005-2021
Fatal accidents locations in 2005
Fatal accidents locations in 2006
Fatal accidents locations in 2007
Fatal accidents locations in 2008
Fatal accidents locations in 2009
Fatal accidents locations in 2010
Fatal accidents locations in 2011
Fatal accidents locations in 2012
Fatal accidents locations in 2013
Fatal accidents locations in 2014
Fatal accidents locations in 2015
Fatal accidents locations in 2016
Fatal accidents locations in 2017
Fatal accidents locations in 2018
Fatal accidents locations in 2019
Fatal accidents locations in 2020
Fatal accidents locations in 2021
Alcohol use - People drinking some alcohol every month (%)
Alcohol use - People not drinking at all (%)
Alcohol use - Average days/month drinking alcohol
Alcohol use - Average drinks/week
Alcohol use - Average days/year people drink much
Audiometry - Average condition of hearing (%)
Audiometry - People that can hear a whisper from across a quiet room (%)
Audiometry - People that can hear normal voice from across a quiet room (%)
Audiometry - Ears ringing, roaring, buzzing (%)
Audiometry - Had a job exposure to loud noise (%)
Audiometry - Had off-work exposure to loud noise (%)
Blood Pressure & Cholesterol - Has high blood pressure (%)
Blood Pressure & Cholesterol - Checking blood pressure at home (%)
Blood Pressure & Cholesterol - Frequently checking blood cholesterol (%)
Blood Pressure & Cholesterol - Has high cholesterol level (%)
Consumer Behavior - Money monthly spent on food at supermarket/grocery store
Consumer Behavior - Money monthly spent on food at other stores
Consumer Behavior - Money monthly spent on eating out
Consumer Behavior - Money monthly spent on carryout/delivered foods
Consumer Behavior - Income spent on food at supermarket/grocery store (%)
Consumer Behavior - Income spent on food at other stores (%)
Consumer Behavior - Income spent on eating out (%)
Consumer Behavior - Income spent on carryout/delivered foods (%)
Current Health Status - General health condition (%)
Current Health Status - Blood donors (%)
Current Health Status - Has blood ever tested for HIV virus (%)
Current Health Status - Left-handed people (%)
Dermatology - People using sunscreen (%)
Diabetes - Diabetics (%)
Diabetes - Had a blood test for high blood sugar (%)
Diabetes - People taking insulin (%)
Diet Behavior & Nutrition - Diet health (%)
Diet Behavior & Nutrition - Milk product consumption (# of products/month)
Diet Behavior & Nutrition - Meals not home prepared (#/week)
Diet Behavior & Nutrition - Meals from fast food or pizza place (#/week)
Diet Behavior & Nutrition - Ready-to-eat foods (#/month)
Diet Behavior & Nutrition - Frozen meals/pizza (#/month)
Drug Use - People that ever used marijuana or hashish (%)
Drug Use - Ever used hard drugs (%)
Drug Use - Ever used any form of cocaine (%)
Drug Use - Ever used heroin (%)
Drug Use - Ever used methamphetamine (%)
Health Insurance - People covered by health insurance (%)
Kidney Conditions-Urology - Avg. # of times urinating at night
Medical Conditions - People with asthma (%)
Medical Conditions - People with anemia (%)
Medical Conditions - People with psoriasis (%)
Medical Conditions - People with overweight (%)
Medical Conditions - Elderly people having difficulties in thinking or remembering (%)
Medical Conditions - People who ever received blood transfusion (%)
Medical Conditions - People having trouble seeing even with glass/contacts (%)
Medical Conditions - People with arthritis (%)
Medical Conditions - People with gout (%)
Medical Conditions - People with congestive heart failure (%)
Medical Conditions - People with coronary heart disease (%)
Medical Conditions - People with angina pectoris (%)
Medical Conditions - People who ever had heart attack (%)
Medical Conditions - People who ever had stroke (%)
Medical Conditions - People with emphysema (%)
Medical Conditions - People with thyroid problem (%)
Medical Conditions - People with chronic bronchitis (%)
Medical Conditions - People with any liver condition (%)
Medical Conditions - People who ever had cancer or malignancy (%)
Mental Health - People who have little interest in doing things (%)
Mental Health - People feeling down, depressed, or hopeless (%)
Mental Health - People who have trouble sleeping or sleeping too much (%)
Mental Health - People feeling tired or having little energy (%)
Mental Health - People with poor appetite or overeating (%)
Mental Health - People feeling bad about themself (%)
Mental Health - People who have trouble concentrating on things (%)
Mental Health - People moving or speaking slowly or too fast (%)
Mental Health - People having thoughts they would be better off dead (%)
Oral Health - Average years since last visit a dentist
Oral Health - People embarrassed because of mouth (%)
Oral Health - People with gum disease (%)
Oral Health - General health of teeth and gums (%)
Oral Health - Average days a week using dental floss/device
Oral Health - Average days a week using mouthwash for dental problem
Oral Health - Average number of teeth
Pesticide Use - Households using pesticides to control insects (%)
Pesticide Use - Households using pesticides to kill weeds (%)
Physical Activity - People doing vigorous-intensity work activities (%)
Physical Activity - People doing moderate-intensity work activities (%)
Physical Activity - People walking or bicycling (%)
Physical Activity - People doing vigorous-intensity recreational activities (%)
Physical Activity - People doing moderate-intensity recreational activities (%)
Physical Activity - Average hours a day doing sedentary activities
Physical Activity - Average hours a day watching TV or videos
Physical Activity - Average hours a day using computer
Physical Functioning - People having limitations keeping them from working (%)
Physical Functioning - People limited in amount of work they can do (%)
Physical Functioning - People that need special equipment to walk (%)
Physical Functioning - People experiencing confusion/memory problems (%)
Physical Functioning - People requiring special healthcare equipment (%)
Prescription Medications - Average number of prescription medicines taking
Preventive Aspirin Use - Adults 40+ taking low-dose aspirin (%)
Reproductive Health - Vaginal deliveries (%)
Reproductive Health - Cesarean deliveries (%)
Reproductive Health - Deliveries resulted in a live birth (%)
Reproductive Health - Pregnancies resulted in a delivery (%)
Reproductive Health - Women breastfeeding newborns (%)
Reproductive Health - Women that had a hysterectomy (%)
Reproductive Health - Women that had both ovaries removed (%)
Reproductive Health - Women that have ever taken birth control pills (%)
Reproductive Health - Women taking birth control pills (%)
Reproductive Health - Women that have ever used Depo-Provera or injectables (%)
Reproductive Health - Women that have ever used female hormones (%)
Sexual Behavior - People 18+ that ever had sex (vaginal, anal, or oral) (%)
Sexual Behavior - Males 18+ that ever had vaginal sex with a woman (%)
Sexual Behavior - Males 18+ that ever performed oral sex on a woman (%)
Sexual Behavior - Males 18+ that ever had anal sex with a woman (%)
Sexual Behavior - Males 18+ that ever had any sex with a man (%)
Sexual Behavior - Females 18+ that ever had vaginal sex with a man (%)
Sexual Behavior - Females 18+ that ever performed oral sex on a man (%)
Sexual Behavior - Females 18+ that ever had anal sex with a man (%)
Sexual Behavior - Females 18+ that ever had any kind of sex with a woman (%)
Sexual Behavior - Average age people first had sex
Sexual Behavior - Average number of female sex partners in lifetime (males 18+)
Sexual Behavior - Average number of female vaginal sex partners in lifetime (males 18+)
Sexual Behavior - Average age people first performed oral sex on a woman (18+)
Sexual Behavior - Average number of woman performed oral sex on in lifetime (18+)
Sexual Behavior - Average number of male sex partners in lifetime (males 18+)
Sexual Behavior - Average number of male anal sex partners in lifetime (males 18+)
Sexual Behavior - Average age people first performed oral sex on a man (18+)
Sexual Behavior - Average number of male oral sex partners in lifetime (18+)
Sexual Behavior - People using protection when performing oral sex (%)
Sexual Behavior - Average number of times people have vaginal or anal sex a year
Sexual Behavior - People having sex without condom (%)
Sexual Behavior - Average number of male sex partners in lifetime (females 18+)
Sexual Behavior - Average number of male vaginal sex partners in lifetime (females 18+)
Sexual Behavior - Average number of female sex partners in lifetime (females 18+)
Sexual Behavior - Circumcised males 18+ (%)
Sleep Disorders - Average hours sleeping at night
Sleep Disorders - People that has trouble sleeping (%)
Smoking-Cigarette Use - People smoking cigarettes (%)
Taste & Smell - People 40+ having problems with smell (%)
Taste & Smell - People 40+ having problems with taste (%)
Taste & Smell - People 40+ that ever had wisdom teeth removed (%)
Taste & Smell - People 40+ that ever had tonsils teeth removed (%)
Taste & Smell - People 40+ that ever had a loss of consciousness because of a head injury (%)
Taste & Smell - People 40+ that ever had a broken nose or other serious injury to face or skull (%)
Taste & Smell - People 40+ that ever had two or more sinus infections (%)
Weight - Average height (inches)
Weight - Average weight (pounds)
Weight - Average BMI
Weight - People that are obese (%)
Weight - People that ever were obese (%)
Weight - People trying to lose weight (%)
Officers per 1,000 residents here:
1.93Texas average:
2.07
Latest news from Waxahachie, TX collected exclusively by city-data.com from local newspapers, TV, and radio stations
Ancestries: English (11.6%), American (10.4%), German (4.7%), Irish (4.0%), European (1.5%), Scottish (1.1%).
Current Local Time:
Land area: 40.0 square miles.
Population density: 1,138 people per square mile (low).
2,000 residents are foreign born (3.4% Latin America , 0.7% Asia ).
This city:
4.4%Texas:
17.1%
Median real estate property taxes paid for housing units with mortgages in 2022: $5,081 (1.5%)Median real estate property taxes paid for housing units with no mortgage in 2022: $3,007 (1.2%)
Nearest city with pop. 50,000+: Grand Prairie, TX
Nearest city with pop. 200,000+: Arlington, TX
Nearest city with pop. 1,000,000+: Dallas, TX
Nearest cities:
Latitude: 32.40 N, Longitude: 96.85 W
Nickname or alias (official or unofficial): Crape Myrtle Capital of Texas
Daytime population change due to commuting: +1,313 (+2.9%)Workers who live and work in this city: 10,730 (46.2%)
Area codes: 469, 214, 972
Single-family new house construction building permits:
2022: 480 buildings , average cost: $321,0002021: 834 buildings , average cost: $220,8002020: 756 buildings , average cost: $226,1002019: 576 buildings , average cost: $203,6002018: 555 buildings , average cost: $201,8002017: 546 buildings , average cost: $206,0002016: 424 buildings , average cost: $186,5002015: 347 buildings , average cost: $171,6002014: 314 buildings , average cost: $147,9002013: 225 buildings , average cost: $141,5002012: 195 buildings , average cost: $152,2002011: 131 buildings , average cost: $142,1002010: 150 buildings , average cost: $136,7002009: 167 buildings , average cost: $128,0002008: 225 buildings , average cost: $134,7002007: 323 buildings , average cost: $146,3002006: 348 buildings , average cost: $149,6002005: 424 buildings , average cost: $128,4002004: 342 buildings , average cost: $105,3002003: 293 buildings , average cost: $99,2002002: 186 buildings , average cost: $112,1002001: 134 buildings , average cost: $137,1002000: 162 buildings , average cost: $126,1001999: 139 buildings , average cost: $108,8001998: 101 buildings , average cost: $96,5001997: 150 buildings , average cost: $66,500Unemployment in December 2023:
Population change in the 1990s: +3,205 (+17.6%).
Most common occupations in Waxahachie, TX (%)
Both Males Females
Other production occupations, including supervisors (6.0%)
Preschool, kindergarten, elementary, and middle school teachers (4.7%)
Other management occupations, except farmers and farm managers (4.5%)
Other sales and related occupations, including supervisors (4.2%)
Building and grounds cleaning and maintenance occupations (4.0%)
Other office and administrative support workers, including supervisors (4.0%)
Electrical equipment mechanics and other installation, maintenance, and repair workers, including supervisors (3.3%)
Other production occupations, including supervisors (7.8%)
Electrical equipment mechanics and other installation, maintenance, and repair workers, including supervisors (5.8%)
Other management occupations, except farmers and farm managers (5.3%)
Metal workers and plastic workers (4.4%)
Other sales and related occupations, including supervisors (4.1%)
Building and grounds cleaning and maintenance occupations (3.9%)
Driver/sales workers and truck drivers (3.9%)
Preschool, kindergarten, elementary, and middle school teachers (8.4%)
Other office and administrative support workers, including supervisors (5.9%)
Secretaries and administrative assistants (5.8%)
Other sales and related occupations, including supervisors (4.3%)
Information and record clerks, except customer service representatives (4.2%)
Other production occupations, including supervisors (4.2%)
Building and grounds cleaning and maintenance occupations (4.1%)
Tornado activity:
Waxahachie-area historical tornado activity is above Texas state average. It is 141% greater than the overall U.S. average.
On 4/25/1994, a category F4 (max. wind speeds 207-260 mph) tornado 15.0 miles away from the Waxahachie city center killed 3 people and injured 48 people and caused between $50,000,000 and $500,000,000 in damages.
On 5/26/1976, a category F4 tornado 17.6 miles away from the city center caused between $500,000 and $5,000,000 in damages.
Earthquake activity:
Waxahachie-area historical earthquake activity is significantly above Texas state average. It is 420% greater than the overall U.S. average. On 11/6/2011 at 03:53:10, a magnitude 5.7 (5.7 MW, Depth: 3.2 mi, Class: Moderate, Intensity: VI - VII) earthquake occurred 216.7 miles away from Waxahachie center On 9/3/2016 at 12:02:44, a magnitude 5.8 (5.8 MW, Depth: 3.5 mi) earthquake occurred 278.5 miles away from the city center On 6/16/1978 at 11:46:54, a magnitude 5.3 (4.4 MB, 4.6 UK, 5.3 ML) earthquake occurred 232.2 miles away from Waxahachie center On 5/17/2012 at 08:12:00, a magnitude 4.8 (4.8 MW, Depth: 3.1 mi, Class: Light, Intensity: IV - V) earthquake occurred 148.8 miles away from Waxahachie center On 5/7/2015 at 22:58:05, a magnitude 4.0 (4.0 MW, Depth: 1.6 mi) earthquake occurred 15.8 miles away from the city center On 11/7/2016 at 01:44:24, a magnitude 5.0 (5.0 MW, Depth: 2.8 mi) earthquake occurred 248.4 miles away from Waxahachie center Magnitude types: body-wave magnitude (MB), local magnitude (ML), moment magnitude (MW) Natural disasters: The number of natural disasters in Ellis County (17) is near the US average (15).Major Disasters (Presidential) Declared: 6Emergencies Declared: 7Fires: 6, Floods: 5, Tornadoes: 5, Hurricanes: 4, Storms: 4, Winds: 2, Winter Storm: 1, Other: 2 (Note: some incidents may be assigned to more than one category). Hospitals in Waxahachie: AUBURN HOUSE (115 AUBURN ST) BAYLOR MEDICAL CENTER AT WAXAHACHIE (Voluntary non-profit - Other, provides emergency services, 1405 W JEFFERSON ST) BRYN MAWR HOUSE (109 BRYN MAWR) JOHNSTON GROUP HOME (407 JOHNSTON BLVD) JOSEPH GROUP HOME (206 JOSEPH ST) KIOWA HOUSE (106 KIOWA) ODYSSEY HEALTHCARE OF SOUTHERN DALLAS (2001 BATES SUITE 400) ROCK SPRINGS HOUSE (206 ROCK SPRINGS) ROYAL GROUP HOME (408 W ROYAL ST) WILLOWBROOK HOSP (HWY 77 N PANORAMA LOOP BOX 1070)
College/University in Waxahachie: Southwestern Assemblies of God University Full-time enrollment: 1,626; Location: 1200 Sycamore; Private, not-for-profit; Website: www.sagu.edu; Offers Master's degree )
Colleges/universities with over 2000 students nearest to Waxahachie:
Cedar Valley College (about 17 miles; Lancaster, TX ; Full-time enrollment: 3,603)
Dallas Baptist University (about 23 miles; Dallas, TX ; FT enrollment: 4,280)
Mountain View College (about 23 miles; Dallas, TX ; FT enrollment: 4,988)
El Centro College (about 27 miles; Dallas, TX ; FT enrollment: 6,086)
The University of Texas at Arlington (about 28 miles; Arlington, TX ; FT enrollment: 27,453)
Hill College (about 31 miles; Hillsboro, TX ; FT enrollment: 2,968)
Navarro College (about 31 miles; Corsicana, TX ; FT enrollment: 7,711)
Public high schools in Waxahachie: WAXAHACHIE H S Students: 1,340, Location: 1000 HWY 77 N, Grades: 9-12)WAXAHACHIE GLOBAL H S Students: 184, Location: 602 SECOND ST, Grades: 9-12)WAXAHACHIE H S OF CHOICE Students: 26, Location: 614 GETZENDANER ST, Grades: 10-12)WAXAHACHIE FAITH FAMILY ACADEMY Location: 701 OVILLA RD, Grades: 9-12, Charter school )
EDDIE FINLEY SR J H Location: 2401 E BROWN ST, Grades: 6-9)
ROBBIE E HOWARD J H Location: 265 BROADHEAD RD, Grades: 6-9)
Private high schools in Waxahachie: FIRST CHRISTIAN DAY SCHOOL Students: 148, Location: 1109 BROWN ST, Grades: PK-12)
WAXAHACHIE PREPARATORY ACADEMY Students: 118, Location: 621 N GRAND AVE, Grades: KG-12)
Public elementary/middle schools in Waxahachie: WEDGEWORTH EL Students: 702, Location: 405 SOLON RD, Grades: PK-5)MARGARET L FELTY EL Students: 665, Location: 231 PARK PL BLVD, Grades: PK-5)MARVIN EL Students: 554, Location: 110 BROWN ST, Grades: PK-5)DUNAWAY EL Students: 520, Location: 600 S HWY 77, Grades: PK-5)NORTHSIDE EL Students: 515, Location: 801 BROWN ST, Grades: KG-5)SHACKELFORD EL Students: 481, Location: 1001 BUTCHER RD, Grades: PK-5)OLIVER E CLIFT EL Students: 478, Location: 650 PARKS SCHOOL HOUSE RD, Grades: PK-5)WAXAHACHIE FAMILY FAITH ACADEMY Location: 701 OVILLA RD, Grades: 6-8, Charter school )
WAXAHACHIE FAMILY FAITH ACADEMY Location: 701 OVILLA RD, Grades: PK-5, Charter school )
Private elementary/middle school in Waxahachie: ST JOSEPH CATHOLIC SCHOOL Students: 167, Location: 506 E MARVIN AVE, Grades: PK-8)
See full list of schools located in Waxahachie Library in Waxahachie: NICHOLAS P SIMS LIBRARY & LYCEUM Operating income: $1,437,862; Location: 515 W MAIN ST; 120,512 books ; 6,956 audio materials ; 3,442 video materials ; 4 local licensed databases ; 50 state licensed databases ; 178 print serial subscriptions )
User-submitted facts and corrections:
St. Joseph Catholic School is PreK 3 years old to the 8th grade. added by librarian
Notable locations in Waxahachie: (A) , Wyatt Street Shotgun House Historic District (B) , North Rogers Street Historic District (C) , Oldham Avenue Historic District (D) , Ellis County Courthouse Historic District (E) , E F Phillips House (F) , E M Hines House (G) , F R Adamson House (H) , George C Dillon House (I) , Frank Odom House (J) , G H Alderman House (K) , House at 816 West Water (L) , House at 712 East Marvin (M) , J M Alderdice House (N) , J D Kirven House (O) , J S Berry House (P) , J R Erwin House (Q) , Joe Cohn House (R) , John Solon House (S) , Judge M B Templeton House (T) . Display/hide their locations on the map
Churches in Waxahachie include: (A) , Friendship Baptist Church (B) , First Baptist Church of Waxahachie (C) , Farley Street Baptist Church (D) , El Bethel Baptist Church (E) , University Assembly of God Church (F) , South Park Assembly of God Church (G) , New Birth Community Bible Church (H) , Covenant Place of Waxahachie Church (I) . Display/hide their locations on the map
Cemetery: (1) . Display/hide its location on the map
Reservoirs: (A) , Katy Lake (B) , Soil Conservation Service Site 14 Reservoir (C) , Soil Conservation Service Site 13 Reservoir (D) . Display/hide their locations on the map
Streams, rivers, and creeks: (A) , Lone Elm Branch (B) , Long Branch (C) . Display/hide their locations on the map
Parks in Waxahachie include: (1) , Getzendaner Memorial Park (2) , Richards Park (3) , Sheaffer Full Life Center - Southwest Assemblies of God University (4) , Southwest Assemblies of God University Football Field (5) , Lumpkin Stadium (6) , Southwest Assemblies of God University Baseball Fields (7) , Chapman Park (8) . Display/hide their locations on the map
Tourist attractions: (1) , Ellis County Art Association & Museum (Cultural Attractions- Events- & Facilities; 501 West Main Street) (2) . Display/hide their approximate locations on the map
Hotels: (1) , Best Western Gingerbread Inn (200 I-35 @ Business Highway 287 P.O. Box 555) (2) . Display/hide their approximate locations on the map
Court: (1) . Display/hide its approximate location on the map
Birthplace of: Byron Nelson - Professional golfer, Paul Richards (baseball) - Baseball player, Dick Murdoch - Professional wrestler, Emanuel Cleaver - Politician, Tevin Campbell - Singer-songwriter, Brian Waters - 2005 NFL player (Kansas City Chiefs, born : Feb 18, 1977), Desmond Mason - NBA player (Milwaukee Bucks, born : Oct 11, 1977), Frederic Forrest - Actor, Jammal Brown - College football player, Julie Miller - Female singer.
Ellis County has a predicted average indoor radon screening level less than 2 pCi/L (pico curies per liter) - Low Potential Drinking water stations with addresses in Waxahachie and their reported violations in the past:
BUENA VISTA BETHEL SUD (Population served: 3,691, Purch surface water):
Past monitoring violations:
Lead Consumer Notice - In DEC-30-2013, Contaminant: Lead and Copper Rule. Follow-up actions: St Compliance achieved (JUN-11-2014)
Follow-up Or Routine LCR Tap M/R - In OCT-01-2011, Contaminant: Lead and Copper Rule. Follow-up actions: St Compliance achieved (NOV-06-2013)
Population served: 122, Groundwater):
Past monitoring violations:
Monitoring, Source Water (GWR) - In SEP-01-2012, Contaminant: E. COLI. Follow-up actions: St Public Notif requested (DEC-04-2012), St Violation/Reminder Notice (DEC-04-2012), St Public Notif received (JAN-16-2013), St Compliance achieved (JAN-30-2013)
One regular monitoring violation
Average household size: This city:
2.7 peopleTexas:
2.8 people
Percentage of family households: This city:
71.4%Whole state:
69.9%
Percentage of households with unmarried partners: This city:
6.0%Whole state:
6.0%
Likely homosexual households (counted as self-reported same-sex unmarried-partner households)
Lesbian couples: 0.3% of all households Gay men: 0.2% of all households
People in group quarters in Waxahachie in 2010:
413 people in college/university student housing
306 people in local jails and other municipal confinement facilities
232 people in nursing facilities/skilled-nursing facilities
177 people in group homes for juveniles (non-correctional)
33 people in group homes intended for adults
28 people in workers' group living quarters and job corps centers
20 people in emergency and transitional shelters (with sleeping facilities) for people experiencing homelessness
People in group quarters in Waxahachie in 2000:
763 people in college dormitories (includes college quarters off campus)
260 people in local jails and other confinement facilities (including police lockups)
178 people in nursing homes
78 people in other group homes
69 people in homes or halfway houses for drug/alcohol abuse
63 people in other noninstitutional group quarters
7 people in homes for the mentally retarded
Banks with most branches in Waxahachie (2011 data):
Citizens National Bank of Texas: Citizens National Bank - Heb, Citizens National Bank Of Texas, Citizens National Bank - Uptown. Info updated 2007/10/16: Bank assets: $565.0 mil, Deposits: $483.4 mil, local headquarters , positive income , Commercial Lending Specialization, 13 total offices , Holding Company: First Citizens Bancshares, Inc.
Prosperity Bank: Waxahachie Branch at 401 Ferris, branch established on 2003/10/01. Info updated 2012/01/05: Bank assets: $9,816.2 mil, Deposits: $8,064.8 mil, headquarters in El Campo, TX, positive income , Mortgage Lending Specialization, 187 total offices , Holding Company: Prosperity Bancshares, Inc.
Southwest Securities , FSB: Waxahachie Branch at 1791 Highway 77 N, branch established on 2008/06/23. Info updated 2011/07/21: Bank assets: $1,327.9 mil, Deposits: $1,069.9 mil, headquarters in Dallas, TX, negative income in the last year , Commercial Lending Specialization, 15 total offices
Comerica Bank: Waxahachie Branch at 820 Ferris Avenue, branch established on 1932/01/01. Info updated 2011/07/29: Bank assets: $60,970.5 mil, Deposits: $48,300.9 mil, headquarters in Dallas, TX, positive income , Commercial Lending Specialization, 497 total offices , Holding Company: Comerica Incorporated
First National Bank Texas: Waxahachie Banking Center - Rc 802 at 1200 North Highway 77, branch established on 2000/01/19. Info updated 2006/11/03: Bank assets: $944.3 mil, Deposits: $815.9 mil, headquarters in Killeen, TX, positive income , Mortgage Lending Specialization, 250 total offices , Holding Company: First Community Bancshares, Inc.
VINTAGE BANK: Vintage Bank at 300 Hwy 77n, branch established on 1900/06/13. Info updated 2010/06/01: Bank assets: $147.4 mil, Deposits: $133.9 mil, local headquarters , positive income , Commercial Lending Specialization, 3 total offices , Holding Company: Vintage Shares, Inc.
Compass Bank: Waxahachie Branch at 1015 North Hwy 77, branch established on 2009/08/22. Info updated 2011/02/24: Bank assets: $63,107.0 mil, Deposits: $46,232.4 mil, headquarters in Birmingham, AL, negative income in the last year , Commercial Lending Specialization, 720 total offices , Holding Company: Banco Bilbao Vizcaya Argentaria, S.A.
Wells Fargo Bank, National Association: Waxahachie Branch at 1111 North Highway 77, branch established on 1975/08/25. Info updated 2011/04/05: Bank assets: $1,161,490.0 mil, Deposits: $905,653.0 mil, headquarters in Sioux Falls, SD, positive income , 6395 total offices , Holding Company: Wells Fargo & Company
The First State Bank: Waxahachie Branch at 104 Broadhead Road, branch established on 2010/01/07. Info updated 2009/05/18: Bank assets: $122.5 mil, Deposits: $107.9 mil, headquarters in Rice, TX, positive income , Commercial Lending Specialization, 4 total offices , Holding Company: Rice Bancshares, Inc.
For population 15 years and over in Waxahachie:
Never married: 33.6%Now married: 49.4%Separated: 2.2%Widowed: 3.8%Divorced: 10.9% For population 25 years and over in Waxahachie:
High school or higher: 90.2%Bachelor's degree or higher: 27.3%Graduate or professional degree: 9.1%Unemployed: 11.0%Mean travel time to work (commute): 25.3 minutes
Education Gini index (Inequality in education) Here:
13.9Texas average:
14.0
Religion statistics for Waxahachie, TX (based on Ellis County data)
Religion Adherents Congregations Evangelical Protestant 47,380 167 Catholic 17,381 4 Mainline Protestant 9,201 34 Black Protestant 2,015 13 Other 1,769 7 None 71,864 -
Source: Clifford Grammich, Kirk Hadaway, Richard Houseal, Dale E.Jones, Alexei Krindatch, Richie Stanley and Richard H.Taylor. 2012. 2010 U.S.Religion Census: Religious Congregations & Membership Study. Association of Statisticians of American Religious Bodies. Jones, Dale E., et al. 2002. Congregations and Membership in the United States 2000. Nashville, TN: Glenmary Research Center. Graphs represent county-level data
Food Environment Statistics: Number of grocery stores : 17This county :
1.19 / 10,000 pop.Texas :
1.47 / 10,000 pop.
Number of supercenters and club stores : 1Ellis County :
0.07 / 10,000 pop.Texas :
0.14 / 10,000 pop.
Number of convenience stores (no gas) : 14Ellis County :
0.98 / 10,000 pop.Texas :
1.11 / 10,000 pop.
Number of convenience stores (with gas) : 56This county :
3.92 / 10,000 pop.Texas :
3.95 / 10,000 pop.
Number of full-service restaurants : 65This county :
4.55 / 10,000 pop.Texas :
6.13 / 10,000 pop.
Adult obesity rate : Ellis County :
29.1%State :
26.6%
Low-income preschool obesity rate : Ellis County :
16.4%State :
15.7%
Health and Nutrition: Healthy diet rate : This city:
48.2%Texas:
48.6%
Average overall health of teeth and gums : Waxahachie:
45.9%Texas:
47.4%
People feeling badly about themselves : Waxahachie:
20.7%Texas:
20.6%
People not drinking alcohol at all : This city:
10.9%Texas:
10.3%
Average hours sleeping at night : Overweight people : Waxahachie:
33.1%Texas:
33.1%
General health condition : Waxahachie:
55.5%Texas:
56.2%
Average condition of hearing : This city:
79.9%Texas:
80.7%
More about Health and Nutrition of Waxahachie, TX Residents
Local government employment and payroll (March 2022)
Function
Full-time employees
Monthly full-time payroll
Average yearly full-time wage
Part-time employees
Monthly part-time payroll
Police Protection - Officers
71 $489,273 $82,694 0 $0 Firefighters
63 $495,610 $94,402 0 $0 Water Supply
35 $155,532 $53,325 0 $0 Parks and Recreation
29 $123,702 $51,187 4 $7,835 Sewerage
27 $116,761 $51,894 0 $0 Other and Unallocable
27 $130,845 $58,153 0 $0 Financial Administration
16 $81,839 $61,379 1 $3,200 Streets and Highways
15 $57,170 $45,736 0 $0 Police - Other
14 $56,568 $48,487 0 $0 Other Government Administration
14 $126,072 $108,062 1 $4,737 Health
12 $57,490 $57,490 0 $0 Judicial and Legal
5 $21,121 $50,690 3 $7,749 Airports
2 $8,416 $50,496 0 $0 Solid Waste Management
2 $9,730 $58,380 0 $0
Totals for Government
332 $1,930,129 $69,764 9 $23,521
Waxahachie government finances - Expenditure in 2021 (per resident):
Construction - Sewerage: $10,521,000 ($231.35)
Water Utilities: $1,518,000 ($33.38)Current Operations - Police Protection: $13,491,000 ($296.66)
General - Other: $11,237,000 ($247.10)Local Fire Protection: $8,673,000 ($190.72)Water Utilities: $7,931,000 ($174.40)Regular Highways: $5,517,000 ($121.32)Sewerage: $5,125,000 ($112.70)Parks and Recreation: $3,989,000 ($87.72)Central Staff Services: $2,842,000 ($62.49)Financial Administration: $2,519,000 ($55.39)Solid Waste Management: $1,407,000 ($30.94)Libraries: $1,146,000 ($25.20)Public Welfare - Other: $653,000 ($14.36)Judicial and Legal Services: $490,000 ($10.77)General Public Buildings: $378,000 ($8.31)Health - Other: $218,000 ($4.79)Miscellaneous Commercial Activities - Other: $197,000 ($4.33)Air Transportation: $24,000 ($0.53)General - Interest on Debt: $3,511,000 ($77.21)
Other Capital Outlay - Solid Waste Management: $186,000 ($4.09)
Regular Highways: $155,000 ($3.41)General - Other: $14,000 ($0.31)Water Utilities - Interest on Debt: $819,000 ($18.01)
Waxahachie government finances - Revenue in 2021 (per resident):
Charges - Sewerage: $10,733,000 ($236.01)
Other: $3,817,000 ($83.93)Solid Waste Management: $1,381,000 ($30.37)Parks and Recreation: $223,000 ($4.90)Miscellaneous Commercial Activities: $172,000 ($3.78)Miscellaneous - General Revenue - Other: $1,048,000 ($23.05)
Interest Earnings: $822,000 ($18.08)Fines and Forfeits: $642,000 ($14.12)Donations From Private Sources: $6,000 ($0.13)Revenue - Water Utilities: $16,704,000 ($367.31)
State Intergovernmental - Other: $781,000 ($17.17)
Tax - Property: $26,452,000 ($581.67)
General Sales and Gross Receipts: $20,829,000 ($458.02)Public Utilities Sales: $3,354,000 ($73.75)Other License: $1,548,000 ($34.04)Other: $781,000 ($17.17)Other Selective Sales: $781,000 ($17.17)
Waxahachie government finances - Debt in 2021 (per resident):
Long Term Debt - Beginning Outstanding - Unspecified Public Purpose: $150,885,000 ($3317.90)
Outstanding Unspecified Public Purpose: $142,075,000 ($3124.18)Retired Unspecified Public Purpose: $8,810,000 ($193.73)
Waxahachie government finances - Cash and Securities in 2021 (per resident):
Bond Funds - Cash and Securities: $15,973,000 ($351.24)
Other Funds - Cash and Securities: $85,186,000 ($1873.21)
Sinking Funds - Cash and Securities: $2,512,000 ($55.24)
11.20% of this county's 2021 resident taxpayers lived in other counties in 2020 ($67,631 average adjusted gross income )
Here:
11.20%Texas average:
8.12%
0.03% of residents moved from foreign countries ($137 average AGI )Ellis County:
0.03%Texas average:
0.04%
Top counties from which taxpayers relocated into this county between 2020 and 2021:
Businesses in Waxahachie, TX
Name Count Name Count
AT&T 2 Lowe's 1 Applebee's 1 MasterBrand Cabinets 2 Arby's 1 Maurices 1 AutoZone 1 McDonald's 1 Blockbuster 1 Nike 2 Burger King 1 Office Depot 1 CVS 1 Olive Garden 1 Chevrolet 1 Panda Express 1 Chick-Fil-A 1 Payless 1 Church's Chicken 1 Penske 2 Circle K 2 PetSmart 1 ColorTyme 1 Pizza Hut 1 Dairy Queen 1 Quiznos 1 Discount Tire 1 RadioShack 1 Domino's Pizza 1 Rue21 1 Famous Footwear 1 Ryan's Grill 1 FedEx 5 SONIC Drive-In 1 Firestone Complete Auto Care 1 Sears 1 Ford 1 Sprint Nextel 1 GNC 1 Starbucks 2 GameStop 1 Subway 2 H&R Block 1 Super 8 1 Holiday Inn 1 T-Mobile 3 Home Depot 1 Taco Bell 1 IHOP 1 Target 1 JCPenney 1 U-Haul 3 Jack In The Box 1 UPS 3 Jones New York 1 Vans 1 KFC 1 Waffle House 1 Knights Inn 1 Walgreens 1 La Quinta 1 Walmart 1 Lane Furniture 2 Wendy's 1 Long John Silver's 1 YMCA 1
Strongest AM radio stations in Waxahachie:
WBAP (820 AM; 50 kW; FORT WORTH, TX; Owner: WBAP-KSCS OPERATING, LTD.)
KESS (1270 AM; 50 kW; FORT WORTH, TX; Owner: KESS-AM LICENSE CORP.)
KSKY (660 AM; 20 kW; BALCH SPRINGS, TX; Owner: BISON MEDIA, INC.)
KZMP (1540 AM; 50 kW; UNIVERSITY PARK, TX; Owner: ENTRAVISION HOLDINGS, LLC)
KRLD (1080 AM; 50 kW; DALLAS, TX; Owner: TEXAS INFINITY BROADCASTING L.P.)
KFXR (1190 AM; 50 kW; DALLAS, TX; Owner: CLEAR CHANNEL BROADCASTING LICENSES, INC.)
KBEC (1390 AM; 0 kW; WAXAHACHIE, TX; Owner: FAYE AND RICHARD TUCK, INC.)
KAHZ (1360 AM; 50 kW; HURST, TX)
KBIS (1150 AM; 25 kW; HIGHLAND PARK, TX; Owner: DALLAS AM RADIO PARTNERS, L.P.)
KHCK (1480 AM; 5 kW; DALLAS, TX; Owner: KMRT-AM LICENSE CORPORATION)
KHVN (970 AM; 10 kW; FORT WORTH, TX; Owner: MORTENSON BROADCASTING COMPANY)
KGGR (1040 AM; daytime; 5 kW; DALLAS, TX; Owner: MORTENSON BROADCASTING COMPANY)
KNAX (1630 AM; 10 kW; FT. WORTH, TX; Owner: MORTENSON BROADCASTING COMPANY)
Strongest FM radio stations in Waxahachie:
KRBV (100.3 FM; DALLAS, TX; Owner: INFINITY BROADCASTING CORP. OF FORT WORTH)
KEGL (97.1 FM; FORT WORTH, TX; Owner: CITICASTERS LICENSES, L.P.)
KLLI (105.3 FM; DALLAS, TX; Owner: INFINITY BROADCASTING CORPORATION OF DALLAS)
KOAI (107.5 FM; FORT WORTH, TX; Owner: INFINITY KOAI-FM, INC.)
KVIL-FM (103.7 FM; HIGHLAND PARK-DALLAS, TX; Owner: INFINITY BROADCASTING CORPORATION OF TEXAS)
KHKS (106.1 FM; DENTON, TX; Owner: AMFM TEXAS LICENSES LIMITED PARTNERSHIP)
KKDA-FM (104.5 FM; DALLAS, TX; Owner: SERVICE BROADCASTING I, LTD.)
KZPS (92.5 FM; DALLAS, TX; Owner: AMFM TEXAS LICENSES LIMITED PARTNERSHIP)
KBFB (97.9 FM; DALLAS, TX; Owner: RADIO ONE LICENSES, LLC)
KSCS (96.3 FM; FORT WORTH, TX; Owner: WBAP-KSCS OPERATING, LTD.)
KLNO (94.1 FM; FORT WORTH, TX; Owner: HBC LICENSE CORPORATION)
KCBI (90.9 FM; DALLAS, TX; Owner: CRISWELL CENTER FOR BIBLICAL STUDIES)
KDGE (102.1 FM; FORT WORTH-DALLAS, TX; Owner: CAPSTAR TX LIMITED PARTNERSHIP)
KERA (90.1 FM; DALLAS, TX; Owner: NORTH TEXAS PUBLIC BROADCASTING, INC.)
KDMX (102.9 FM; DALLAS, TX; Owner: CITICASTERS LICENSES, L.P.)
KVTT (91.7 FM; DALLAS, TX; Owner: RESEARCH EDUCATIONAL FOUNDATION, INC)
KNON (89.3 FM; DALLAS, TX; Owner: AGAPE BROADCASTING FOUNDATION, INC.)
KLUV-FM (98.7 FM; DALLAS, TX; Owner: INFINITY BROADCASTING CORPORATION OF DALLAS)
WRR (101.1 FM; DALLAS, TX; Owner: CITY OF DALLAS, TEXAS)
KPLX (99.5 FM; FORT WORTH, TX; Owner: KPLX LICO, INC.)
TV broadcast stations around Waxahachie:
KTVT (Channel 11; FORT WORTH, TX; Owner: CBS STATIONS GROUP OF TEXAS L.P.)
KDAF (Channel 33; DALLAS, TX; Owner: TRIBUNE TELEVISION COMPANY)
KDFI (Channel 27; DALLAS, TX; Owner: NEW DMIC, INC.)
KXAS-TV (Channel 5; FORT WORTH, TX; Owner: STATION VENTURE OPERATIONS, LP)
KDTN (Channel 2; DENTON, TX; Owner: NORTH TEXAS PUBLIC BROADCASTING, INC.)
KERA-TV (Channel 13; DALLAS, TX; Owner: NORTH TEXAS PUBLIC BROADCASTING, INC.)
KMPX (Channel 29; DECATUR, TX; Owner: WORD OF GOD FELLOWSHIP, INC.)
KUVN (Channel 23; GARLAND, TX; Owner: KUVN LICENSE PARTNERSHIP, L.P.)
KTXA (Channel 21; FORT WORTH, TX; Owner: VIACOM TELEVISION STATIONS GROUP OF DALLAS/FORT WORTH L.P.)
KSTR-TV (Channel 49; IRVING, TX; Owner: TELEFUTURA DALLAS LLC)
KPXD (Channel 68; ARLINGTON, TX; Owner: PAXSON DALLAS LICENSE, INC.)
WFAA-TV (Channel 8; DALLAS, TX; Owner: WFAA-TV, L.P.)
KXTX-TV (Channel 39; DALLAS, TX; Owner: TELEMUNDO OF TEXAS PARTNERSHIP, LP)
KDFW (Channel 4; DALLAS, TX; Owner: KDFW LICENSE, INC.)
KDTX-TV (Channel 58; DALLAS, TX; Owner: TRINITY BROADCASTING OF TEXAS, INC.)
KATA-LP (Channel 60; MESQUITE, TX; Owner: JANE McGINNIS)
K26HF (Channel 26; BRITTON, TX; Owner: MAKO COMMUNICATIONS, LLC)
KHPK-LP (Channel 28; DE SOTO, TX; Owner: MAKO COMMUNICATIONS, LLC)
KVFW-LP (Channel 65; FORT WORTH, TX; Owner: GERALD BENAVIDES)
K25FW (Channel 25; CORSICANA, TX; Owner: VENTANA TELEVISION, INC.)
KFWD (Channel 52; FORT WORTH, TX; Owner: HIC BROADCAST, INC.)
KLDT (Channel 55; LAKE DALLAS, TX; Owner: JOHNSON BROADCASTING OF DALLAS, INC.)
KJJM-LP (Channel 46; DALLAS/MESQUITE, TX; Owner: JANE McGINNIS)
KSEX-LP (Channel 57; DALLAS, TX; Owner: COMMERCIAL BROADCASTING CORP.)
KLEG-LP (Channel 44; DALLAS, TX; Owner: DILIP VISWANATH)
National Bridge Inventory (NBI) Statistics 176 Number of bridges2,057ft / 627m Total length $800,000 Total costs2,268,558 Total average daily traffic461,574 Total average daily truck traffic
New bridges - historical statistics
2 1920-1929 1 1930-1939 25 1950-1959 6 1960-1969 58 1970-1979 11 1980-1989 16 1990-1999 16 2000-2009 38 2010-2019 3 2020-2022
See full National Bridge Inventory statistics for Waxahachie, TX
Home Mortgage Disclosure Act Aggregated Statistics For Year 2009(Based on 4 full and 2 partial tracts) A) FHA, FSA/RHS & VA B) Conventional C) Refinancings D) Home Improvement Loans E) Loans on Dwellings For 5+ Families F) Non-occupant Loans on G) Loans On Manufactured Number Average Value Number Average Value Number Average Value Number Average Value Number Average Value Number Average Value Number Average Value
LOANS ORIGINATED 124 $133,428 120 $122,251 273 $147,909 41 $34,029 2 $3,565,640 60 $76,141 4 $70,920 APPLICATIONS APPROVED, NOT ACCEPTED 10 $110,262 11 $106,045 31 $141,518 5 $26,352 0 $0 4 $83,532 0 $0 APPLICATIONS DENIED 22 $122,839 22 $122,082 117 $132,526 32 $49,575 1 $3,000,000 17 $78,589 4 $74,425 APPLICATIONS WITHDRAWN 13 $136,194 18 $151,569 64 $142,551 5 $54,456 1 $3,080,000 7 $114,419 1 $26,410 FILES CLOSED FOR INCOMPLETENESS 5 $109,484 6 $108,760 23 $133,425 2 $162,595 0 $0 2 $79,275 1 $48,930
Aggregated Statistics For Year 2008(Based on 4 full and 2 partial tracts) A) FHA, FSA/RHS & VA B) Conventional C) Refinancings D) Home Improvement Loans E) Loans on Dwellings For 5+ Families F) Non-occupant Loans on G) Loans On Manufactured Number Average Value Number Average Value Number Average Value Number Average Value Number Average Value Number Average Value Number Average Value
LOANS ORIGINATED 105 $131,851 216 $129,687 148 $136,666 35 $52,600 2 $389,500 92 $88,423 6 $69,433 APPLICATIONS APPROVED, NOT ACCEPTED 7 $105,500 13 $138,514 25 $125,361 4 $17,008 0 $0 4 $140,542 2 $62,225 APPLICATIONS DENIED 20 $126,158 57 $152,799 143 $122,535 63 $38,742 1 $4,100,000 19 $66,995 8 $62,011 APPLICATIONS WITHDRAWN 14 $118,643 23 $126,757 38 $119,731 8 $67,610 1 $3,300,000 9 $74,880 0 $0 FILES CLOSED FOR INCOMPLETENESS 3 $74,060 12 $166,464 7 $143,147 4 $75,510 0 $0 4 $100,045 0 $0
Aggregated Statistics For Year 2007(Based on 4 full and 2 partial tracts) A) FHA, FSA/RHS & VA B) Conventional C) Refinancings D) Home Improvement Loans E) Loans on Dwellings For 5+ Families F) Non-occupant Loans on G) Loans On Manufactured Number Average Value Number Average Value Number Average Value Number Average Value Number Average Value Number Average Value Number Average Value
LOANS ORIGINATED 79 $125,789 392 $118,331 157 $128,939 64 $44,808 1 $4,888,000 112 $86,431 8 $66,454 APPLICATIONS APPROVED, NOT ACCEPTED 4 $108,242 57 $125,205 49 $117,288 15 $34,477 0 $0 16 $96,662 5 $63,738 APPLICATIONS DENIED 13 $118,844 124 $116,399 238 $122,527 63 $39,712 1 $4,000 36 $94,184 14 $51,627 APPLICATIONS WITHDRAWN 4 $105,942 49 $113,663 112 $109,691 13 $70,194 1 $1,538,000 25 $85,664 0 $0 FILES CLOSED FOR INCOMPLETENESS 1 $140,090 14 $126,032 40 $140,690 2 $44,785 0 $0 5 $89,560 0 $0
Aggregated Statistics For Year 2006(Based on 4 full and 2 partial tracts) A) FHA, FSA/RHS & VA B) Conventional C) Refinancings D) Home Improvement Loans E) Loans on Dwellings For 5+ Families F) Non-occupant Loans on G) Loans On Manufactured Number Average Value Number Average Value Number Average Value Number Average Value Number Average Value Number Average Value Number Average Value
LOANS ORIGINATED 79 $120,538 526 $95,836 199 $115,648 52 $37,417 4 $3,780,000 135 $73,169 8 $71,878 APPLICATIONS APPROVED, NOT ACCEPTED 3 $135,513 82 $99,519 42 $121,960 13 $31,458 0 $0 20 $101,126 2 $69,605 APPLICATIONS DENIED 8 $113,292 140 $102,219 169 $104,532 75 $33,978 1 $192,000 36 $77,396 10 $42,829 APPLICATIONS WITHDRAWN 12 $164,824 78 $105,012 129 $109,222 15 $61,691 0 $0 22 $91,980 2 $45,640 FILES CLOSED FOR INCOMPLETENESS 0 $0 15 $89,406 47 $115,435 1 $57,070 0 $0 6 $66,177 0 $0
Aggregated Statistics For Year 2005(Based on 4 full and 2 partial tracts) A) FHA, FSA/RHS & VA B) Conventional C) Refinancings D) Home Improvement Loans E) Loans on Dwellings For 5+ Families F) Non-occupant Loans on G) Loans On Manufactured Number Average Value Number Average Value Number Average Value Number Average Value Number Average Value Number Average Value Number Average Value
LOANS ORIGINATED 113 $111,892 546 $97,494 304 $108,076 48 $71,217 4 $1,876,500 117 $97,919 6 $62,777 APPLICATIONS APPROVED, NOT ACCEPTED 9 $98,838 79 $86,176 48 $105,446 18 $58,590 0 $0 19 $71,593 8 $47,081 APPLICATIONS DENIED 14 $120,734 171 $90,751 279 $99,043 82 $33,785 0 $0 48 $69,702 15 $50,287 APPLICATIONS WITHDRAWN 10 $118,004 77 $98,500 167 $134,866 24 $210,988 0 $0 26 $134,693 3 $39,103 FILES CLOSED FOR INCOMPLETENESS 1 $151,860 11 $104,501 103 $113,780 2 $139,625 0 $0 3 $148,623 0 $0
Aggregated Statistics For Year 2004(Based on 4 full and 2 partial tracts) A) FHA, FSA/RHS & VA B) Conventional C) Refinancings D) Home Improvement Loans E) Loans on Dwellings For 5+ Families F) Non-occupant Loans on G) Loans On Manufactured Number Average Value Number Average Value Number Average Value Number Average Value Number Average Value Number Average Value Number Average Value
LOANS ORIGINATED 115 $115,478 434 $98,333 361 $112,795 52 $45,286 1 $1,403,000 113 $70,927 5 $58,282 APPLICATIONS APPROVED, NOT ACCEPTED 8 $126,988 56 $99,318 45 $122,622 9 $78,853 0 $0 9 $69,647 2 $71,025 APPLICATIONS DENIED 26 $113,818 92 $84,034 306 $103,332 67 $37,035 0 $0 43 $87,134 14 $50,231 APPLICATIONS WITHDRAWN 21 $109,480 70 $87,671 161 $101,866 15 $82,167 0 $0 18 $81,038 2 $61,870 FILES CLOSED FOR INCOMPLETENESS 0 $0 14 $106,151 105 $110,358 3 $79,477 0 $0 8 $68,799 0 $0
Aggregated Statistics For Year 2003(Based on 4 full and 2 partial tracts) A) FHA, FSA/RHS & VA B) Conventional C) Refinancings D) Home Improvement Loans E) Loans on Dwellings For 5+ Families F) Non-occupant Loans on Number Average Value Number Average Value Number Average Value Number Average Value Number Average Value Number Average Value
LOANS ORIGINATED 117 $111,956 329 $104,392 672 $102,459 51 $34,002 1 $249,000 92 $68,408 APPLICATIONS APPROVED, NOT ACCEPTED 6 $109,478 56 $87,176 101 $101,012 12 $30,907 0 $0 19 $65,953 APPLICATIONS DENIED 25 $96,467 106 $80,091 314 $96,137 62 $28,332 0 $0 28 $67,410 APPLICATIONS WITHDRAWN 20 $106,042 55 $98,915 200 $98,540 5 $53,236 0 $0 13 $73,067 FILES CLOSED FOR INCOMPLETENESS 5 $106,688 28 $92,482 32 $114,438 0 $0 0 $0 6 $69,942
Aggregated Statistics For Year 2002(Based on 4 full and 1 partial tracts) A) FHA, FSA/RHS & VA B) Conventional C) Refinancings D) Home Improvement Loans F) Non-occupant Loans on Number Average Value Number Average Value Number Average Value Number Average Value Number Average Value
LOANS ORIGINATED 101 $102,838 250 $93,936 368 $90,348 54 $31,468 58 $59,284 APPLICATIONS APPROVED, NOT ACCEPTED 6 $91,333 28 $97,401 65 $89,191 17 $32,848 10 $64,320 APPLICATIONS DENIED 16 $105,816 90 $58,342 138 $71,637 41 $21,808 14 $63,265 APPLICATIONS WITHDRAWN 12 $96,560 22 $101,487 108 $82,210 5 $13,862 7 $76,289 FILES CLOSED FOR INCOMPLETENESS 3 $84,747 24 $86,750 20 $94,702 0 $0 3 $67,000
Aggregated Statistics For Year 2001(Based on 4 full and 1 partial tracts) A) FHA, FSA/RHS & VA B) Conventional C) Refinancings D) Home Improvement Loans F) Non-occupant Loans on Number Average Value Number Average Value Number Average Value Number Average Value Number Average Value
LOANS ORIGINATED 75 $98,002 254 $85,208 291 $86,388 55 $29,454 71 $55,410 APPLICATIONS APPROVED, NOT ACCEPTED 8 $97,428 41 $57,022 37 $83,334 8 $20,961 4 $55,000 APPLICATIONS DENIED 5 $78,702 115 $54,004 102 $70,523 42 $23,137 16 $43,749 APPLICATIONS WITHDRAWN 2 $113,305 21 $87,685 66 $78,026 6 $15,155 3 $46,000 FILES CLOSED FOR INCOMPLETENESS 1 $123,510 12 $49,742 19 $69,922 1 $14,660 1 $64,000
Aggregated Statistics For Year 2000(Based on 4 full and 1 partial tracts) A) FHA, FSA/RHS & VA B) Conventional C) Refinancings D) Home Improvement Loans E) Loans on Dwellings For 5+ Families F) Non-occupant Loans on Number Average Value Number Average Value Number Average Value Number Average Value Number Average Value Number Average Value
LOANS ORIGINATED 95 $97,145 248 $79,410 107 $73,046 63 $21,186 1 $2,000,000 43 $48,070 APPLICATIONS APPROVED, NOT ACCEPTED 4 $71,315 46 $70,177 15 $76,487 21 $19,155 0 $0 6 $51,568 APPLICATIONS DENIED 9 $75,682 272 $45,706 58 $53,378 71 $13,162 0 $0 22 $39,935 APPLICATIONS WITHDRAWN 8 $81,901 20 $79,724 52 $64,202 10 $22,176 0 $0 5 $127,764 FILES CLOSED FOR INCOMPLETENESS 1 $104,700 6 $150,350 25 $81,275 0 $0 0 $0 3 $43,667
Aggregated Statistics For Year 1999(Based on 4 full and 2 partial tracts) A) FHA, FSA/RHS & VA B) Conventional C) Refinancings D) Home Improvement Loans E) Loans on Dwellings For 5+ Families F) Non-occupant Loans on Number Average Value Number Average Value Number Average Value Number Average Value Number Average Value Number Average Value
LOANS ORIGINATED 125 $86,620 330 $82,529 233 $81,305 66 $21,756 1 $1,120,000 48 $48,164 APPLICATIONS APPROVED, NOT ACCEPTED 10 $79,069 94 $60,801 47 $75,647 31 $20,019 0 $0 13 $56,082 APPLICATIONS DENIED 14 $87,831 496 $49,956 65 $192,653 69 $15,345 0 $0 26 $58,037 APPLICATIONS WITHDRAWN 8 $74,588 37 $88,186 69 $64,446 2 $24,865 0 $0 5 $57,260 FILES CLOSED FOR INCOMPLETENESS 5 $85,664 6 $103,512 24 $69,334 3 $16,087 0 $0 0 $0
Detailed HMDA statistics for the following Tracts:
0602.03
, 0602.05 , 0603.00 , 0604.00 , 0605.00 , 0606.00
Private Mortgage Insurance Companies Aggregated Statistics For Year 2009(Based on 4 full and 2 partial tracts) A) Conventional B) Refinancings C) Non-occupant Loans on Number Average Value Number Average Value Number Average Value
LOANS ORIGINATED 22 $148,533 15 $170,986 0 $0 APPLICATIONS APPROVED, NOT ACCEPTED 8 $183,178 6 $150,077 1 $103,930 APPLICATIONS DENIED 3 $158,973 5 $249,402 0 $0 APPLICATIONS WITHDRAWN 3 $201,533 2 $104,935 0 $0 FILES CLOSED FOR INCOMPLETENESS 0 $0 1 $85,180 0 $0
Aggregated Statistics For Year 2008(Based on 4 full and 2 partial tracts) A) Conventional B) Refinancings C) Non-occupant Loans on Number Average Value Number Average Value Number Average Value
LOANS ORIGINATED 60 $150,913 14 $188,827 7 $96,350 APPLICATIONS APPROVED, NOT ACCEPTED 31 $142,378 5 $231,516 3 $121,707 APPLICATIONS DENIED 6 $143,818 0 $0 3 $84,280 APPLICATIONS WITHDRAWN 1 $161,110 1 $141,990 0 $0 FILES CLOSED FOR INCOMPLETENESS 2 $110,975 0 $0 1 $139,450
Aggregated Statistics For Year 2007(Based on 4 full and 2 partial tracts) A) Conventional B) Refinancings C) Non-occupant Loans on Number Average Value Number Average Value Number Average Value
LOANS ORIGINATED 107 $132,449 15 $149,983 15 $86,682 APPLICATIONS APPROVED, NOT ACCEPTED 18 $126,253 7 $266,159 1 $111,770 APPLICATIONS DENIED 4 $126,695 1 $107,750 0 $0 APPLICATIONS WITHDRAWN 4 $164,185 2 $100,680 0 $0 FILES CLOSED FOR INCOMPLETENESS 1 $65,000 0 $0 0 $0
Aggregated Statistics For Year 2006(Based on 4 full and 2 partial tracts) A) Conventional B) Refinancings C) Non-occupant Loans on D) Loans On Manufactured Number Average Value Number Average Value Number Average Value Number Average Value
LOANS ORIGINATED 62 $111,940 7 $136,766 11 $79,861 1 $41,840 APPLICATIONS APPROVED, NOT ACCEPTED 13 $127,042 4 $133,590 2 $74,000 0 $0 APPLICATIONS DENIED 1 $322,960 0 $0 0 $0 0 $0 APPLICATIONS WITHDRAWN 3 $155,457 1 $219,980 2 $103,000 0 $0 FILES CLOSED FOR INCOMPLETENESS 1 $132,000 0 $0 0 $0 0 $0
Aggregated Statistics For Year 2005(Based on 4 full and 2 partial tracts) A) Conventional B) Refinancings C) Non-occupant Loans on Number Average Value Number Average Value Number Average Value
LOANS ORIGINATED 63 $118,500 19 $125,852 10 $93,283 APPLICATIONS APPROVED, NOT ACCEPTED 20 $114,364 4 $163,700 2 $80,725 APPLICATIONS DENIED 1 $268,140 0 $0 0 $0 APPLICATIONS WITHDRAWN 8 $87,691 1 $138,170 5 $68,400 FILES CLOSED FOR INCOMPLETENESS 3 $103,007 0 $0 0 $0
Aggregated Statistics For Year 2004(Based on 4 full and 2 partial tracts) A) Conventional B) Refinancings C) Non-occupant Loans on Number Average Value Number Average Value Number Average Value
LOANS ORIGINATED 92 $110,273 25 $151,791 11 $74,178 APPLICATIONS APPROVED, NOT ACCEPTED 15 $119,892 9 $163,942 2 $74,700 APPLICATIONS DENIED 1 $126,000 1 $132,000 0 $0 APPLICATIONS WITHDRAWN 8 $91,711 4 $158,940 2 $66,505 FILES CLOSED FOR INCOMPLETENESS 1 $171,000 1 $106,880 0 $0
Aggregated Statistics For Year 2003(Based on 4 full and 2 partial tracts) A) Conventional B) Refinancings C) Non-occupant Loans on Number Average Value Number Average Value Number Average Value
LOANS ORIGINATED 85 $117,382 53 $133,998 9 $82,607 APPLICATIONS APPROVED, NOT ACCEPTED 17 $111,133 14 $181,911 3 $84,493 APPLICATIONS DENIED 1 $132,230 1 $102,920 1 $58,000 APPLICATIONS WITHDRAWN 2 $216,335 2 $165,385 1 $139,500 FILES CLOSED FOR INCOMPLETENESS 0 $0 0 $0 0 $0
Aggregated Statistics For Year 2002(Based on 4 full and 1 partial tracts) A) Conventional B) Refinancings C) Non-occupant Loans on Number Average Value Number Average Value Number Average Value
LOANS ORIGINATED 71 $109,398 25 $123,729 10 $70,888 APPLICATIONS APPROVED, NOT ACCEPTED 7 $95,060 4 $101,872 2 $65,055 APPLICATIONS DENIED 1 $224,000 0 $0 0 $0 APPLICATIONS WITHDRAWN 1 $92,000 1 $136,120 0 $0 FILES CLOSED FOR INCOMPLETENESS 1 $67,570 0 $0 0 $0
Aggregated Statistics For Year 2001(Based on 4 full and 1 partial tracts) A) Conventional B) Refinancings C) Non-occupant Loans on Number Average Value Number Average Value Number Average Value
LOANS ORIGINATED 65 $89,326 16 $95,645 15 $57,027 APPLICATIONS APPROVED, NOT ACCEPTED 5 $127,512 2 $82,500 1 $92,000 APPLICATIONS DENIED 2 $117,970 3 $59,417 2 $66,375 APPLICATIONS WITHDRAWN 0 $0 0 $0 0 $0 FILES CLOSED FOR INCOMPLETENESS 0 $0 0 $0 0 $0
Aggregated Statistics For Year 2000(Based on 4 full and 1 partial tracts) A) Conventional B) Refinancings C) Non-occupant Loans on Number Average Value Number Average Value Number Average Value
LOANS ORIGINATED 61 $97,138 9 $92,948 6 $58,488 APPLICATIONS APPROVED, NOT ACCEPTED 4 $101,802 2 $79,720 0 $0 APPLICATIONS DENIED 2 $78,135 0 $0 1 $30,000 APPLICATIONS WITHDRAWN 5 $62,552 0 $0 1 $61,000 FILES CLOSED FOR INCOMPLETENESS 1 $53,000 0 $0 1 $53,000
Aggregated Statistics For Year 1999(Based on 4 full and 2 partial tracts) A) Conventional B) Refinancings C) Non-occupant Loans on Number Average Value Number Average Value Number Average Value
LOANS ORIGINATED 94 $93,880 26 $103,060 1 $54,000 APPLICATIONS APPROVED, NOT ACCEPTED 8 $101,121 4 $148,392 1 $52,000 APPLICATIONS DENIED 9 $78,730 0 $0 3 $76,290 APPLICATIONS WITHDRAWN 6 $103,080 2 $71,500 1 $69,000 FILES CLOSED FOR INCOMPLETENESS 3 $64,447 1 $136,000 0 $0
Detailed PMIC statistics for the following Tracts:
0602.03
, 0602.05 , 0603.00 , 0604.00 , 0605.00 , 0606.00 Fire-safe hotels and motels in Waxahachie, Texas:
Americas Best Value Inn, 795 I-35e, Waxahachie, Texas 75165 Phone: (972) 937-4982, Fax: (972) 937-3555
Knights Inn, 803 S Ih-35 E, Waxahachie, Texas 75165 Phone: (972) 937-8223, Fax: (972) 923-1225
Hampton Inn & Suites, 2010 Civic Center Ln, Waxahachie, Texas 75165 Phone: (972) 923-0666
Super 8 Waxahachie, 400 Interstate 35 E @ Business 287, Waxahachie, Texas 75165 Phone: (972) 938-9088, Fax: (972) 923-9888
Comfort Suites, 131 RVG Plz, Waxahachie, Texas 75165 Phone: (469) 517-1600, Fax: (469) 517-1605
Laquinta Inn & Suites, 311 Stadium Dr, Waxahachie, Texas 75165 Phone: (972) 937-5525, Fax: (972) 937-5528
Best Western Plus Waxahachie Inn & Suites, 1701 N Hwy 77, Waxahachie, Texas 75165 Phone: (972) 938-1600
All 7 fire-safe hotels and motels in Waxahachie, Texas
Most common first names in Waxahachie, TX among deceased individuals Name Count Lived (average)
James 195 72.5 years Mary 174 79.4 years William 167 75.1 years John 155 75.3 years Robert 103 73.3 years Willie 77 78.9 years George 70 76.8 years Charles 64 73.4 years Annie 61 82.7 years Dorothy 61 75.3 years
Most common last names in Waxahachie, TX among deceased individuals Last name Count Lived (average)
Smith 110 75.0 years Williams 91 76.7 years Johnson 71 73.8 years Brown 71 79.9 years Davis 58 75.8 years Jones 46 73.0 years Taylor 46 77.8 years Jackson 44 78.4 years Moore 41 75.8 years Allen 40 74.3 years
Waxahachie compared to Texas state average:
Black race population percentage significantly above state average. Foreign-born population percentage below state average. Number of college students above state average.
Top Patent Applicants
Nathan Kirk Powell (12)
Paul G. Wilson (9)
Daniel P. Shnowske (7)
Frederick H. Sklar (5)
Louis T. Hahn (5)
Jody R. Mcglothen (4)
Delbert J. Larson (4)
Nathan Powell (4)
Keith Edward Stephens (4)
Denis Muki Tibah (4)
Total of 114 patent applications in 2008-2024.
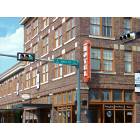

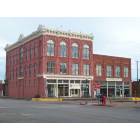
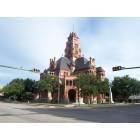
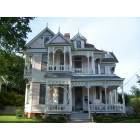
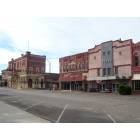
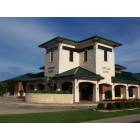

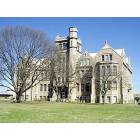

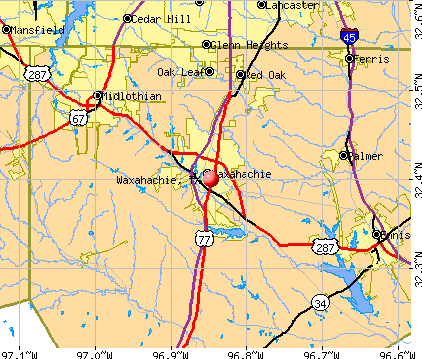


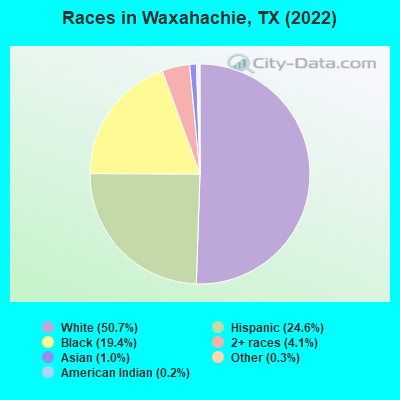
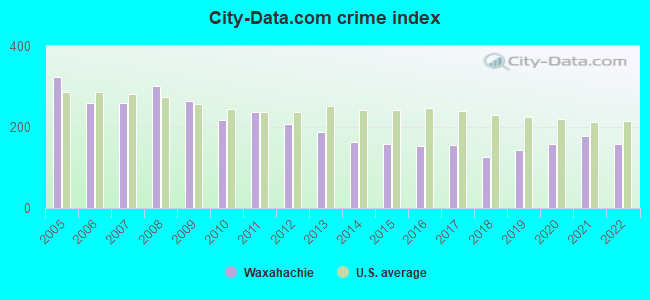
 Recent articles from our blog. Our writers, many of them Ph.D. graduates or candidates, create easy-to-read articles on a wide variety of topics.

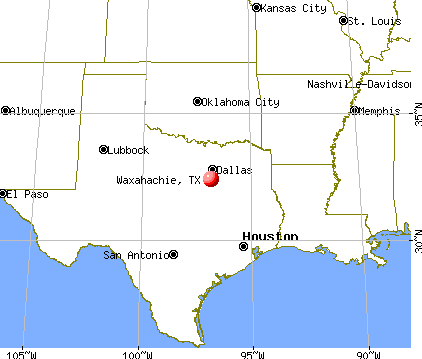
 (24.0 miles
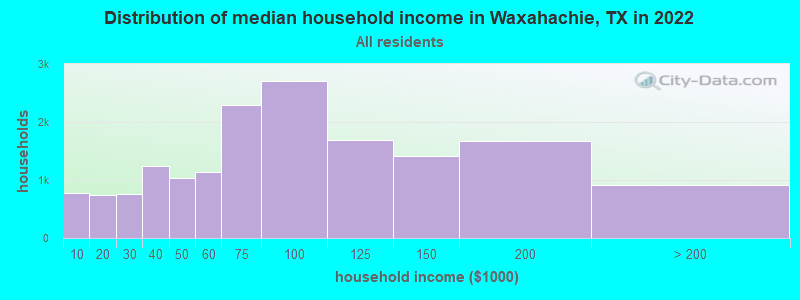
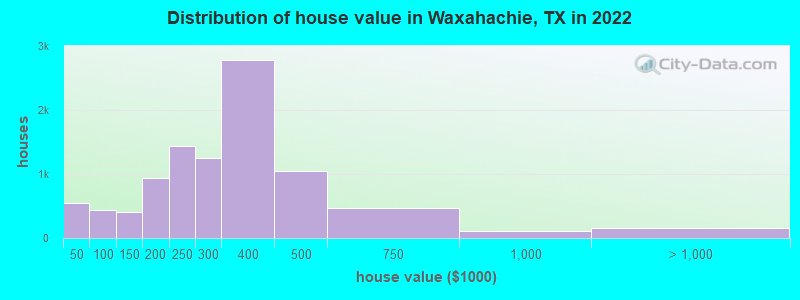
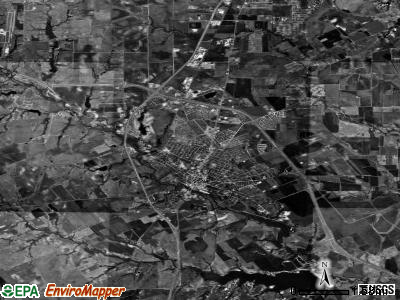
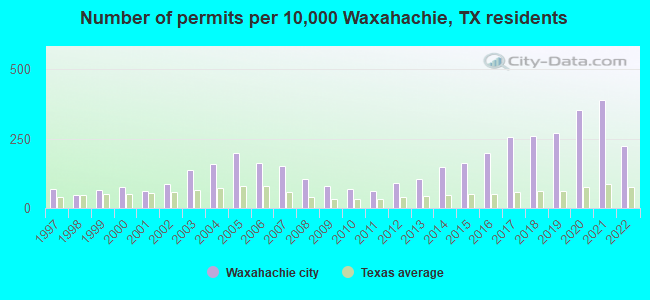
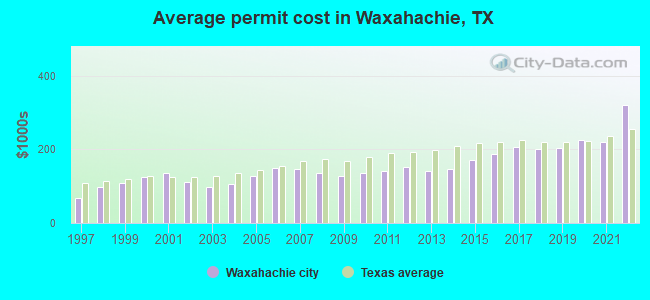
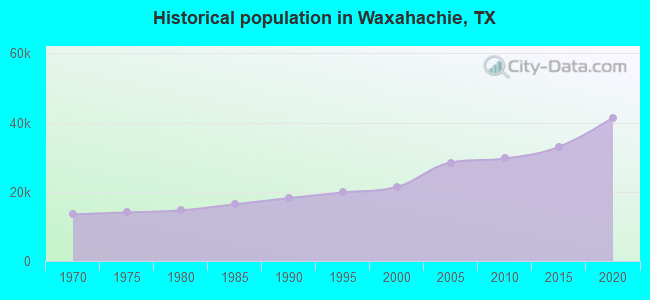
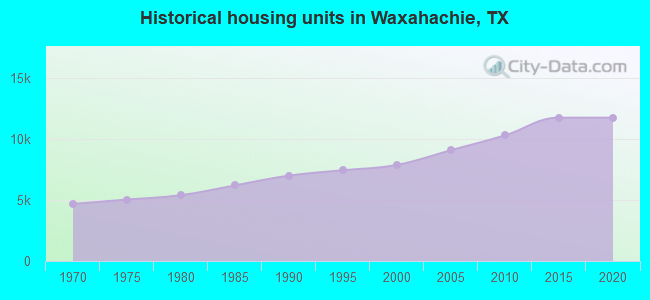
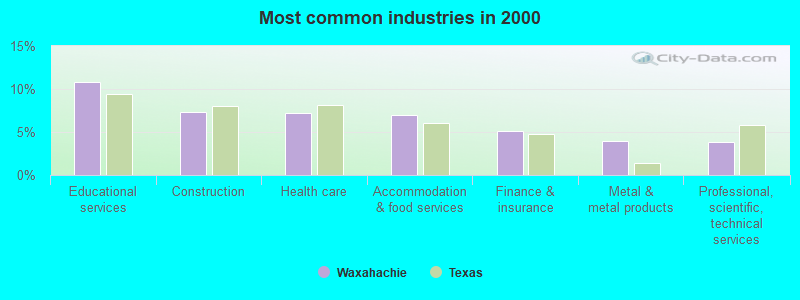
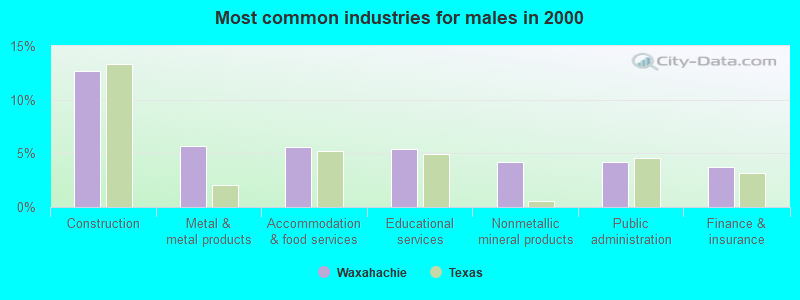
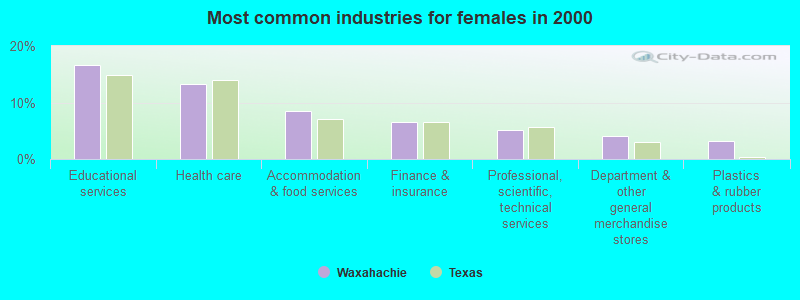
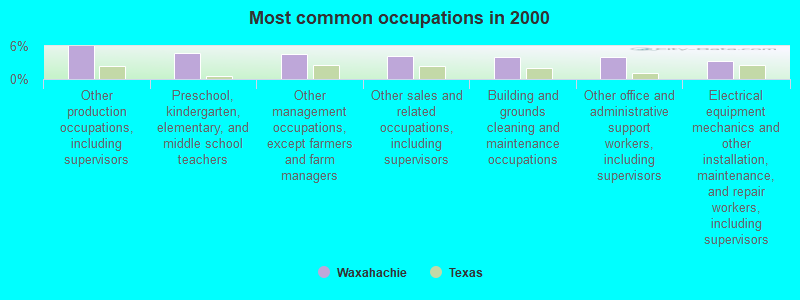
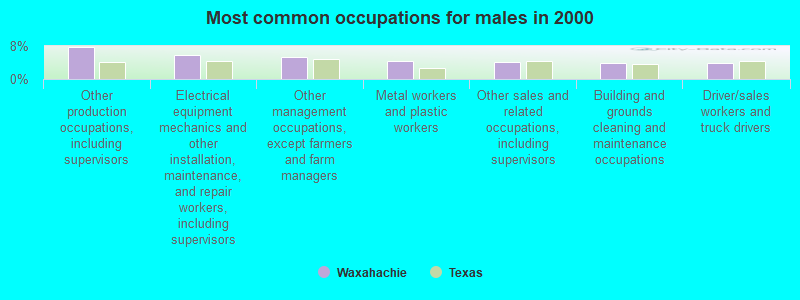
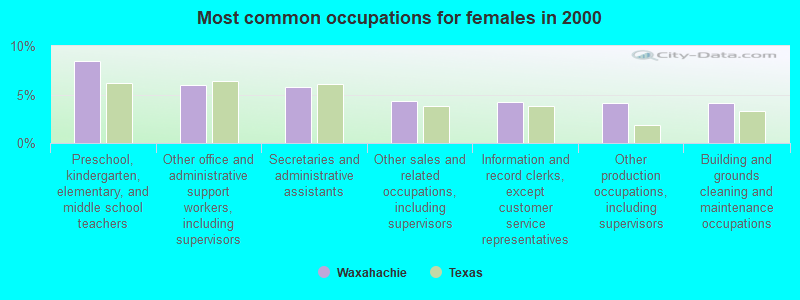


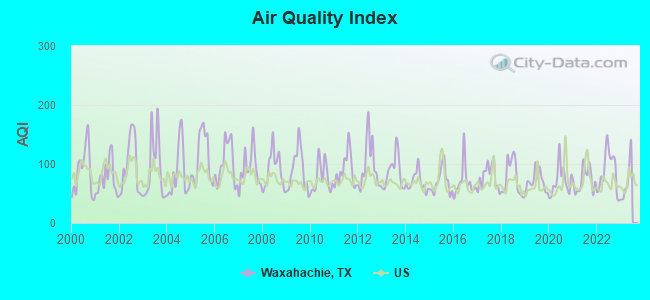
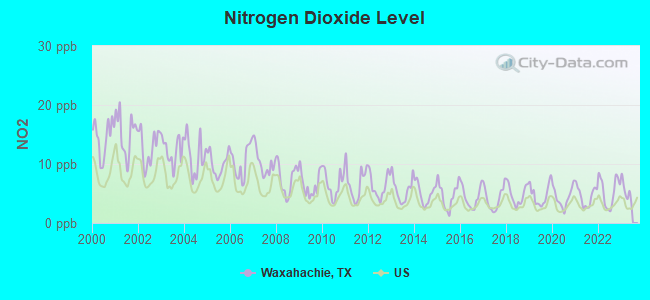
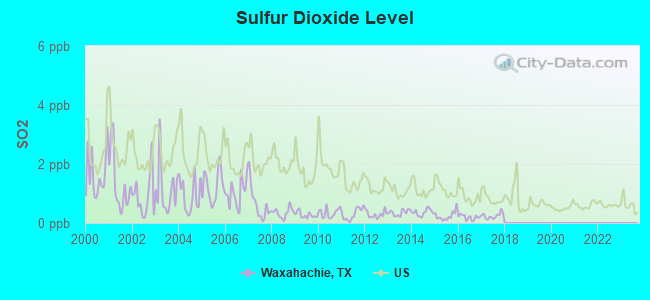
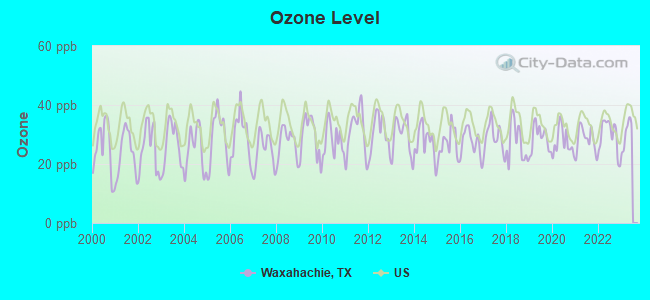
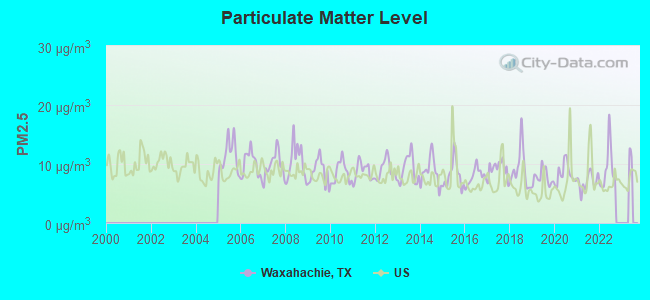

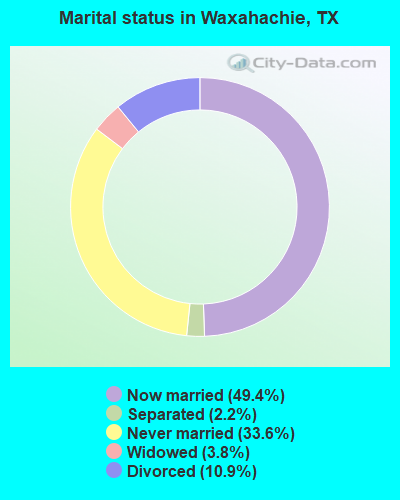
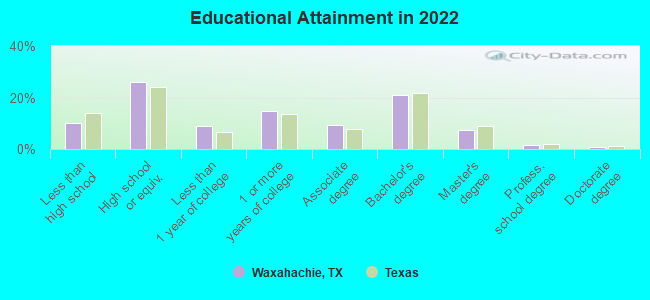
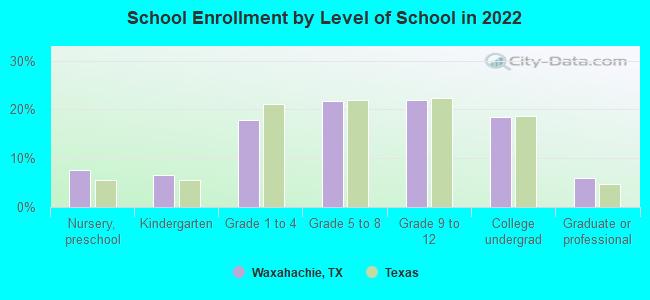
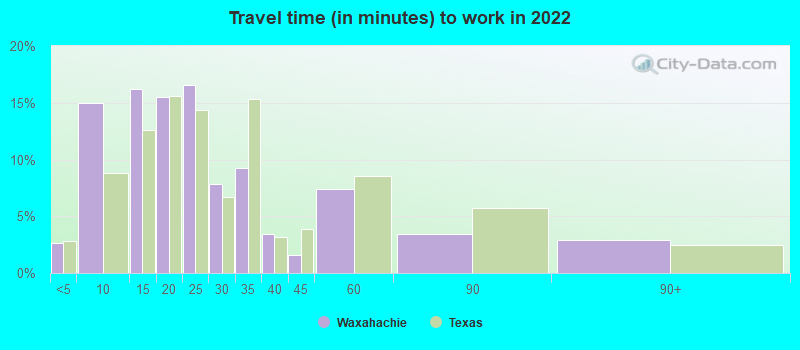
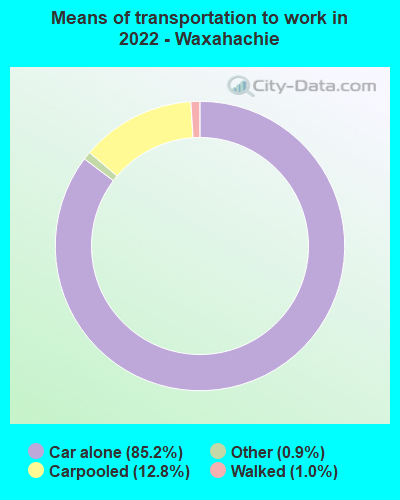
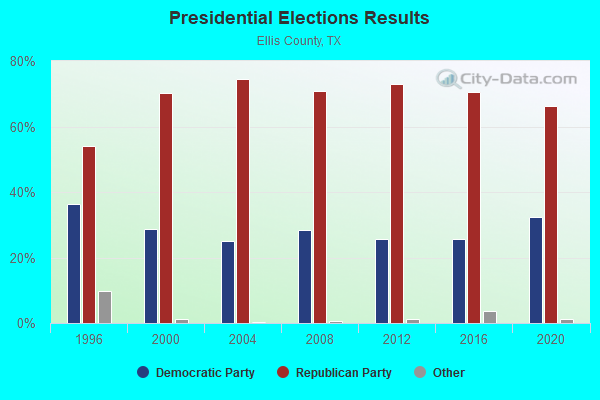
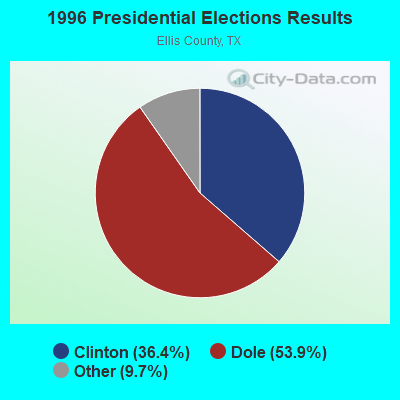
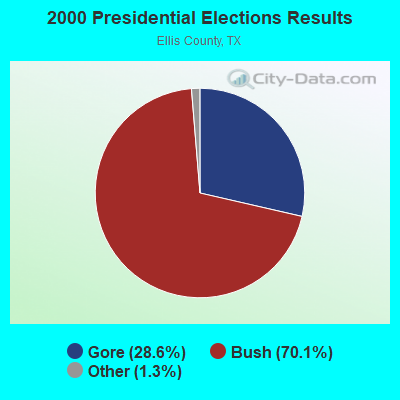
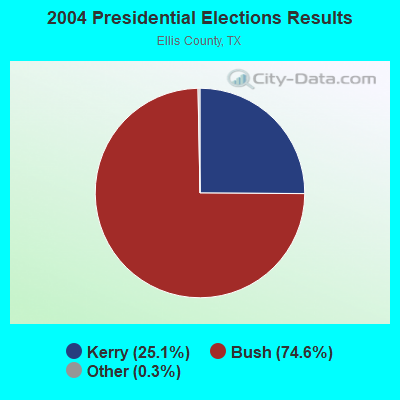

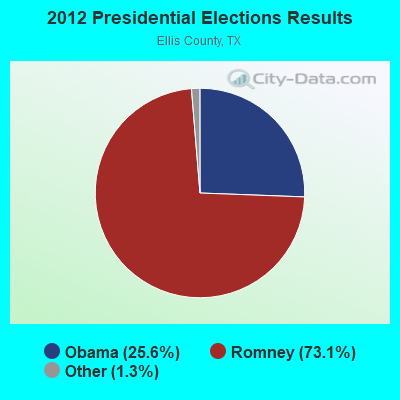
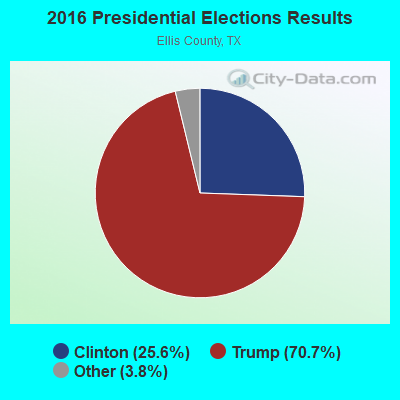
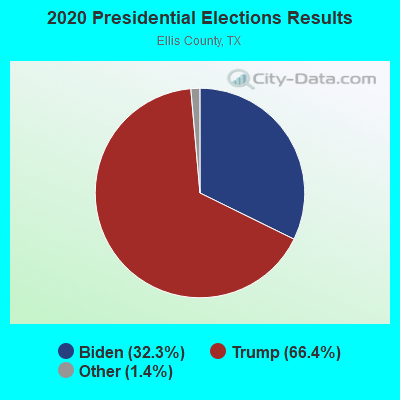
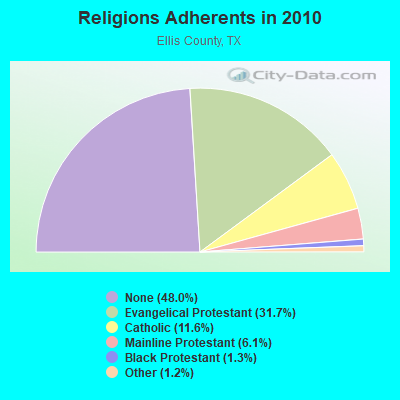
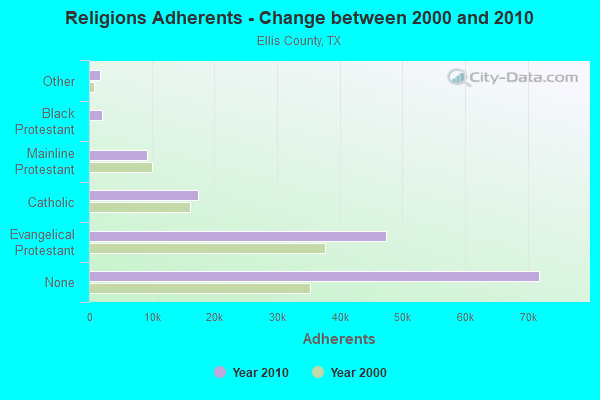
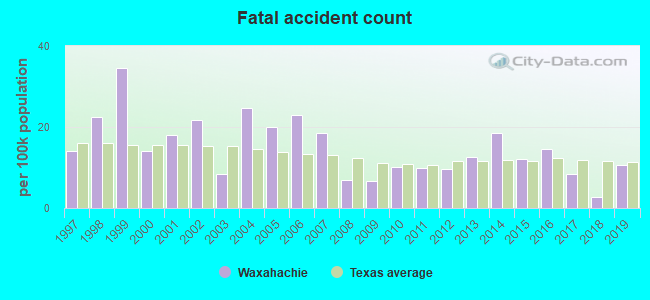
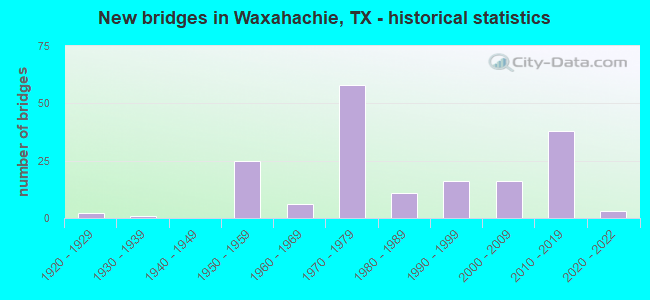
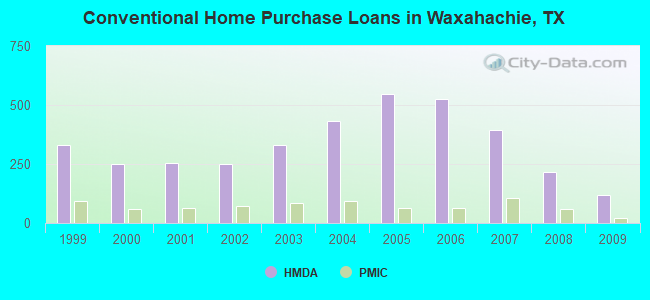
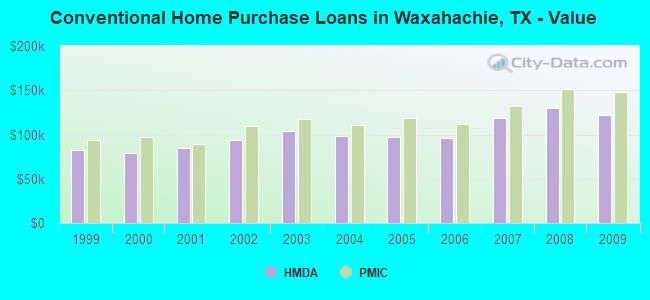
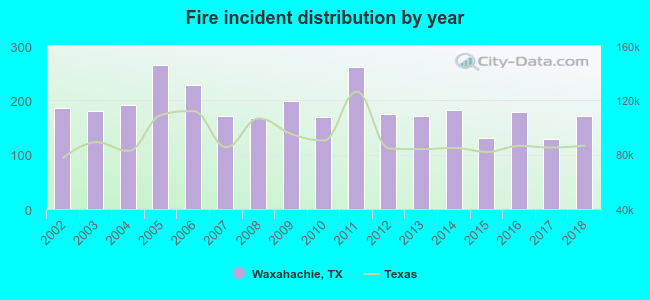 Based on the data from the years 2002 - 2018 the average number of fire incidents per year is 186. The highest number of fire incidents - 265 took place in 2005, and the least - 128 in 2017. The data has a declining trend.
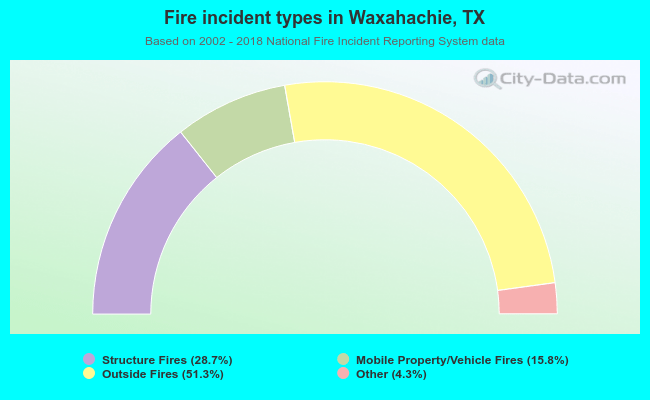 When looking into fire subcategories, the most incidents belonged to: Outside Fires (51.3%), and Structure Fires (28.7%).